

The DOI matches its Crossref record; 5 of the 5 references it cites were found in a registry or an index.
Ancient genomes from southern Africa pushes modern human divergence beyond 260,000 years ago
Abstract
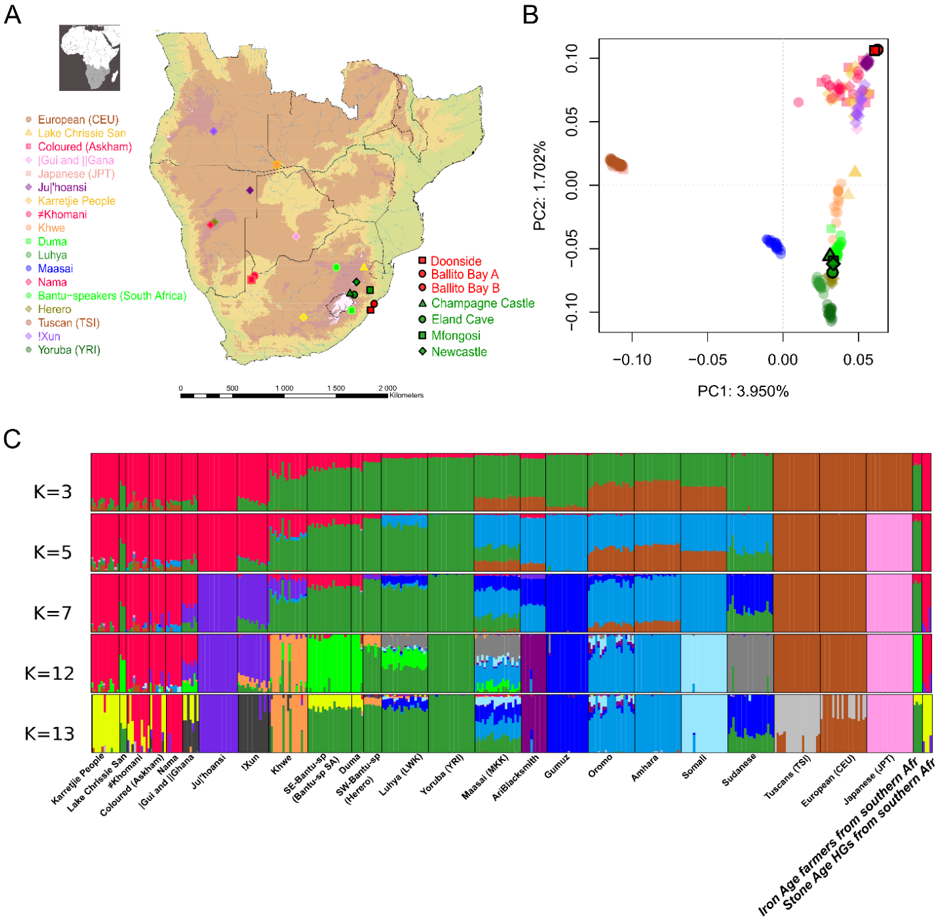
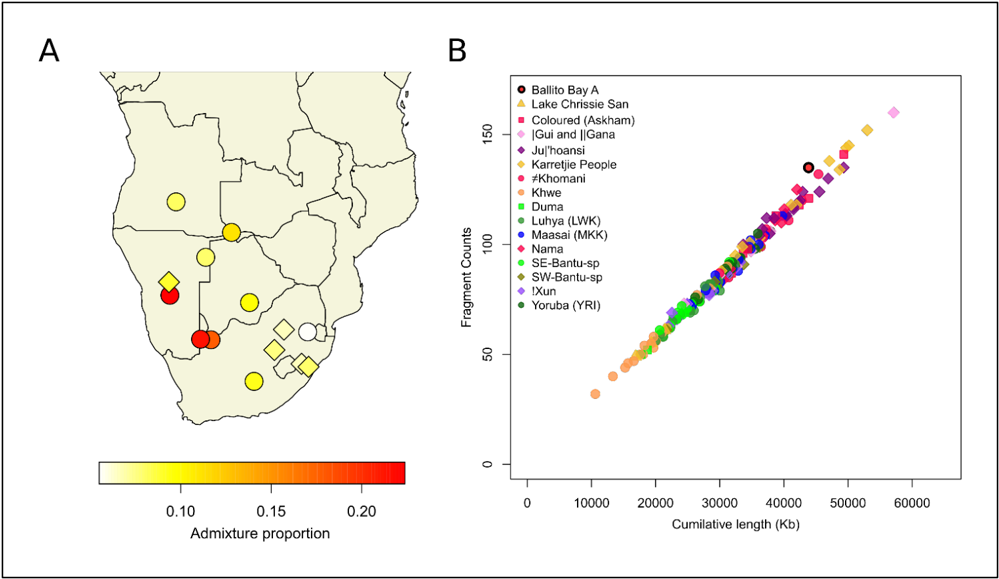
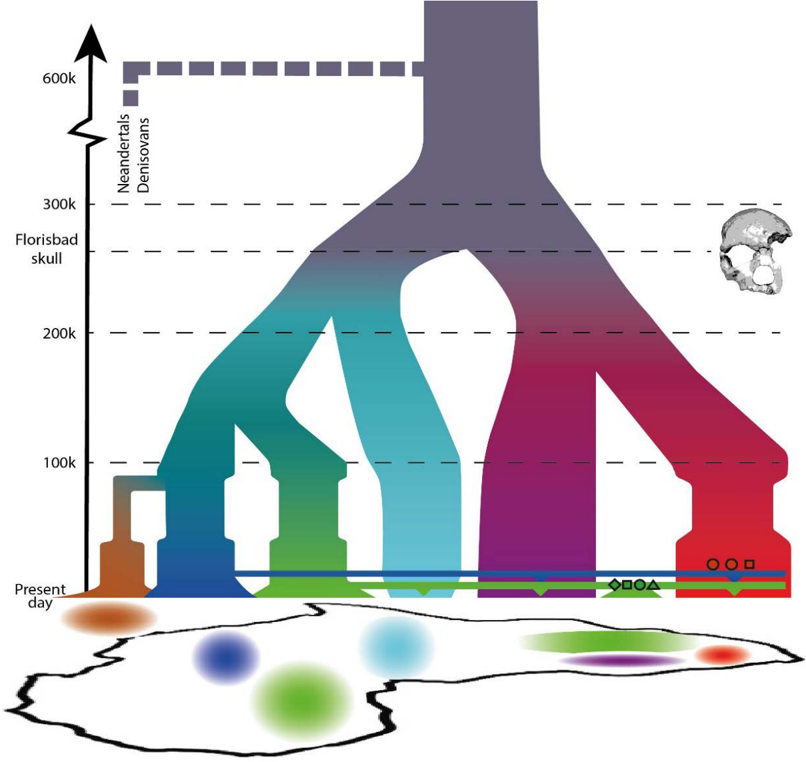
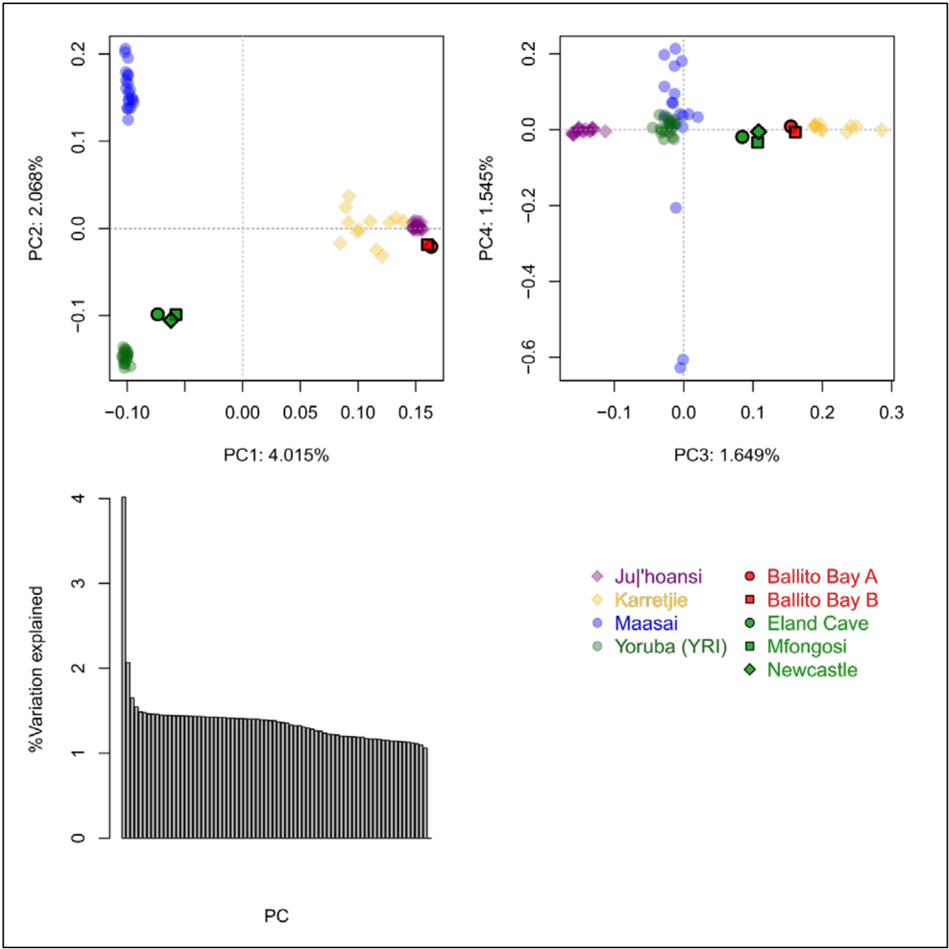
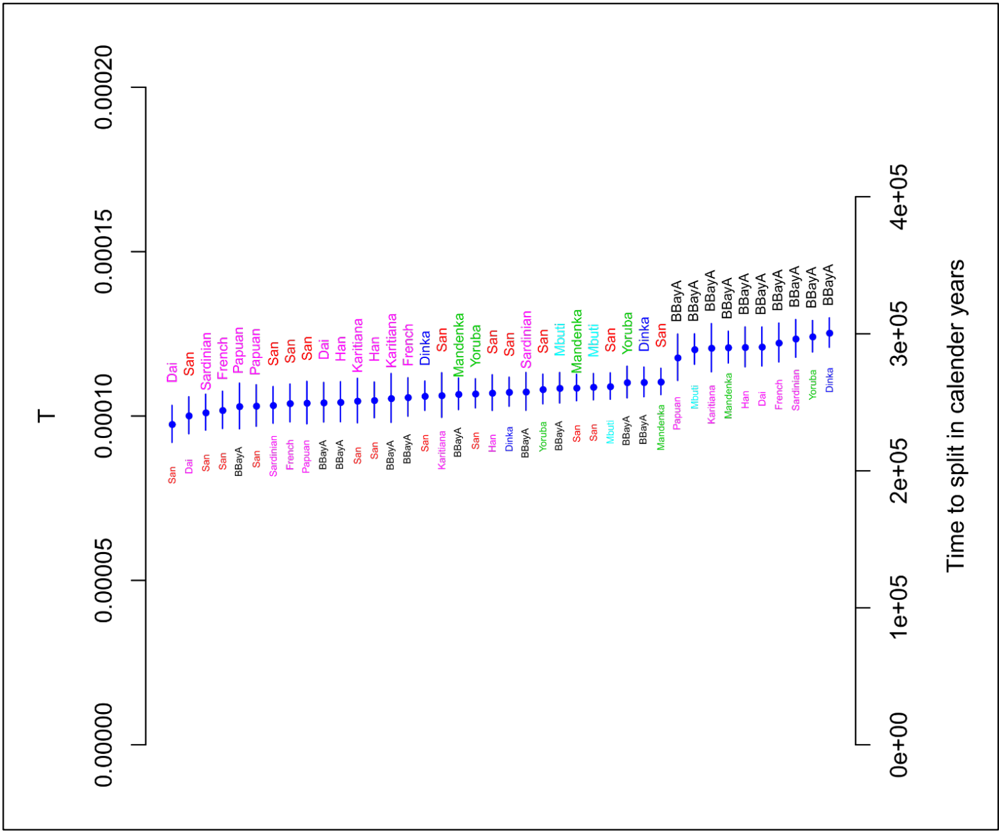
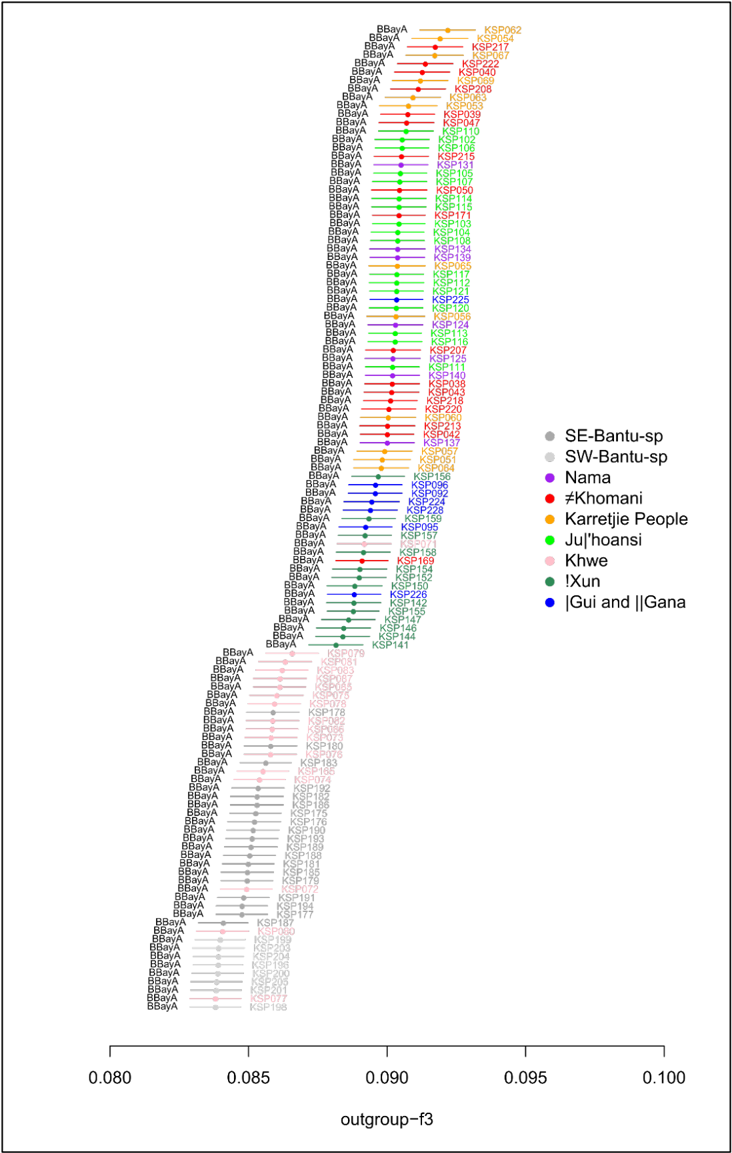
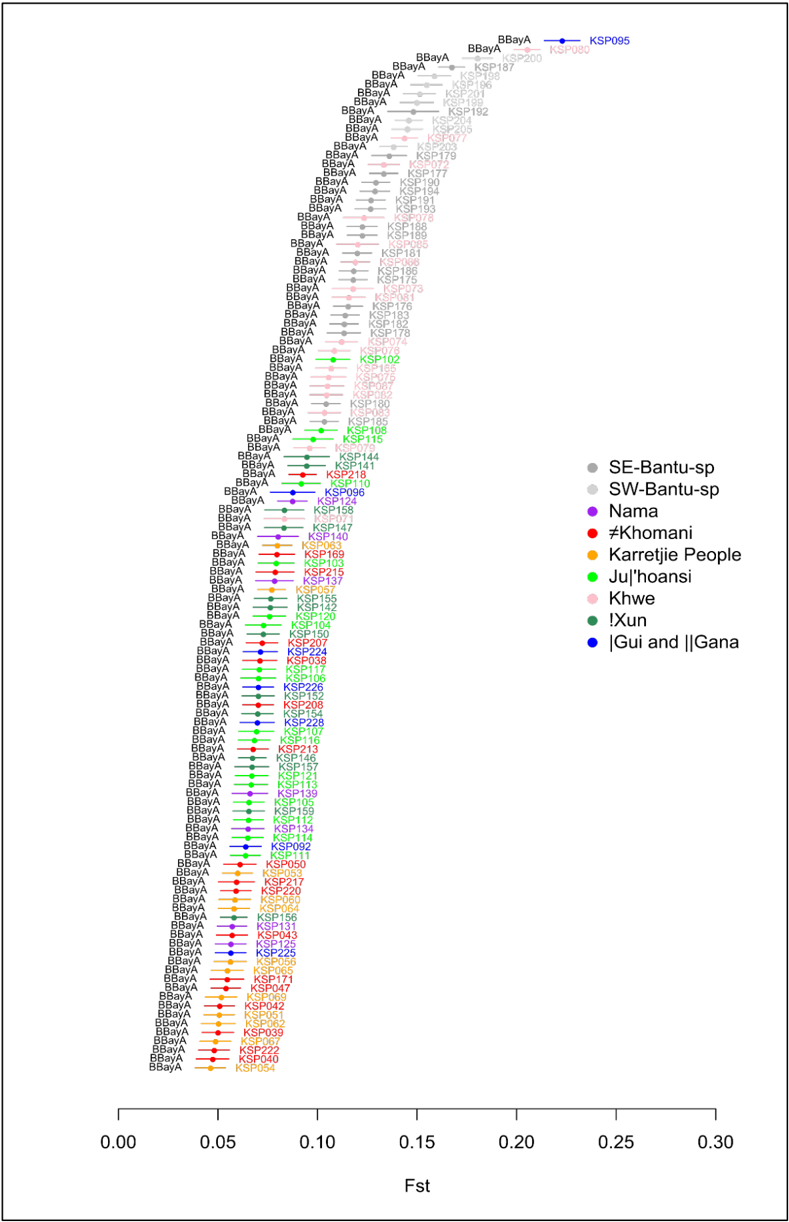
Southern Africa is consistently placed as one of the potential regions for the evolution of Homo sapiens . To examine the region’s human prehistory prior to the arrival of migrants from East and West Africa or Eurasia in the last 1,700 years, we generated and analyzed genome sequence data from seven ancient individuals from KwaZulu-Natal, South Africa. Three Stone Age hunter-gatherers date to ~2,000 years ago, and we show that they were related to current-day southern San groups such as the Karretjie People. Four Iron Age farmers (300–500 years old) have genetic signatures similar to present day Bantu-speakers. The genome sequence (13x coverage) of a juvenile boy from Ballito Bay, who lived ~2,000 years ago, demonstrates that southern African Stone Age hunter-gatherers were not impacted by recent admixture; however, we estimate that all modern-day Khoekhoe and San groups have been influenced by 9–22% genetic admixture from East African/Eurasian pastoralist groups arriving >1,000 years ago, including the Ju|‘hoansi San, previously thought to have very low levels of admixture. Using traditional and new approaches, we estimate the population divergence time between the Ballito Bay boy and other groups to beyond 260,000 years ago. These estimates dramatically increases the deepest divergence amongst modern humans, coincide with the onset of the Middle Stone Age in sub-Saharan Africa, and coincide with anatomical developments of archaic humans into modern humans as represented in the local fossil record. Cumulatively, cross-disciplinary records increasingly point to southern Africa as a potential (not necessarily exclusive) ‘hot spot’ for the evolution of our species.
Overview
The claims and statistics of this paper haven’t been checked yet.
Run the check — free, no account needed. It reads the open-access text and checks the sources it cites.
Integrity signals
Registry
Cites
Statistics
Figures
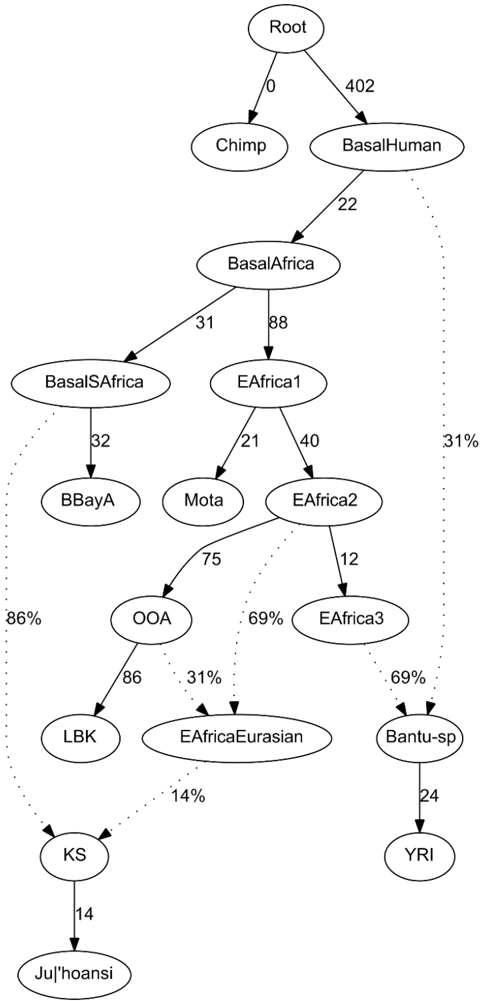
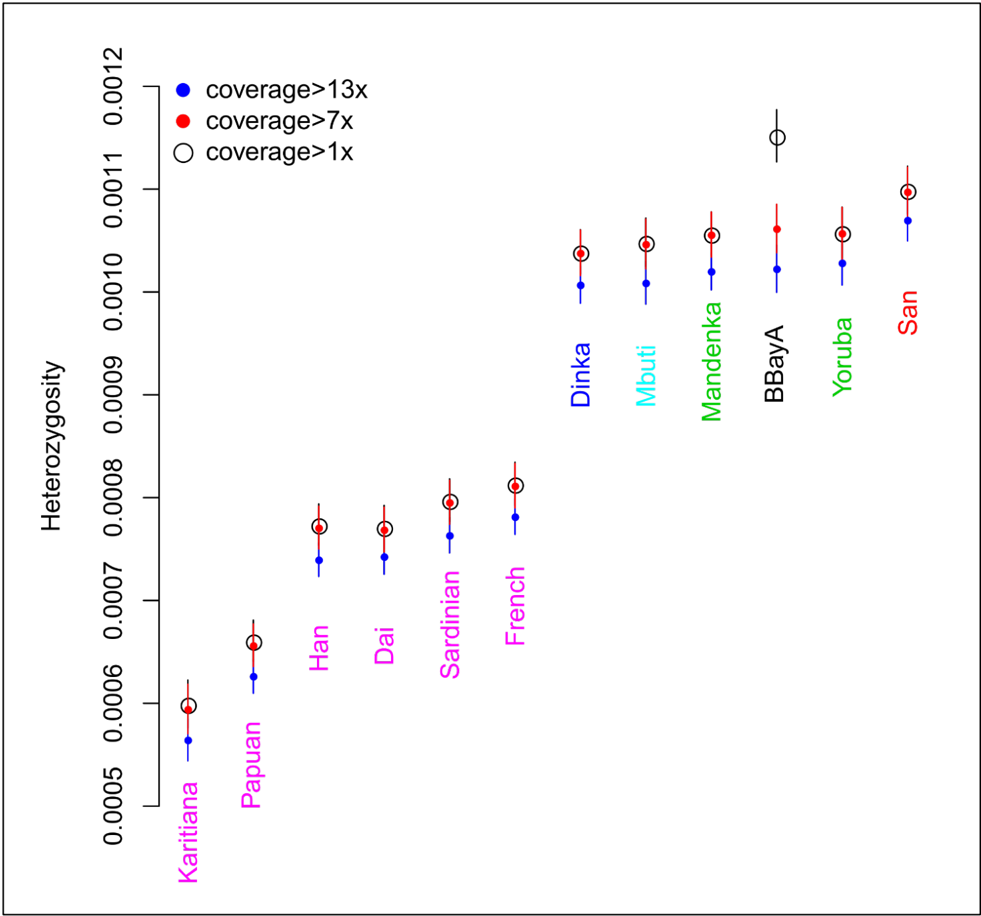
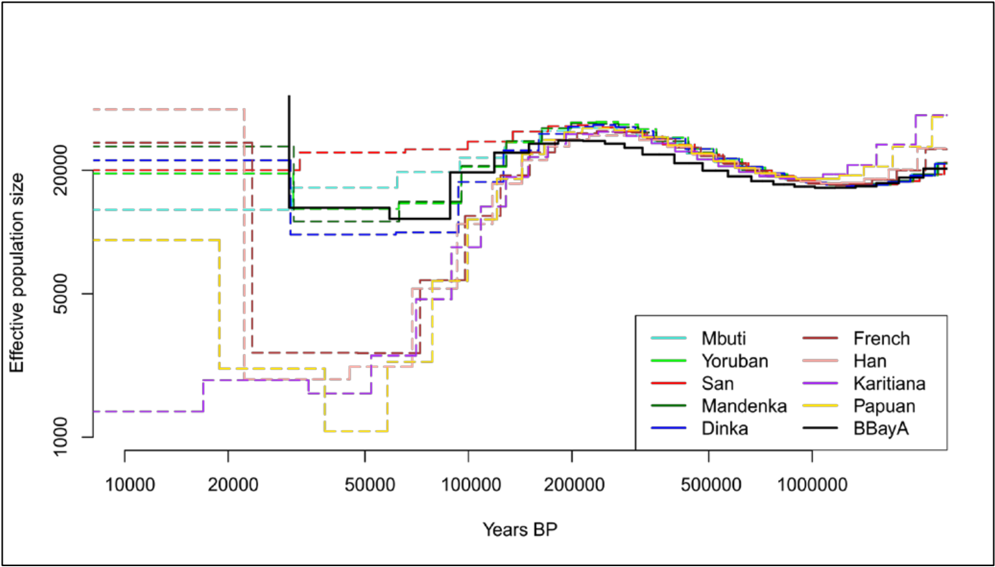
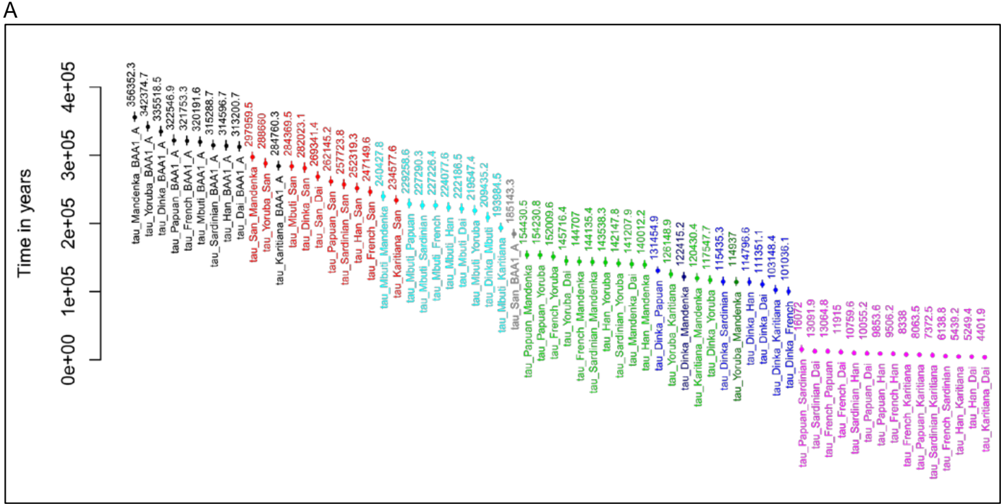
Verification
Claims the paper makes
The claims and statistics of this paper haven’t been checked yet.
Run the check — free, no account needed. It reads the open-access text and checks the sources it cites.
Claims other papers make about this one
Each is checked against this paper’s own text: does it say what the citing paper says it does?
In the citing paper
“Genomes from ancient hunter gatherers in East Asia25, Neolithic farmers in Iran16,17, and ancient African hunter gatherers26,27, allow us to infer, through ancient–modern comparisons, that the genetic contribution from Neolithic populations to present-day farming or pastoralist Africans and South and East Asians is greater than that from hunter gatherers.”
From Cultural hitchhiking and competition between patrilineal kin groups explain the post-Neolithic Y-chromosome bottleneck (2018) · cites this paper as [27]
Self-check
Percentages, sums and reported differences re-computed from the paper’s own numbers.
The self-check needs the paper’s full text.
Citations
Cites
A high-coverage genome sequence from an archaic denisovan individual
Meyer, M., Kircher, M., Gansauge, M.-T., Li, H., Racimo, F., Mallick, S., Schraiber, J. G., Jay, F., Prüfer, K., de Filippo, C., et al. (2012) · Science · doi:10.1126/science.1224344 · Cited by 1,967
The Genetic Structure and History of Africans and African Americans
Tishkoff, S. A., Reed, F. A., Friedlaender, F. R., Ehret, C., Ranciaro, A., Froment, A., Hirbo, J. B., Awomoyi, A. A., Bodo, J.-M., Doumbo, O., et al. (2009) · Science · doi:10.1126/science.1172257 · Cited by 1,573
Modern human origins: progress and prospects
Stringer, C. (2002) · Philosophical Transactions of the Royal Society of London. Series B: Biological Sciences · doi:10.1098/rstb.2001.1057 · Cited by 534
Temporal patterns of nucleotide misincorporations and DNA fragmentation in ancient DNA
Sawyer, S., Krause, J., Guschanski, K., Savolainen, V., & Pääbo, S. (2012) · PLoS ONE · doi:10.1371/journal.pone.0034131 · Cited by 489
Direct dating of Florisbad hominid
Grün, R., Brink, J. S., Spooner, N. A., Taylor, L., Stringer, C. B., Franciscus, R. G., & Murray, A. S. (1996) · Nature · doi:10.1038/382500a0 · Cited by 270
Research works printed but not linked: 34
- 10.1038/325031a0 · DOI · Paper page
- 10.1038/nature01669 · DOI · Paper page
- 10.1038/nature03258 · DOI · Paper page
- 10.1038/nature21347 · DOI · Paper page
- 10.1038/nature06742 · DOI · Paper page
- 10.1590/sajs.2013/1200 · DOI
- 10.1126/science.1227721 · DOI
- 10.1038/ncomms2140 · DOI
- 10.1073/pnas.1017511108 · DOI · Paper page
- 10.1590/sajs.2013/20120042 · DOI
- 2012, Thinking through the Middle Stone Age of sub-Saharan Africa, Quaternary International, 270, 140, 10.1016/j.quaint.2012.02.033 · DOI
- 2015, Those marvellous millennia: the Middle Stone Age of Southern Africa, Azania: Archaeological Research in Africa, 50, 155, 10.1080/0067270X.2015.1039236 · DOI
- 10.1186/1471-2148-13-56 · DOI
- 10.1038/ng.937 · DOI
- 2011, An early divergence of KhoeSan ancestors from those of other modern humans is supported by an ABC-based analysis of autosomal resequencing data, Mol Biol Evol, 29, 617
- 10.1007/s00439-016-1651-0 · DOI
- 2016, Still Bay Point-Production Strategies at Hollow Rock Shelter and Umhlatuzana Rock Shelter and Knowledge-Transfer Systems in Southern Africa at about 80–70 Thousand Years Ago, PLoS One, 11, e0168012, 10.1371/journal.pone.0168012 · DOI
- 10.1073/pnas.1204213109 · DOI
- 10.1007/s00439-016-1729-8 · DOI
- 2010, Population history and economic change in the last 2000 years in KwaZulu-Natal, RSA, Southern African Humanities, 22, 89
- 10.1534/genetics.112.145037 · DOI · Paper page
- 2014, Lactase persistence alleles reveal partial East african ancestry of southern african Khoe pastoralists, Curr Biol, 24, 852, 10.1016/j.cub.2014.02.041 · DOI
- 2015, ‘What is consumed is wasted’: from foraging to herding in the southern African Later Stone Age, Azania: Archaeological Research in Africa, 50, 267, 10.1080/0067270X.2015.1079082 · DOI
- 10.1038/ng.3015 · DOI · Paper page
- 2016, On the importance of being structured: instantaneous coalescence rates and human evolution–lessons for ancestral population size inference?, Heredity (Edinb), 116, 362, 10.1038/hdy.2015.104 · DOI
- 10.1038/nature12886 · DOI · Paper page
- 10.1371/journal.pbio.2000744 · DOI
- 10.1016/j.cell.2012.07.009 · DOI
- 10.1073/pnas.1109300108 · DOI
- 10.1101/gr.196634.115 · DOI · Paper page
- 10.1016/j.jas.2009.09.038 · DOI
- 1935, A human skull from Florisbad, Orange Free State, with a note on the endocranial cast, by CU Ariens Kappers, Proc Koninklijke Akad Wetenschappen te Amsterdam, 38, 3
- 1995, Brief communication: a new Pleistocene hominid-bearing locality at Hoedjiespunt, South Africa, Am J Phys Anthropol, 98, 601, 10.1002/ajpa.1330980415 · DOI
- Berger, L. R. , Hawks, J. , Dirks, P. H. , Elliott, M. & Roberts, E. M. Homo naledi and Pleistocene hominin evolution in subequatorial Africa. Elife 6 (2017). · DOI
Cited by
Günther, T., & Nettelblad, C. (2019) · PLOS Genetics · doi:10.1371/journal.pgen.1008302 · Cited by 228
Self-citationZeng, T. C., Aw, A. J., & Feldman, M. W. (2018) · Nature Communications · doi:10.1038/s41467-018-04375-6 · Cited by 121
A catalog of single nucleotide changes distinguishing modern humans from archaic hominins
Kuhlwilm, M., & Boeckx, C. (2019) · Scientific Reports · doi:10.1038/s41598-019-44877-x · Cited by 108
Metadata
- Authors
- Schlebusch, C. M., Malmström, H., Günther, T., Sjödin, P., Coutinho, A., Edlund, H., Munters, A. R., Steyn, M., Soodyall, H., Lombard, M., & Jakobsson, M.
- Publisher
- openRxiv
- Published
- 2017-06-05
- Cited by
- 19
- References
- 5
- Type
- Preprint
About these checks
Registry, retraction, Cites and statistics results are computed, not judged, with one exception: a printed reference that no index lists is read once by a model before it counts as a citation error. Claims are extracted by a model and kept only when their quote appears verbatim in the text; each cited source is then checked, with a model’s help, for whether it says what the claim relies on. Those verdicts can be wrong — read the claim’s quote and the cited source before relying on one.
Statistics and arithmetic are recomputed, not judged.
Confidence bands are shown only for fields calibrated on our annotated test set. None is calibrated yet, so no band is shown.
What counts as a claim ›How we measure confidence ›How we check this ›
Are you an author, or do you see a problem with this page? Request a review
