

The DOI matches its Crossref record; 39 of the 39 references it cites were found in a registry or an index.
Enzymatic dissociation induces transcriptional and proteotype bias in brain cell populations
Open accessPreprint — published as 10.3390/ijms21217944 · Paper page
Abstract
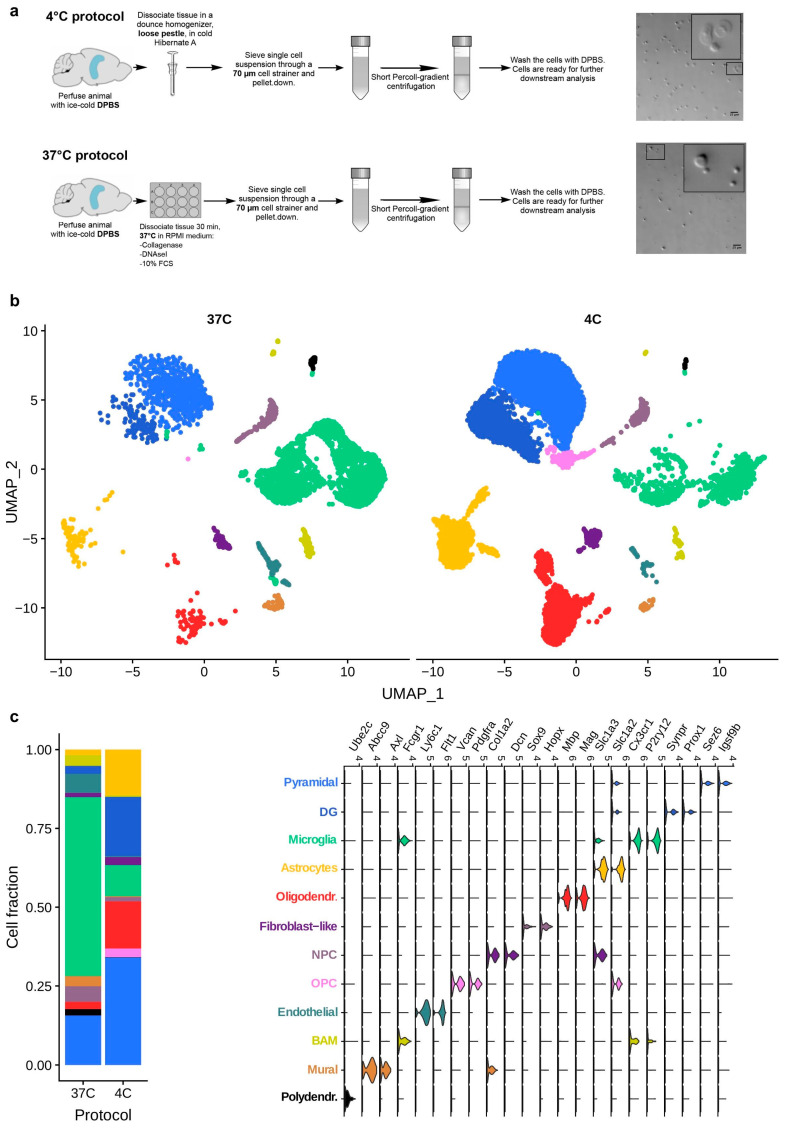
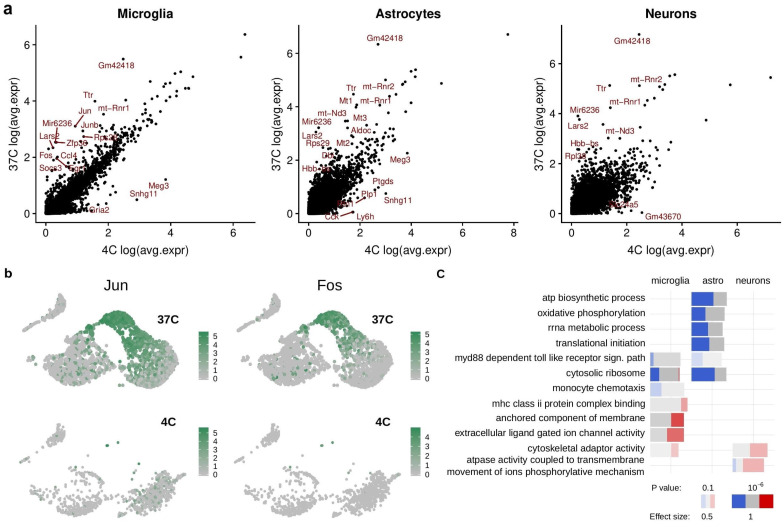
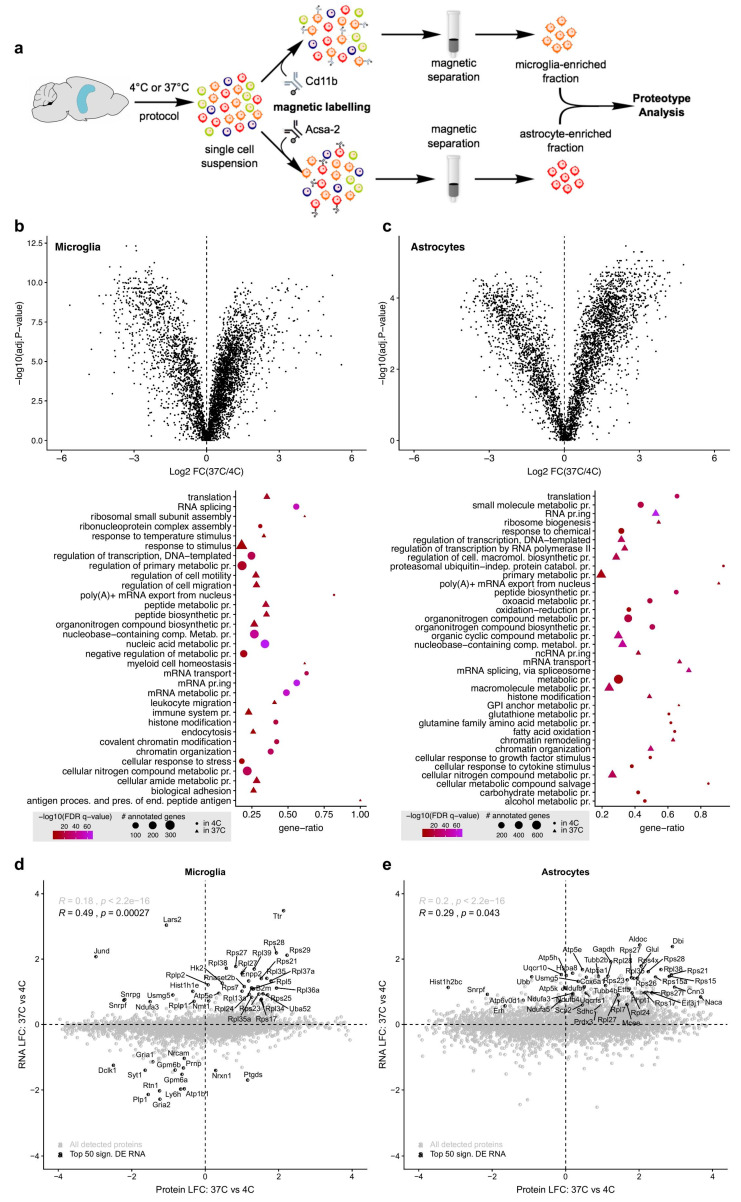
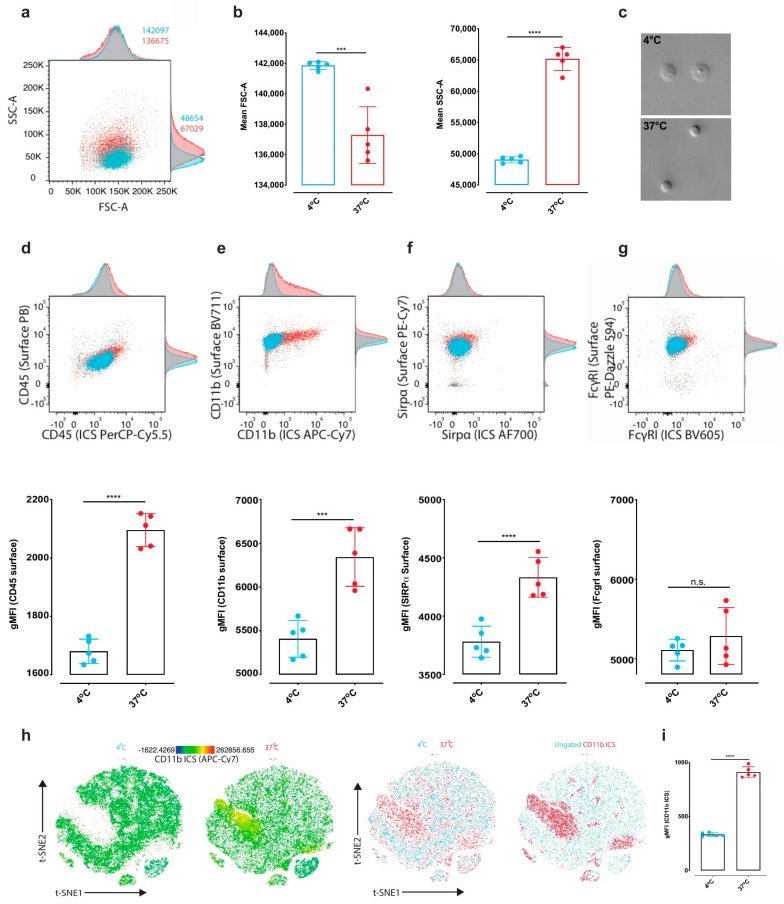
Different cell isolation techniques exist for transcriptomic and proteotype profiling of brain cells. Here, we provide a systematic investigation of the influence of different cell isolation protocols on transcriptional and proteotype profiles in mouse brain tissue by taking into account single-cell transcriptomics of brain cells, proteotypes of microglia and astrocytes, and flow cytometric analysis of microglia. We show that standard enzymatic digestion of brain tissue at 37°C induces profound and consistent alterations in the transcriptome and proteotype of neuronal and glial cells, as compared to an optimized mechanical dissociation protocol at 4°C. These findings emphasize the risk of introducing technical biases and biological artefacts when implementing enzymatic digestion-based isolation methods for brain cell analyses.
Overview
The claims and statistics of this paper haven’t been checked yet.
Run the check — free, no account needed. It reads the open-access text and checks the sources it cites.
Integrity signals
Registry
Cites
Statistics
Figures
Verification
Claims the paper makes
The claims and statistics of this paper haven’t been checked yet.
Run the check — free, no account needed. It reads the open-access text and checks the sources it cites.
Claims other papers make about this one
Each is checked against this paper’s own text: does it say what the citing paper says it does?
The source backs part of the claim, not all of it — or backs it for a different population, condition or comparison.
In the citing paper
“One recent study proposed a modified mechanical method to isolate all CNS cell types and appeared to succeed in significantly increasing neuronal cell yields during dissociation. However, the study lacked biological replicates needed to perform proper analysis of cell-type abundance and reproducibility34.”
From Dissection of artifactual and confounding glial signatures by single-cell sequencing of mouse and human brain (2022) · cites this paper as [34]
Experimental — accuracy not yet measuredThe source backs part of the claim, not all of it — or backs it for a different population, condition or comparison.
In the citing paper
“Our inhibitor-based protocol offers much greater experimental and tissue-/cell-type flexibility than previously developed experimental and computational solutions for this pervasive issue (see additional discussion of some alternative methods in Supplementary Note 7)33,34,45,65,67,68.”
From Dissection of artifactual and confounding glial signatures by single-cell sequencing of mouse and human brain (2022) · cites this paper as [34]
Experimental — accuracy not yet measuredThe cited source says what the claim attributes to it.
In the citing paper
“Consistent with the reports from other tissues in mice, we found that typical enzymatic digestion of mouse brain tissue induced a host of transcriptional alterations34,43,44,65.”
From Dissection of artifactual and confounding glial signatures by single-cell sequencing of mouse and human brain (2022) · cites this paper as [34]
The check wasn’t confident either way, so it gives no verdict — never disputed.
In the citing paper
“No explicit statistical methods were used to predetermine sample sizes but our sample sizes exceed those reported in previous publications32,34,43.”
From Dissection of artifactual and confounding glial signatures by single-cell sequencing of mouse and human brain (2022) · cites this paper as [34]
Experimental — accuracy not yet measured
Self-check
Percentages, sums and reported differences re-computed from the paper’s own numbers.
The self-check needs the paper’s full text.
Citations
Cites
Comprehensive Integration of Single-Cell Data
Stuart, T., Butler, A., Hoffman, P., Hafemeister, C., Papalexi, E., Mauck, W. M., Hao, Y., Stoeckius, M., Smibert, P., & Satija, R. (2019) · Cell · doi:10.1016/j.cell.2019.05.031 · Cited by 15,453
Gene Expression Omnibus: NCBI gene expression and hybridization array data repository
Edgar, R. (2002) · Nucleic Acids Research · doi:10.1093/nar/30.1.207 · Cited by 13,288
Integrating single-cell transcriptomic data across different conditions, technologies, and species
Butler, A., Hoffman, P., Smibert, P., Papalexi, E., & Satija, R. (2018) · Nature Biotechnology · doi:10.1038/nbt.4096 · Cited by 13,174
Pérez-Riverol, Y., Csordas, A., Bai, J.-W., Bernal-Llinares, M., Hewapathirana, S., Kundu, D. J., Inuganti, A., Griss, J., Mayer, G., Eisenacher, M., et al. (2018) · Nucleic Acids Res. · doi:10.1093/nar/gky1106 · Cited by 6,216
Zhang, Y., Chen, K., Sloan, S. A., Bennett, M. L., Scholze, A. R., O'Keeffe, S., Phatnani, H. P., Guarnieri, P., Caneda, C., Ruderisch, N., et al. (2014) · The Journal of Neuroscience · doi:10.1523/jneurosci.1860-14.2014 · Cited by 4,875
GOrilla: a tool for discovery and visualization of enriched GO terms in ranked gene lists
Eden, E., Navon, R., Steinfeld, I., Lipson, D., & Yakhini, Z. (2009) · BMC Bioinformatics · doi:10.1186/1471-2105-10-48 · Cited by 3,356
Single-cell transcriptomics of 20 mouse organs creates a Tabula Muris
The Tabula Muris Consortium, coordination, O., coordination, L., processing, O. C. A., sequencing, L. P. A., analysis, C. D., annotation, C. T., Writing group, Supplemental text writing group, & Principal investigators (2018) · Nature · doi:10.1038/s41586-018-0590-4 · Cited by 2,842
Molecular diversity and specializations among the cells of the adult mouse brain
Saunders, A., Macosko, E. Z., Wysoker, A., Goldman, M., Krienen, F. M., de Rivera, H., Bien, E., Baum, M., Bortolin, L., Wang, S., et al. (2018) · Cell · doi:10.1016/j.cell.2018.07.028 · Cited by 1,531
Single-cell sequencing reveals dissociation-induced gene expression in tissue subpopulations
van den Brink, S. C., Sage, F., Vértesy, Á., Spanjaard, B., Peterson-Maduro, J., Baron, C. S., Robin, C., & van Oudenaarden, A. (2017) · Nature Methods · doi:10.1038/nmeth.4437 · Cited by 1,072
Massively parallel single-nucleus RNA-seq with DroNc-seq
Habib, N., Avraham-Davidi, I., Basu, A., Burks, T., Shekhar, K., Hofree, M., Choudhury, S. R., Aguet, F., Gelfand, E., Ardlie, K., et al. (2017) · Nature Methods · doi:10.1038/nmeth.4407 · Cited by 1,069
Cited by
Sorted by citations
Microglia states and nomenclature: A field at its crossroads
Paolicelli, R. C., Sierra, A., Stevens, B., Tremblay, M.-E., Aguzzi, A., Ajami, B., Amit, I., Audinat, E., Bechmann, I., Bennett, M., et al. (2022) · Neuron · doi:10.1016/j.neuron.2022.10.020 · Cited by 1,973
Self-citationMarsh, S. E., Walker, A. J., Kamath, T., Dissing-Olesen, L., Hammond, T. R., de Soysa, T. Y., Young, A. M. H., Murphy, S., Abdulraouf, A., Nadaf, N., et al. (2022) · Nature Neuroscience · doi:10.1038/s41593-022-01022-8 · Cited by 431
Lopes, K. D. P., Snijders, G. J. L., Humphrey, J., Allan, A., Sneeboer, M. A. M., Navarro, E., Schilder, B. M., Vialle, R. A., Parks, M., Missall, R., et al. (2022) · Nature Genetics · doi:10.1038/s41588-021-00976-y · Cited by 273
Astrocyte-immune cell interactions in physiology and pathology
Han, R. T., Kim, R. D., Molofsky, A. V., & Liddelow, S. A. (2021) · Immunity · doi:10.1016/j.immuni.2021.01.013 · Cited by 223
Leveraging deep single-soma RNA sequencing to explore the neural basis of human somatosensation
Yu, H., Nagi, S. S., Usoskin, D., Hu, Y., Kupari, J., Bouchatta, O., Yan, H., Cranfill, S. L., Gautam, M., Su, Y., et al. (2024) · Nature Neuroscience · doi:10.1038/s41593-024-01794-1 · Cited by 139
Metadata
- Authors
- Mattei, D., Ivanov, A., van Oostrum, M., Pantelyushin, S., Richetto, J., Mueller, F., Beffinger, M. M., Schellhammer, L., vom Berg, J., Wollscheid, B., Beule, D., Paolicelli, R. C., & Meyer, U.
- Affiliations
- University of Zurich (CH)
- Berlin Institute of Health at Charité - Universitätsmedizin Berlin (DE)
- ETH Zurich (CH)
- Max Delbrück Center (DE)
- University of Lausanne (CH)
- Corresponding author
- Mattei, Daniele
- Ivanov, Andranik
- ORCID
- Venue
- International Journal of Molecular Sciences
- Publisher
- openRxiv
- Published
- 2020-05-16
- Volume
- 21
- Issue
- 21
- Pages
- 7944-7944
- ISSN
- 1422-0067 (ISSN-L)
- PMC
- PMC7663484
- OpenAlex
- W3097563614
- Cited by
- 143
- References
- 39
- Citations by year
- 2026: 18 · 2025: 19 · 2024: 25 · 2023: 28 · 2022: 32 · 2021: 21
- FWCI
- 6.65
- Type
- journal article
- Language
- en
- Open access
- gold
- doi.org
- Licence
- Locations
- International Journal of Molecular Sciences (publishedVersion, cc-by)
- bioRxiv (Cold Spring Harbor Laboratory) (acceptedVersion, cc-by-nc-nd)
- PubMed Central (publishedVersion, cc-by)
- PubMed (publishedVersion)
- SERVAL (Université de Lausanne) (publishedVersion, cc-by)
- MDC Repository (Max-Delbrueck-Center for Molecular Medicine) (acceptedVersion)
- IRIS (submittedVersion, cc-by)
- Zurich Open Repository and Archive (University of Zurich) (submittedVersion, cc-by)
- DOAJ (DOAJ: Directory of Open Access Journals) (submittedVersion, cc-by-sa)
- Repository for Publications and Research Data (ETH Zurich) (submittedVersion, cc-by)
- ETH Zürich Research Collection (cc-by)
- Zurich Open Repository and Archive (University of Zurich)
- Funders
- National Science Foundation
- Novartis Foundation
- Schweizerischer Nationalfonds zur Förderung der Wissenschaftlichen Forschung (160259, 188524, 180099, 310030)
- Eidgenössische Technische Hochschule Zürich (grant ETH-25 15-2)
- Novartis Stiftung für Medizinisch-Biologische Forschung (#16C231)
- Universität Zürich
- Swiss Cancer Research Foundation (KFS-3852-02-2016, KFS‐4146‐02‐2017)
- European Research Council (804949)
- Functional Genomics Center Zurich
- H2020 European Research Council (804949)
- Topics
- Life Sciences › Biochemistry, Genetics and Molecular Biology › Molecular Biology › Single-cell and spatial transcriptomics
- Life Sciences › Neuroscience › Neurology › Neuroinflammation and Neurodegeneration Mechanisms
- Life Sciences › Biochemistry, Genetics and Molecular Biology › Molecular Biology › Molecular Biology Techniques and Applications
- Keywords
- enzymatic tissue dissociation, technical bias, microglia, astrocytes, neurons, mechanical dissociation, single-cell transcriptomics, flow cytometry, mouse brain
- MeSH terms
- Animals, Astrocytes, Brain Neoplasms, Cell Separation, Chromatography, Liquid, Enzymes, Flow Cytometry, Glioma, Humans, Male, Neoplasm Transplantation, Sequence Analysis, RNA, Microglia, Gene Expression Profiling, Proteomics, Cell Line, Tumor, Mice, Tandem Mass Spectrometry, Single-Cell Analysis
About these checks
Registry, retraction, Cites and statistics results are computed, not judged, with one exception: a printed reference that no index lists is read once by a model before it counts as a citation error. Claims are extracted by a model and kept only when their quote appears verbatim in the text; each cited source is then checked, with a model’s help, for whether it says what the claim relies on. Those verdicts can be wrong — read the claim’s quote and the cited source before relying on one.
Statistics and arithmetic are recomputed, not judged.
Confidence bands are shown only for fields calibrated on our annotated test set. None is calibrated yet, so no band is shown.
What counts as a claim ›How we measure confidence ›How we check this ›
Are you an author, or do you see a problem with this page? Request a review
