PreprintCited by 399RNA and protein synthesis mechanismsRNA Interference and Gene DeliveryRNA Research and Splicing

The DOI matches its Crossref record; 110 of the 117 references it cites were found in a registry or an index.

Combinatorial optimization of mRNA structure, stability, and translation for RNA-based therapeutics

Open access

Preprint — published as 10.1038/s41467-022-28776-w · Paper page

Abstract

SUMMARY: Therapeutic mRNAs and vaccines are being developed for a broad range of human diseases, including COVID-19. However, their optimization is hindered by mRNA instability and inefficient protein expression. Here, we describe design principles that overcome these barriers. We develop a new RNA sequencing-based platform called PERSIST-seq to systematically delineate in-cell mRNA stability, ribosome load, as well as in-solution stability of a library of diverse mRNAs. We find that, surprisingly, in-cell stability is a greater driver of protein output than high ribosome load. We further introduce a method called In-line-seq, applied to thousands of diverse RNAs, that reveals sequence and structure-based rules for mitigating hydrolytic degradation. Our findings show that “superfolder” mRNAs can be designed to improve both stability and expression that are further enhanced through pseudouridine nucleoside modification. Together, our study demonstrates simultaneous improvement of mRNA stability and protein expression and provides a computational-experimental platform for the enhancement of mRNA medicines.

Overview

The claims and statistics of this paper haven’t been checked yet.

Run the check — free, no account needed. It reads the open-access text and checks the sources it cites.

A few free checks a day · papers already verified open instantly · results are public

Integrity signals

Registry

Crossref · 10.1101/2021.03.29.437587

Cites

110 of 110 references verified0 citation errors · 0 not checkable

Statistics

Figures

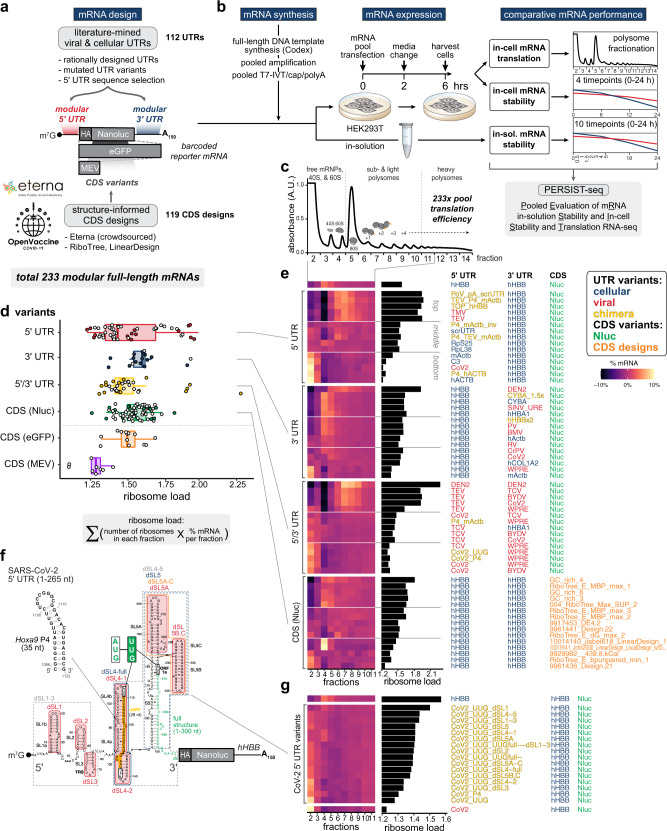
Fig. 1 PERSIST-seq overview and illustrative ribosome load insights. a Overview of the mRNA optimization workflow. Literature mined and rationally designed 5′ and 3′ UTRs were combined with Eterna and algorithmically designed coding sequences. All sequences were then experimentally tested in parallel for in-solution and in-cell stability as well as ribosome load. The mRNA design included unique, 6–9 nt barcodes in the 3′ UTR for tag counting by short-read sequencing. b Experimental design for testing in-solution and in-cell stability and ribosome load in parallel. mRNAs were in vitro transcribed, 5′ capped, and polyadenylated in a pooled format before transfection into HEK293T cells or being subjected to in-solution degradation. Transfected cells were then harvested for sucrose gradient fractionation or in-cell degradation analysis. c Polysome trace from transfected HEK293T cells with 233-mRNA pool. d 5′ UTR variants display a higher variance in mean ribosome load per construct as determined from polysome sequencing. The formula for ribosome load is given. Box hinges: 25% quantile, median, 75% quantile, respectively, from left to right. Whiskers: lower or upper hinge ±1.5 x interquartile range. e Heatmaps from polysome profiles of mRNA designs selected from the top, middle, and bottom five mRNAs (by ribosome load) from each design category. f Secondary structure model of the SARS-CoV-2 5′ UTR. Introduced mutations and substitutions are highlighted. g Heatmaps of SARS-CoV-2 5′ UTR variants’ polysome profiles sorted by ribosome load.
Fig. 1 PERSIST-seq overview and illustrative ribosome load insights. a Overview of the mRNA optimization workflow. Literature mined and rationally designed 5′ and 3′ UTRs were combined with Eterna and algorithmically designed coding sequences. All sequences were then experimentally tested in parallel for in-solution and in-cell stability as well as ribosome load. The mRNA design included unique, 6–9 nt barcodes in the 3′ UTR for tag counting by short-read sequencing. b Experimental design for testing in-solution and in-cell stability and ribosome load in parallel. mRNAs were in vitro transcribed, 5′ capped, and polyadenylated in a pooled format before transfection into HEK293T cells or being subjected to in-solution degradation. Transfected cells were then harvested for sucrose gradient fractionation or in-cell degradation analysis. c Polysome trace from transfected HEK293T cells with 233-mRNA pool. d 5′ UTR variants display a higher variance in mean ribosome load per construct as determined from polysome sequencing. The formula for ribosome load is given. Box hinges: 25% quantile, median, 75% quantile, respectively, from left to right. Whiskers: lower or upper hinge ±1.5 x interquartile range. e Heatmaps from polysome profiles of mRNA designs selected from the top, middle, and bottom five mRNAs (by ribosome load) from each design category. f Secondary structure model of the SARS-CoV-2 5′ UTR. Introduced mutations and substitutions are highlighted. g Heatmaps of SARS-CoV-2 5′ UTR variants’ polysome profiles sorted by ribosome load.CC BY · PubMed Central
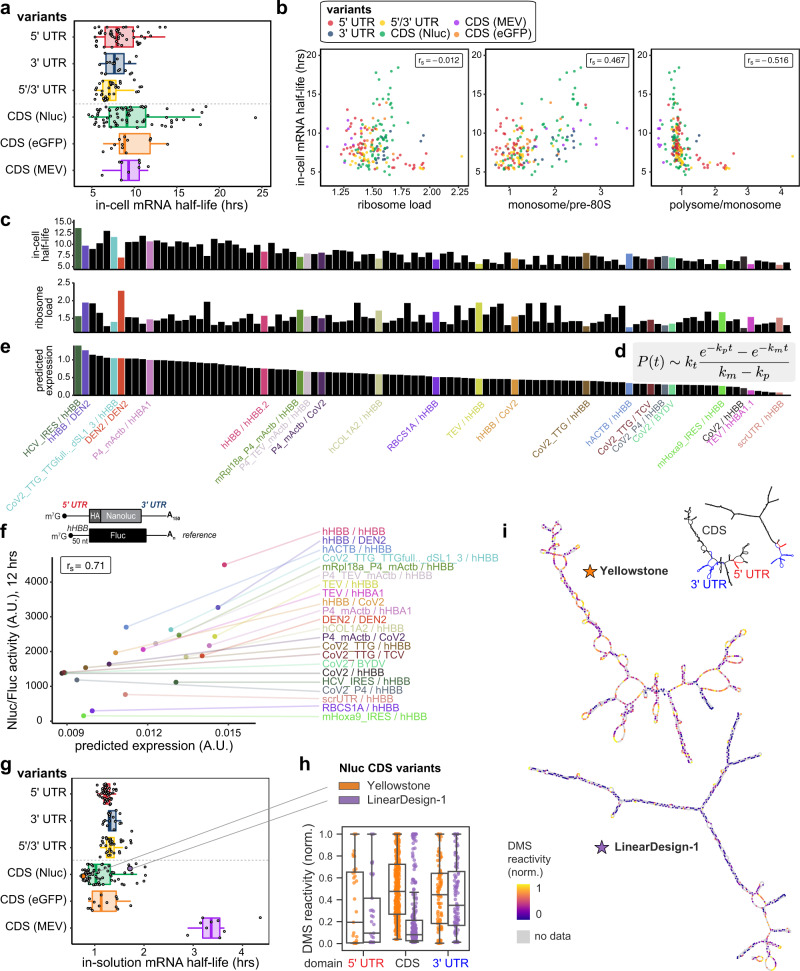
Fig. 2 In-cell RNA stability drives downstream protein expression levels. a In-cell half-life of each mRNA design in HEK293T cells. Box hinges: 25% quantile, median, 75% quantile, respectively, from left to right. Whiskers: lower or upper hinge ±1.5 x interquartile range. b Higher polysome load correlates with decreased in-cell half-life. Correlation between in-cell half-life and mean ribosome load across the entire profile (left), monosome-to-free subunit ratio (center), or polysome-to-monosome ratio (right). c In-cell half-life and mean ribosome load for individual mRNA designs with varying UTRs. d Kinetic model for predicting protein expression from mRNA half-life and ribosome load. P(t) is protein quantity at time t; kt is translation rate; and km and kp are rates of mRNA and protein decay, respectively. e Protein expression predicted using the kinetic model in (d) on the basis of mRNA half-life and ribosome load. Predicted protein expression of each UTR variant; note closer similarity to in-cell half-life data than to ribosome load in (c). f Correlation of predicted protein expression and Nluc/Fluc activity at 12 h in HEK293T cells. Predicted protein expression is normalized by mRNA length (corresponding to transfecting equal masses of each mRNA). g In-solution half-life of various mRNA design variants. mRNA lifetimes are strongly dependent on mRNA length and designed structures, revealed by time courses of mRNA degradation under accelerated aging conditions (10 mM MgCl2, 50 mM Na-CHES, pH 10.0). Box hinges: 25% quantile, median, 75% quantile, respectively, from left to right. Whiskers: lower or upper hinge ±1.5 x interquartile range. h Nucleotide-resolution in vitro DMS mapping confirms large differences in structural accessibility between a highly structured JEV-HA-Nluc mRNA construct, “LinearDesign-1” and a highly unstructured construct “Yellowstone”. The 5′ and 3′ UTRs (hHBB) were kept constant between designs. Each point represents normalized DMS reactivity from one nucleotide position of the RNA. Box plot represents median and 25th and 75th percentiles—interquartile range; IQR—and whiskers extend to maximum and minimum values. i Nucleotide DMS accessibility mapped onto structures from DMS-directed structure prediction.
Fig. 2 In-cell RNA stability drives downstream protein expression levels. a In-cell half-life of each mRNA design in HEK293T cells. Box hinges: 25% quantile, median, 75% quantile, respectively, from left to right. Whiskers: lower or upper hinge ±1.5 x interquartile range. b Higher polysome load correlates with decreased in-cell half-life. Correlation between in-cell half-life and mean ribosome load across the entire profile (left), monosome-to-free subunit ratio (center), or polysome-to-monosome ratio (right). c In-cell half-life and mean ribosome load for individual mRNA designs with varying UTRs. d Kinetic model for predicting protein expression from mRNA half-life and ribosome load. P(t) is protein quantity at time t; kt is translation rate; and km and kp are rates of mRNA and protein decay, respectively. e Protein expression predicted using the kinetic model in (d) on the basis of mRNA half-life and ribosome load. Predicted protein expression of each UTR variant; note closer similarity to in-cell half-life data than to ribosome load in (c). f Correlation of predicted protein expression and Nluc/Fluc activity at 12 h in HEK293T cells. Predicted protein expression is normalized by mRNA length (corresponding to transfecting equal masses of each mRNA). g In-solution half-life of various mRNA design variants. mRNA lifetimes are strongly dependent on mRNA length and designed structures, revealed by time courses of mRNA degradation under accelerated aging conditions (10 mM MgCl2, 50 mM Na-CHES, pH 10.0). Box hinges: 25% quantile, median, 75% quantile, respectively, from left to right. Whiskers: lower or upper hinge ±1.5 x interquartile range. h Nucleotide-resolution in vitro DMS mapping confirms large differences in structural accessibility between a highly structured JEV-HA-Nluc mRNA construct, “LinearDesign-1” and a highly unstructured construct “Yellowstone”. The 5′ and 3′ UTRs (hHBB) were kept constant between designs. Each point represents normalized DMS reactivity from one nucleotide position of the RNA. Box plot represents median and 25th and 75th percentiles—interquartile range; IQR—and whiskers extend to maximum and minimum values. i Nucleotide DMS accessibility mapped onto structures from DMS-directed structure prediction.CC BY · PubMed Central
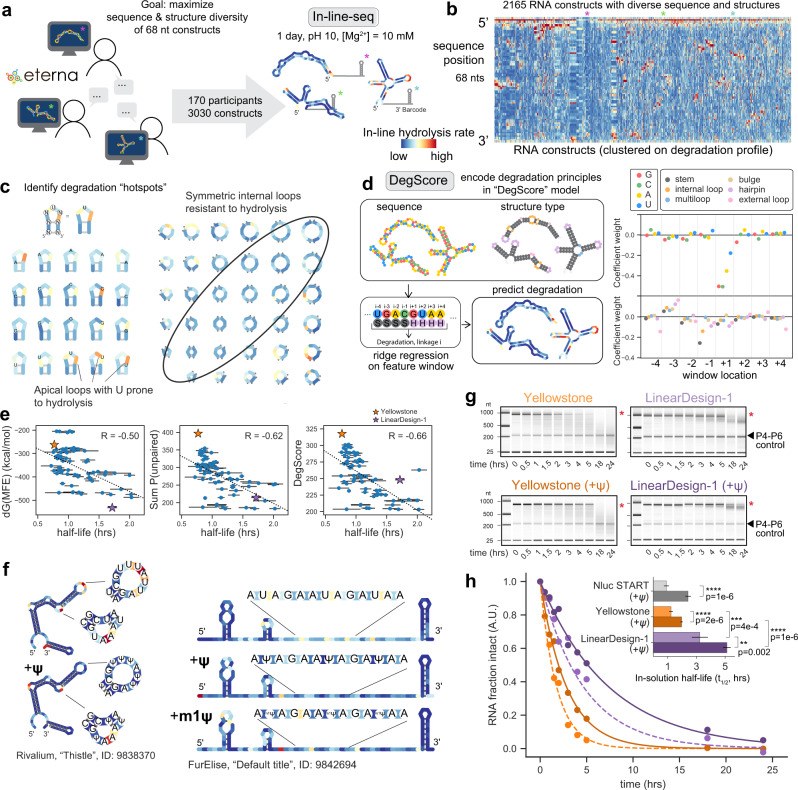
Fig. 3 High-throughput in-line hydrolysis uncovers principles of in-solution RNA degradation. a Eterna participants were asked to design 68-nucleotide RNA fragments maximizing sequence and structure diversity. In total, 3030 constructs were characterized and probed using high-throughput in-line degradation (In-line-seq). b Nucleotide-resolution degradation of 2165 68-nt RNA sequences (filtered for signal quality), probed by In-line-seq, sorted by hierarchical clustering on degradation profiles. c Sequences span a diverse set of secondary structure motifs, revealing patterns in degradation based on both sequence (i.e., linkages ending at 3′ uridine are particularly reactive) and structure (symmetric internal loops, circled, have suppressed hydrolytic degradation compared to asymmetric internal loops). d The ridge regression model “DegScore” was trained to predict per-nucleotide degradation from sequence and loop assignment information. Coefficients with the largest magnitude corresponded to sequence identity immediately after the link, with U being most disfavored. e DegScore showed improved predictive power on mRNAs over two other metrics previously posited to predict RNA stability. Half-life: in-solution mRNA half-life, calculated from degradation coefficients of the exponential decay fit on time course data in PERSIST-seq. Errors are standard deviations estimated by exponential fits to bootstrapped data. dG(MFE): Free energy of minimum free energy structure, calculated in RNAfold v2.4.14. Sum p(unpaired): Sum of unpaired probability, calculated in RNAfold v2.4.14. f Introduction of pseudouridine (ψ) and N1-methylpseudouridine (m1ψ) modifications stabilizes selected short RNAs at U nucleotides in both loop motifs and in fully unstructured RNAs. g Capillary electrophoresis characterization of fragmentation time courses of Nluc mRNA molecules designed with extensive structure (LinearDesign-1) and relatively less structure (Yellowstone), synthesized with standard nucleotides and with ψ modifications. The full-length mRNA band is indicated with a red asterisk. The Tetrahymena ribozyme P4-P6 domain RNA was included after degradation as a control. This result has been repeated independently two times with similar results (cf. Supplementary Fig. 10). h Exponential fits of capillary electrophoresis measurements of intact RNA over ten time points confirm significant differences between in-solution lifetimes of LinearDesign-1 and Yellowstone Nluc mRNAs. Inset: Calculated half-lives. mRNA half-life data are presented as mean values ± SD, as estimated from one biological replicate via bootstrapped exponential. Asterisks correspond to two-sided significance tests with ****p < 0.0001, ***p < 0.001, **p < 0.01.
Fig. 3 High-throughput in-line hydrolysis uncovers principles of in-solution RNA degradation. a Eterna participants were asked to design 68-nucleotide RNA fragments maximizing sequence and structure diversity. In total, 3030 constructs were characterized and probed using high-throughput in-line degradation (In-line-seq). b Nucleotide-resolution degradation of 2165 68-nt RNA sequences (filtered for signal quality), probed by In-line-seq, sorted by hierarchical clustering on degradation profiles. c Sequences span a diverse set of secondary structure motifs, revealing patterns in degradation based on both sequence (i.e., linkages ending at 3′ uridine are particularly reactive) and structure (symmetric internal loops, circled, have suppressed hydrolytic degradation compared to asymmetric internal loops). d The ridge regression model “DegScore” was trained to predict per-nucleotide degradation from sequence and loop assignment information. Coefficients with the largest magnitude corresponded to sequence identity immediately after the link, with U being most disfavored. e DegScore showed improved predictive power on mRNAs over two other metrics previously posited to predict RNA stability. Half-life: in-solution mRNA half-life, calculated from degradation coefficients of the exponential decay fit on time course data in PERSIST-seq. Errors are standard deviations estimated by exponential fits to bootstrapped data. dG(MFE): Free energy of minimum free energy structure, calculated in RNAfold v2.4.14. Sum p(unpaired): Sum of unpaired probability, calculated in RNAfold v2.4.14. f Introduction of pseudouridine (ψ) and N1-methylpseudouridine (m1ψ) modifications stabilizes selected short RNAs at U nucleotides in both loop motifs and in fully unstructured RNAs. g Capillary electrophoresis characterization of fragmentation time courses of Nluc mRNA molecules designed with extensive structure (LinearDesign-1) and relatively less structure (Yellowstone), synthesized with standard nucleotides and with ψ modifications. The full-length mRNA band is indicated with a red asterisk. The Tetrahymena ribozyme P4-P6 domain RNA was included after degradation as a control. This result has been repeated independently two times with similar results (cf. Supplementary Fig. 10). h Exponential fits of capillary electrophoresis measurements of intact RNA over ten time points confirm significant differences between in-solution lifetimes of LinearDesign-1 and Yellowstone Nluc mRNAs. Inset: Calculated half-lives. mRNA half-life data are presented as mean values ± SD, as estimated from one biological replicate via bootstrapped exponential. Asterisks correspond to two-sided significance tests with ****p < 0.0001, ***p < 0.001, **p < 0.01.CC BY · PubMed Central
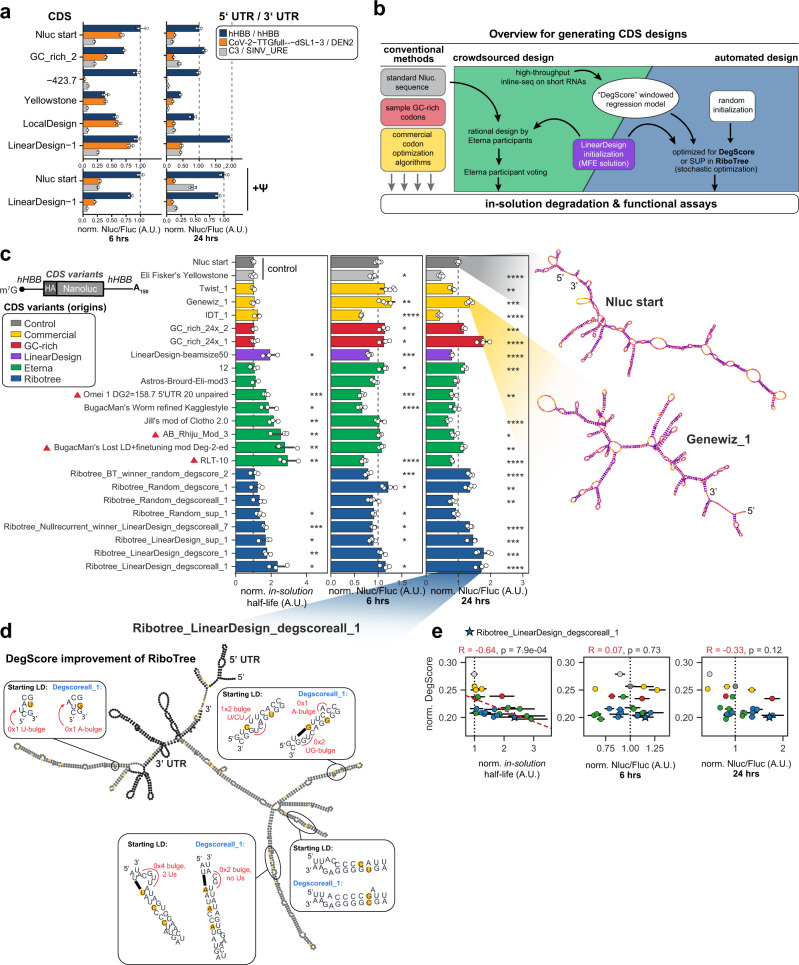
Fig. 4 Integration of 5′/3′ UTRs, structure-optimized CDSs, and pseudouridine (ψ) together enhance mRNA stability and translational output. a CDS and 5′/3′UTR combinations differentially impact protein synthesis. Six mRNA constructs were in vitro synthesized and luciferase activity was measured 6 or 24 h post-transfection. Inclusion of ψ was tested on two selected constructs. Bars indicate the geometric mean of Nluc/Fluc reporter activity ratios normalized relative to Nluc start/hHBB UTRs. Error bars indicate geometric standard deviation. n = 4 biologically independent samples. b Workflow for different approaches to design the CDS variants tested in (c). c Variations in CDS design facilitate high in-solution stability and differential protein expression. In vitro transcribed mRNAs (24 in total) were subjected to in-solution degradation or transfected into HEK293T cells for 6 and 24 h. In-solution half-lives and luciferase activity are normalized to the Nluc start reference construct. Predicted secondary structures are shown for select constructs with colors indicating DegScore at each nucleotide. Designs derived from LinearDesign solutions are marked with a purple triangle. Asterisks correspond to two-sided significance tests with ****p < 0.0001, ***p < 0.001, **p < 0.01. Exact p-values are provided in Supplementary Data 5. Bars indicate the mean of Nluc/Fluc reporter activity ratios normalized relative to Nluc start. Error bars indicate standard deviation across n ≥ 3 biologically independent samples. d Predicted secondary structure overview of Ribotree_LinearDesign_degscoreall_1. Zoomed boxes indicate sequence optimizations and subsequent structural changes made by DegScore to the reference LinearDesign construct. e Increased in-solution half-life correlates with DegScore. Significance test for Spearman correlation value: two-sided p-value for a hypothesis test whose null hypothesis is that two sets of data are uncorrelated, n = 24. Error bars indicate standard deviation across n ≥ 3 biologically independent samples.
Fig. 4 Integration of 5′/3′ UTRs, structure-optimized CDSs, and pseudouridine (ψ) together enhance mRNA stability and translational output. a CDS and 5′/3′UTR combinations differentially impact protein synthesis. Six mRNA constructs were in vitro synthesized and luciferase activity was measured 6 or 24 h post-transfection. Inclusion of ψ was tested on two selected constructs. Bars indicate the geometric mean of Nluc/Fluc reporter activity ratios normalized relative to Nluc start/hHBB UTRs. Error bars indicate geometric standard deviation. n = 4 biologically independent samples. b Workflow for different approaches to design the CDS variants tested in (c). c Variations in CDS design facilitate high in-solution stability and differential protein expression. In vitro transcribed mRNAs (24 in total) were subjected to in-solution degradation or transfected into HEK293T cells for 6 and 24 h. In-solution half-lives and luciferase activity are normalized to the Nluc start reference construct. Predicted secondary structures are shown for select constructs with colors indicating DegScore at each nucleotide. Designs derived from LinearDesign solutions are marked with a purple triangle. Asterisks correspond to two-sided significance tests with ****p < 0.0001, ***p < 0.001, **p < 0.01. Exact p-values are provided in Supplementary Data 5. Bars indicate the mean of Nluc/Fluc reporter activity ratios normalized relative to Nluc start. Error bars indicate standard deviation across n ≥ 3 biologically independent samples. d Predicted secondary structure overview of Ribotree_LinearDesign_degscoreall_1. Zoomed boxes indicate sequence optimizations and subsequent structural changes made by DegScore to the reference LinearDesign construct. e Increased in-solution half-life correlates with DegScore. Significance test for Spearman correlation value: two-sided p-value for a hypothesis test whose null hypothesis is that two sets of data are uncorrelated, n = 24. Error bars indicate standard deviation across n ≥ 3 biologically independent samples.CC BY · PubMed Central
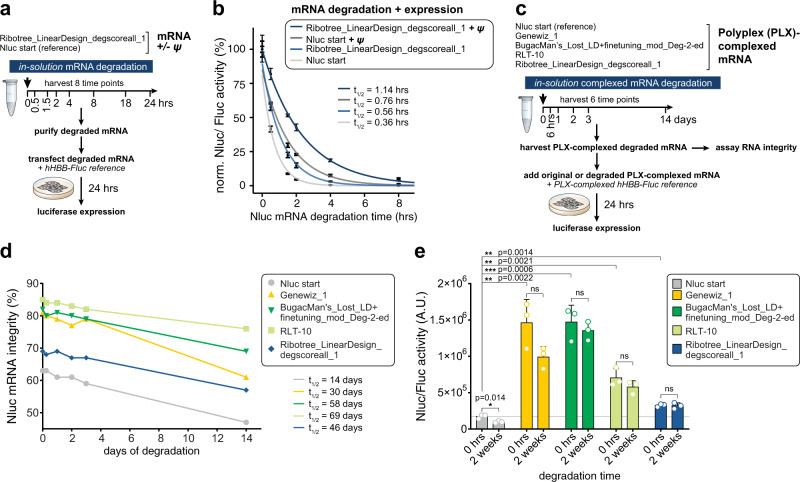
Fig. 5 Stability and cellular expression of selected highly structured RNA designs in solution and formulated with polyplex. a Schematic for testing the synergy between RNA modifications and mRNA design rules on downstream stability and protein output. mRNAs were in vitro synthesized with or without ψ and subjected to degradation conditions. Samples were collected overtime and the RNA was purified before being transfected into HEK293T cells. Luciferase activity was measured 24 h after transfection. b Luciferase activity of the reference Nluc sequence and DegScore-optimized CDS with or without ψ after being subjected to in-solution degradation. mRNA half-lives (t1/2) per construct are given in hours (hrs). Plotted on y-axis are the geometric mean of Nluc/Fluc reporter activity ratios normalized to time zero. Error bars indicate geometric standard deviation. n = 4 biologically independent samples. c Schematic for testing the effect of RNA formulation on downstream stability and protein output from selected RNA designs. mRNAs were in vitro synthesized, formulated with polyplex (PLX), and subjected to degradation conditions and/or expression analysis. Samples were collected over time and the formulated RNA was added to HEK293T cells. d In vitro stability of RNAs formulated with polyplex over 14 days at 5 °C. RNA half-lives were calculated based on the degradation slopes: Nluc start (reference) (14 days), Genewiz_1 (30 days), BugacMan’s_Lost_LD + finetuning_mod_Deg-2-ed (58 days), RLT-10 (69 days) and Ribotree_LinearDesign_degscoreall_1 (46 days). Results correspond to technical duplicates. e Expression of Nluc from HEK293T cells transfected with selected RNA designs formulated with polyplex. Expression was measured by fluorescence after the RNAs were formulated with polyplex, incubated at 5 °C in degradation conditions for 0 and 14 days, and then added to the medium of the cultured cells. Results correspond to technical replicates; normalized Nluc/Fluc activity ± SD. n = 3; ns not significant. *p ≤ 0.05 was considered significant (two-tailed unpaired Student’s t-test; ns: p > 0.05; *p ≤ 0.05; **p ≤ 0.01; ***p ≤ 0.001; ****p ≤ 0.0001).
Fig. 5 Stability and cellular expression of selected highly structured RNA designs in solution and formulated with polyplex. a Schematic for testing the synergy between RNA modifications and mRNA design rules on downstream stability and protein output. mRNAs were in vitro synthesized with or without ψ and subjected to degradation conditions. Samples were collected overtime and the RNA was purified before being transfected into HEK293T cells. Luciferase activity was measured 24 h after transfection. b Luciferase activity of the reference Nluc sequence and DegScore-optimized CDS with or without ψ after being subjected to in-solution degradation. mRNA half-lives (t1/2) per construct are given in hours (hrs). Plotted on y-axis are the geometric mean of Nluc/Fluc reporter activity ratios normalized to time zero. Error bars indicate geometric standard deviation. n = 4 biologically independent samples. c Schematic for testing the effect of RNA formulation on downstream stability and protein output from selected RNA designs. mRNAs were in vitro synthesized, formulated with polyplex (PLX), and subjected to degradation conditions and/or expression analysis. Samples were collected over time and the formulated RNA was added to HEK293T cells. d In vitro stability of RNAs formulated with polyplex over 14 days at 5 °C. RNA half-lives were calculated based on the degradation slopes: Nluc start (reference) (14 days), Genewiz_1 (30 days), BugacMan’s_Lost_LD + finetuning_mod_Deg-2-ed (58 days), RLT-10 (69 days) and Ribotree_LinearDesign_degscoreall_1 (46 days). Results correspond to technical duplicates. e Expression of Nluc from HEK293T cells transfected with selected RNA designs formulated with polyplex. Expression was measured by fluorescence after the RNAs were formulated with polyplex, incubated at 5 °C in degradation conditions for 0 and 14 days, and then added to the medium of the cultured cells. Results correspond to technical replicates; normalized Nluc/Fluc activity ± SD. n = 3; ns not significant. *p ≤ 0.05 was considered significant (two-tailed unpaired Student’s t-test; ns: p > 0.05; *p ≤ 0.05; **p ≤ 0.01; ***p ≤ 0.001; ****p ≤ 0.0001).CC BY · PubMed Central

Verification

Claims the paper makes

The claims and statistics of this paper haven’t been checked yet.

Run the check — free, no account needed. It reads the open-access text and checks the sources it cites.

A few free checks a day · papers already verified open instantly · results are public

Self-check

Percentages, sums and reported differences re-computed from the paper’s own numbers.

The self-check needs the paper’s full text.

Citations

Cites

Show all 117 references

Research works printed but not linked: 3

  1. 10.1101/2020.08.22.262931 · DOI · Paper page
  2. 10.1101/2020.03.24.006486 · DOI
  3. 10.1101/2020.06.29.178343 · DOI

Cited by

Sorted by citations

See all 399

Metadata

Authors
Leppek, K., Byeon, G. W., Kladwang, W., Wayment-Steele, H. K., Kerr, C. H., Xu, A. F., Kim, D. S., Topkar, V. V., Choe, C., Rothschild, D., Tiu, G. C., Wellington-Oguri, R., Fujii, K., Sharma, E., Watkins, A. M., Nicol, J. J., Romano, J., Tunguz, B., Participants, E., Barna, M., & Das, R.
Affiliations
  • Stanford University (US)
  • Eterna Massive Open Laboratory (US)
  • Nvidia (United States) (US)
Corresponding author
  • Barna, Maria
  • Das, Rhiju
Venue
Nature Communications
Publisher
openRxiv
Published
2021-03-30
Volume
13
Issue
1
Pages
1536-1536
ISSN
2041-1723 (ISSN-L)
OpenAlex
W4220991830
Cited by
399
References
117
Citations by year
2026: 88 · 2025: 127 · 2024: 99 · 2023: 53 · 2022: 23 · 2021: 8
FWCI
24.66
Type
journal article
Language
en
Open access
Locations
  • Nature Communications (publishedVersion, cc-by)
  • bioRxiv (Cold Spring Harbor Laboratory) (acceptedVersion, cc-by-nc)
  • PubMed Central (publishedVersion, cc-by)
  • PubMed (publishedVersion)
  • PubMed Central (submittedVersion, cc-by-nc)
  • RePEc: Research Papers in Economics (submittedVersion)
  • DOAJ (DOAJ: Directory of Open Access Journals) (submittedVersion)
Funders
  • National Science Foundation
  • Damon Runyon Cancer Research Foundation (DRG-2237-15)
  • Pfizer
  • Oregon State University
  • Baidu
  • National Institutes of Health
  • University of California, San Francisco
  • Stanford Bio-X
  • Chemistry, Engineering and Medicine for Human Health, Stanford University
  • Canadian Institutes of Health Research
  • National Cancer Institute (R21CA219847)
  • National Institute of General Medical Sciences (R35GM122579)
  • Eunice Kennedy Shriver National Institute of Child Health and Human Development (F30HD100123, R01HD086634)
Topics
  • Life Sciences › Biochemistry, Genetics and Molecular Biology › Molecular Biology › RNA and protein synthesis mechanisms
  • Life Sciences › Biochemistry, Genetics and Molecular Biology › Molecular Biology › RNA Interference and Gene Delivery
  • Life Sciences › Biochemistry, Genetics and Molecular Biology › Molecular Biology › RNA Research and Splicing
Keywords
mRNA stability, mRNA structure, mRNA vaccines, RNA therapeutics, protein expression, hydrolytic degradation, pseudouridine modification, mRNA design, COVID-19 vaccines

About these checks

Registry, retraction, Cites and statistics results are computed, not judged, with one exception: a printed reference that no index lists is read once by a model before it counts as a citation error. Claims are extracted by a model and kept only when their quote appears verbatim in the text; each cited source is then checked, with a model’s help, for whether it says what the claim relies on. Those verdicts can be wrong — read the claim’s quote and the cited source before relying on one.

Statistics and arithmetic are recomputed, not judged.

Confidence bands are shown only for fields calibrated on our annotated test set. None is calibrated yet, so no band is shown.

What counts as a claim ›How we measure confidence ›How we check this ›

Are you an author, or do you see a problem with this page? Request a review