

The DOI matches its Crossref record; 63 of the 63 references it cites were found in a registry or an index; 45 of the 63 sources its claims cite were checked for support.
Algorithm for optimized mRNA design improves stability and immunogenicity
Open accessAbstract
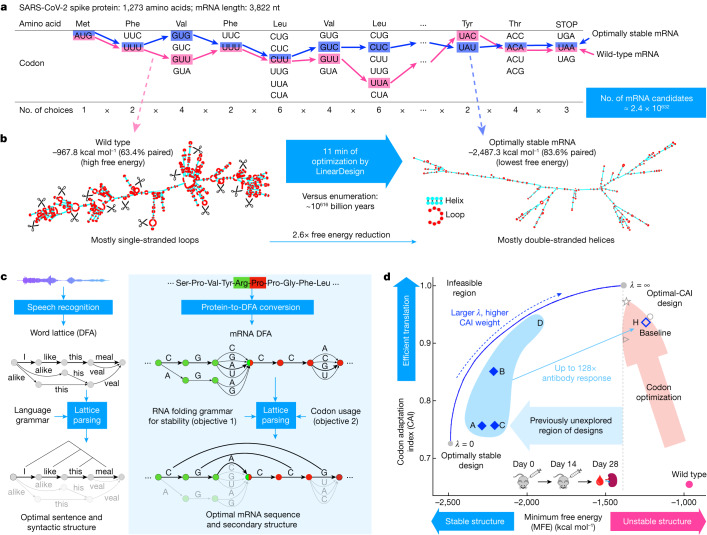
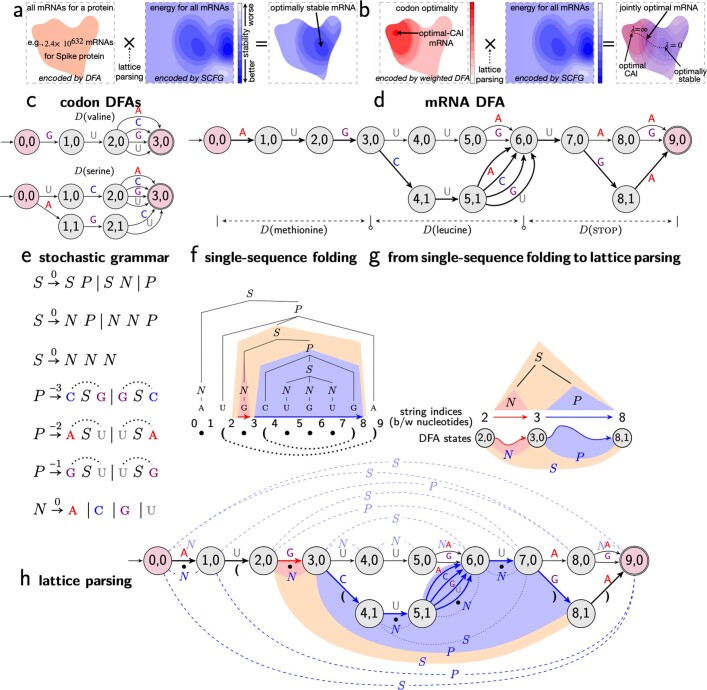
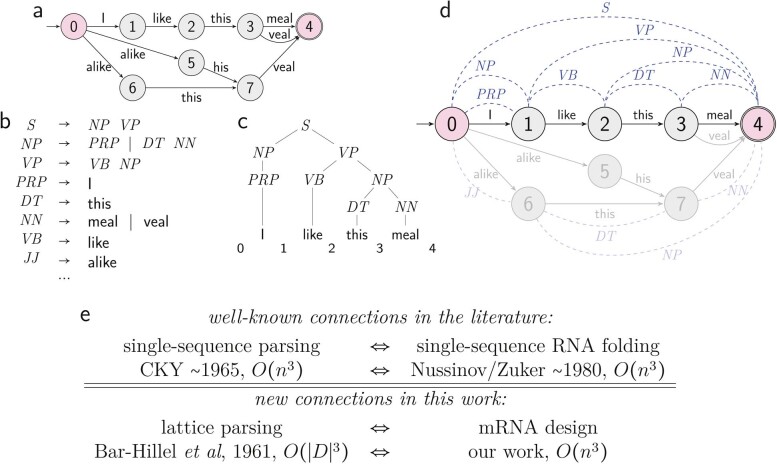
Abstract Messenger RNA (mRNA) vaccines are being used to combat the spread of COVID-19 (refs. 1–3 ), but they still exhibit critical limitations caused by mRNA instability and degradation, which are major obstacles for the storage, distribution and efficacy of the vaccine products 4 . Increasing secondary structure lengthens mRNA half-life, which, together with optimal codons, improves protein expression 5 . Therefore, a principled mRNA design algorithm must optimize both structural stability and codon usage. However, owing to synonymous codons, the mRNA design space is prohibitively large—for example, there are around 2.4 × 10 632 candidate mRNA sequences for the SARS-CoV-2 spike protein. This poses insurmountable computational challenges. Here we provide a simple and unexpected solution using the classical concept of lattice parsing in computational linguistics, where finding the optimal mRNA sequence is analogous to identifying the most likely sentence among similar-sounding alternatives 6 . Our algorithm LinearDesign finds an optimal mRNA design for the spike protein in just 11 minutes, and can concurrently optimize stability and codon usage. LinearDesign substantially improves mRNA half-life and protein expression, and profoundly increases antibody titre by up to 128 times in mice compared to the codon-optimization benchmark on mRNA vaccines for COVID-19 and varicella-zoster virus. This result reveals the great potential of principled mRNA design and enables the exploration of previously unreachable but highly stable and efficient designs. Our work is a timely tool for vaccines and other mRNA-based medicines encoding therapeutic proteins such as monoclonal antibodies and anti-cancer drugs 7,8 .
Overview
CoChat Summary
TL;DR
LinearDesign is a lattice-parsing-based algorithm for mRNA design that jointly optimizes folding stability and codon usage. In experiments on SARS-CoV-2 spike and VZV gE mRNAs, LinearDesign improved in vitro stability, protein expression, and in vivo immunogenicity versus codon-optimization benchmarks, with up to 128× higher antibody responses in mice.
Key findings
- The paper states that the SARS-CoV-2 spike protein has about 2.4 × 10^632 possible mRNA sequences, making brute-force enumeration infeasible; LinearDesign found an optimal spike mRNA in 11 min.
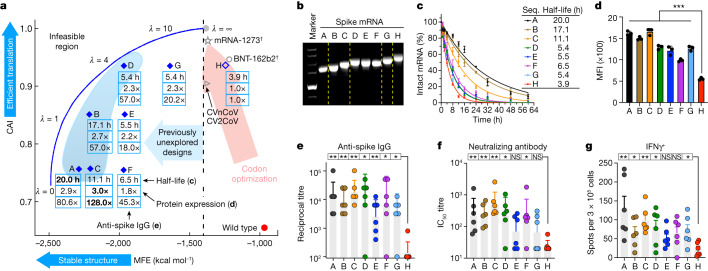
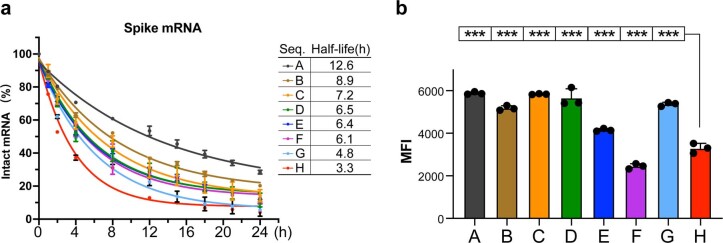
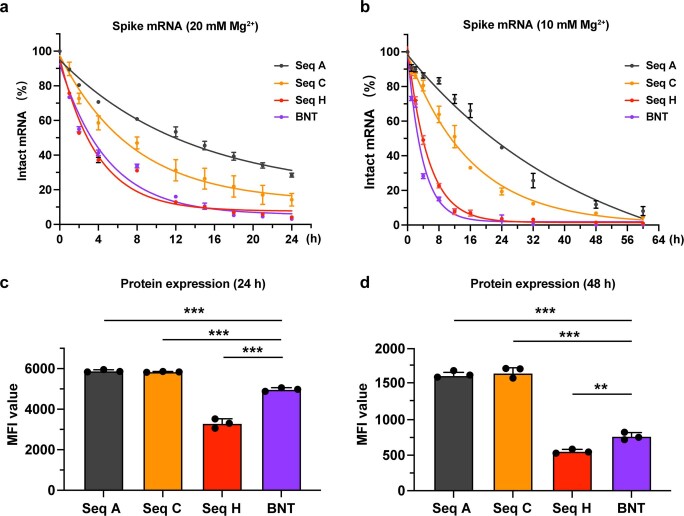
- On SARS-CoV-2 spike mRNAs, the best LinearDesign sequences showed substantially better stability than the benchmark: sequence A had a T1/2 of 20.0 h in 10 mM Mg2+ and 12.6 h in 20 mM Mg2+, versus sequence H at 3.9 h and 3.3 h.
- In HEK293 cells, all seven LinearDesign spike mRNAs (A–G) produced higher spike protein levels than benchmark H; sequence D and G were 2.3-fold higher than H, and sequence A was 2.9-fold higher.
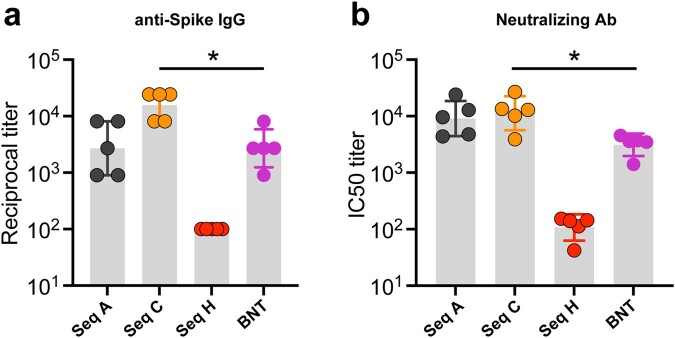
- In mice, LinearDesign spike mRNAs elicited much stronger immune responses: sequences A–D gave a 57 to 128× increase in anti-spike IgG titres and a 9 to 20× increase in neutralizing antibody titres over H.
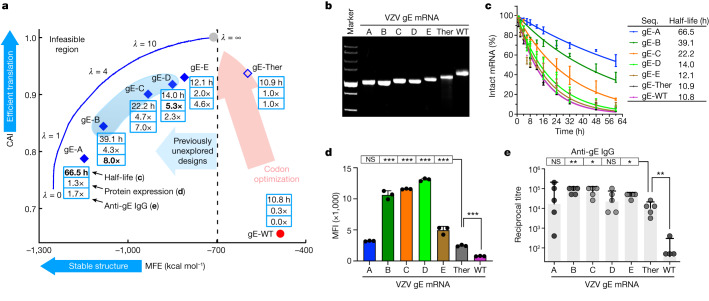
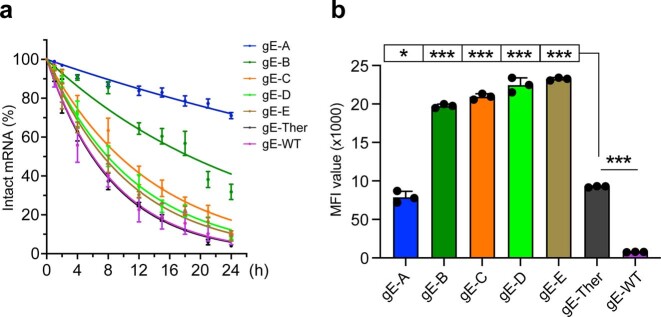
- For VZV gE, LinearDesign mRNAs also improved stability and expression; for example, gE-A had T1/2 = 66.5 h in 10 mM Mg2+ and 50.7 h in 20 mM Mg2+, compared with gE-Ther at 10.9 h and 5.9 h.
Methods
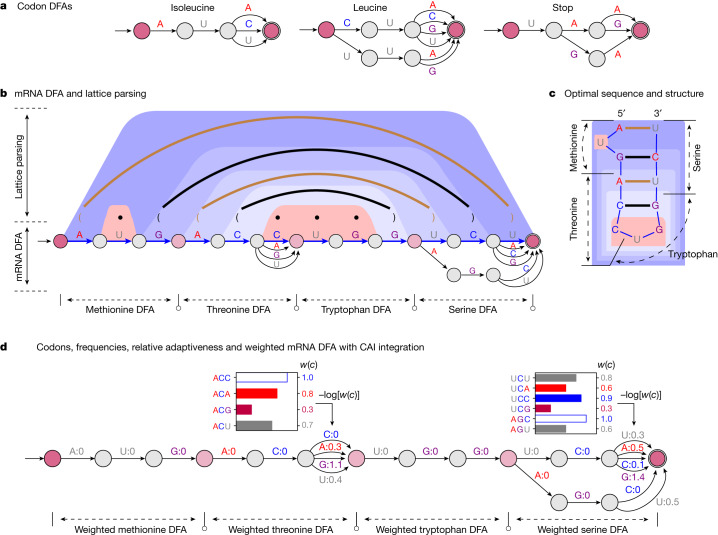
- The authors formulated mRNA design as a joint optimization problem over folding stability (MFE) and codon adaptation index (CAI), then solved it using deterministic finite automata (DFA) plus lattice parsing / weighted intersection with a stochastic context-free grammar.
- They benchmarked runtime on 114 human protein sequences from UniProt, with lengths from 78 to 3,333 amino acids, and also evaluated SARS-CoV-2 spike and VZV gE design cases.
- Experimental validation used in vitro mRNA stability assays, HEK293 protein expression assays, and in vivo immunogenicity studies in C57BL/6 mice given two intramuscular doses of 10 µg LPP-formulated mRNA at a 2-week interval.
Limitations
- The paper states that the work considered only the coding region; UTR optimization was not addressed directly.
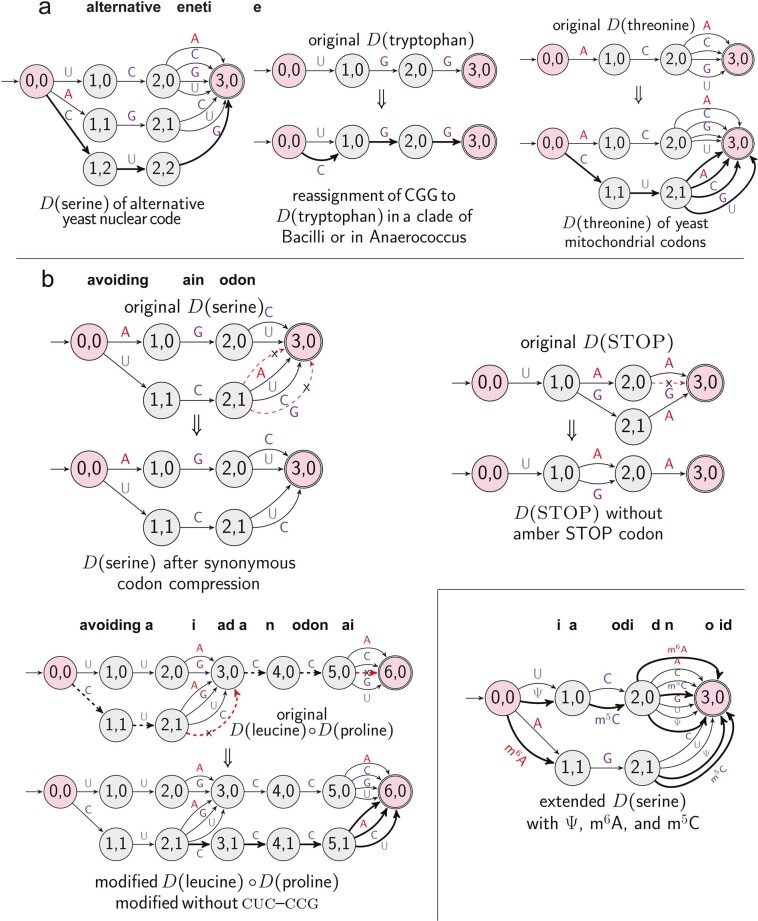
- It also states that chemical modification was not used in the designed mRNAs, even though this is widely used in mRNA vaccines.
- Evident from the text: the in vivo experiments were not randomized, the investigators were not blinded, and the animal experiments were completed once, which limits robustness of the experimental evidence.
Model-written summary. Check it against the paper before relying on it.
Integrity signals
Registry
Cites
Statistics
Figures
![Fig. 3 Computational characteristics of the LinearDesign algorithm. a, Runtime analysis of mRNA design for proteins in UniProt (Supplementary Table 1). Overall, our exact search scales quadratically with sequence length (Supplementary Figs. 7 and 8), and our MFE + CAI mode (with λ = 4) is about 15% slower than the MFE-only version. Moreover, beam search (b = 500) significantly speeds up the design of long sequences, with minor search errors (Supplementary Fig. 9). b,c, Two-dimensional (MFE–CAI) visualizations of designs for the SARS-CoV-2 spike (b) and VZV gE (c) proteins, respectively (both using human codon preference). The blue curves form the feasibility limit (optimal boundary), by varying λ from 0 to ∞ (see Extended Data Fig. 4 for λ of (–∞, 0]). The GC percentage is shown in parentheses. The human genome favours GC-rich codons; therefore, codon optimization (pink arrows) also improves stability, but only marginally, as the two optimization directions (codon versus stability) are largely orthogonal. By contrast, with an AU-rich codon preference (such as in yeast), codon optimization decreases stability (Extended Data Fig. 4b). d, Secondary structures of the mRNA designs for SARS-CoV-2 spike and VZV gE protein. The optimal-CAI designs (top, λ = ∞) are largely single-stranded (around 60% base-paired), whereas the optimally stable designs (bottom, λ = 0) are mostly double-stranded (around 80% base-paired). We also show intermediate designs (centre, λ = 4) with a balance of stability and CAI.](https://figures.cochat.ai/paper-figures/7f3b742293c6471081bcef7e5469da5b/algorithm-for-optimized-mrna-design-improves-stability-and-immunogenicity-figure-3.jpg)
Verification
Claims the paper makes
35 Valid · 2 Not valid · 9 Not checked · 111 Own results and interpretations
The cited sources support only part of this claim — read each source’s verdict below.
In the paper
“Messenger RNA (mRNA) vaccines are being used to combat the spread of COVID-19 (refs. 1–3), but they still exhibit critical limitations caused by mRNA instability and degradation”
§ Algorithm for optimized mRNA design improves stability and immunogenicity > Abstract
What the sources say
- Not matchedcites refs. 1–3
Couldn’t be matched to a paper in Crossref, so it can’t be checked.
- Supportedcites [4] Crommelin, D. J., Anchordoquy, T. J., Volkin, D. B., Jiskoot, W. & Mastrobattista, E. Addressing the cold reality of mRNA vaccine stability. J. Pharm. Sci. 110, 997–1001 (2021). source
The Historical Perspective section says that even minor mRNA degradation can severely impair translation and antigen expression. The Stability Data section describes storage stability as a critical limitation on large-scale mRNA vaccine deployment. No page numbers were supplied for these passages. (LLM, conf=0.93)
plainstates a cause- Asserted: passes — The authors put it forward as true.
- Checkable: passes — It can be checked against evidence.
- Load-bearing: passes — The paper’s conclusions depend on it.
- Based: passes — The paper gives a reason why it holds.
- Not matched
Every source the paper cites for this claim was checked and supports it.
In the paper
“which are major obstacles for the storage, distribution and efficacy of the vaccine products4”
§ Algorithm for optimized mRNA design improves stability and immunogenicity > Abstract
What the sources say
- Supportedcites [4] Crommelin, D. J., Anchordoquy, T. J., Volkin, D. B., Jiskoot, W. & Mastrobattista, E. Addressing the cold reality of mRNA vaccine stability. J. Pharm. Sci. 110, 997–1001 (2021). source
The Historical Perspective section says that even minor mRNA degradation can impair translation and antigen expression, affecting vaccine potency. The Abstract and Concluding Considerations identify formulation stability as a challenge for storage, transport and worldwide distribution. (LLM, conf=0.92)
plainstates a cause- Asserted: passes — The authors put it forward as true.
- Checkable: passes — It can be checked against evidence.
- Load-bearing: passes — The paper’s conclusions depend on it.
- Based: passes — The paper gives a reason why it holds.
- Supported
The cited sources support only part of this claim — read each source’s verdict below.
In the paper
“Increasing secondary structure lengthens mRNA half-life, which, together with optimal codons, improves protein expression5.”
§ Algorithm for optimized mRNA design improves stability and immunogenicity > Abstract
What the sources say
- Partly supportedcites [5] Mauger, D. M. et al. mRNA structure regulates protein expression through changes in functional half-life. Proc. Natl Acad. Sci. USA 116, 24075–24083 (2019). sourceExperimental — accuracy not yet measured
The Results section reports that highly structured mRNAs had more than twice the *functional* half-life of mRNAs with middling structure, independent of codon optimality, and the Abstract reports that codon optimality and greater CDS structure synergize to increase it. The Results also distinguish functional half-life—the time an mRNA productively generates protein—from physical half-life ending in degradation. The claim omits that distinction and the finding's position-dependent qualification: reduced structure in the 5′ leader correlated with higher expression. (LLM, conf=0.85)
plainstates a cause- Asserted: passes — The authors put it forward as true.
- Checkable: passes — It can be checked against evidence.
- Load-bearing: passes — The paper’s conclusions depend on it.
- Based: passes — The paper gives a reason why it holds.
- Partly supported
Every source the paper cites for this claim was checked and supports it.
In the paper
“Improving this structural stability, combined with optimal codon usage, leads to increased protein expression5.”
§ Algorithm for optimized mRNA design improves stability and immunogenicity > Main
What the sources say
- Supportedcites [5] Mauger, D. M. et al. mRNA structure regulates protein expression through changes in functional half-life. Proc. Natl Acad. Sci. USA 116, 24075–24083 (2019). source
The Results section, “Codon Usage and mRNA Structure Synergize to Determine Ribosome Loading and mRNA Half-Life,” reports that increasing either codon optimality or secondary structure increased median protein expression when the other was held constant. The paper specifies that greater structure is beneficial in the coding region beyond the 5′ leader; the highest-codon-optimality, most-structured group showed no further increase over the improved groups. (LLM, conf=0.90)
plainstates a cause- Asserted: passes — The authors put it forward as true.
- Checkable: passes — It can be checked against evidence.
- Load-bearing: passes — The paper’s conclusions depend on it.
- Based: passes — The paper gives a reason why it holds.
- Supported
The cited sources support only part of this claim — read each source’s verdict below.
In the paper
“However, mRNA molecules are chemically unstable and prone to degrade, which leads to insufficient protein expression5”
§ Algorithm for optimized mRNA design improves stability and immunogenicity > Main
What the sources say
- Partly supportedcites [5] Mauger, D. M. et al. mRNA structure regulates protein expression through changes in functional half-life. Proc. Natl Acad. Sci. USA 116, 24075–24083 (2019). sourceExperimental — accuracy not yet measured
The Results section (page unavailable) reports that protein output correlated strongly with mRNA functional half-life, supporting a link between shorter productive life and lower expression. But it explicitly says functional half-life is not necessarily physical degradation; the paper does not establish that chemical instability and degradation caused the lower expression. (LLM, conf=0.88)
plainstates a cause- Asserted: passes — The authors put it forward as true.
- Checkable: passes — It can be checked against evidence.
- Load-bearing: passes — The paper’s conclusions depend on it.
- Based: passes — The paper gives a reason why it holds.
- Partly supported
87 more claims · 9 with their cited sources checked
Create a free account to see all 157 claims and to verify the 1 reference still open.
- Probably not a substantial claim. 25
- It may state two separate claims as one. 45
Citations
Cites
Safety and Efficacy of the BNT162b2 mRNA Covid-19 Vaccine
Polack, F. P., Thomas, S. J., Kitchin, N., Absalon, J., Gurtman, A., Lockhart, S., Perez, J. L., Pérez Marc, G., Moreira, E. D., Zerbini, C., et al. (2020) · New England Journal of Medicine · doi:10.1056/nejmoa2034577 · Cited by 14,592
Efficacy and Safety of the mRNA-1273 SARS-CoV-2 Vaccine
Baden, L. R., El Sahly, H. M., Essink, B., Kotloff, K., Frey, S., Novak, R., Diemert, D., Spector, S. A., Rouphael, N., Creech, C. B., et al. (2021) · New England Journal of Medicine · doi:10.1056/nejmoa2035389 · Cited by 10,119
Cryo-EM structure of the 2019-nCoV spike in the prefusion conformation
Wrapp, D., Wang, N., Corbett, K. S., Goldsmith, J. A., Hsieh, C.-L., Abiona, O., Graham, B. S., & McLellan, J. S. (2020) · Science · doi:10.1126/science.abb2507 · Cited by 8,897
UniProt: a hub for protein information
The UniProt Consortium (2015) · Nucleic Acids Research · doi:10.1093/nar/gku989 · Cited by 5,106
Lorenz, R., Bernhart, S. H., Höner zu Siederdissen, C., Tafer, H., Flamm, C., Stadler, P. F., & Hofacker, I. L. (2011) · Algorithms for Molecular Biology · doi:10.1186/1748-7188-6-26 · Cited by 5,098
mRNA vaccines — a new era in vaccinology
Pardi, N., Hogan, M. J., Porter, F. W., & Weissman, D. (2018) · Nature Reviews Drug Discovery · doi:10.1038/nrd.2017.243 · Cited by 4,667
Direct Gene Transfer into Mouse Muscle in Vivo
Wolff, J. A., Malone, R. W., Williams, P., Chong, W., Acsadi, G., Jani, A., & Felgner, P. L. (1990) · Science · doi:10.1126/science.1690918 · Cited by 4,173
Sharp, P. M., & Li, W.-H. (1987) · Nucleic Acids Research · doi:10.1093/nar/15.3.1281 · Cited by 3,992
Mathews, D. H., Sabina, J., Zuker, M., & Turner, D. H. (1999) · Journal of Molecular Biology · doi:10.1006/jmbi.1999.2700 · Cited by 3,795
Self-citationBiological sequence analysis probabilistic models of proteins and nucleic acids
Durbin, R. M., Eddy, S. R., Krogh, A., & Mitchison, G. (1998) · Cited by 3,565
Research works printed but not linked: 4
- Hall, K. B. Best-First Word-Lattice Parsing: Techniques for Integrated Syntactic Language Modeling. PhD thesis, Brown Univ. (2005).
- Nederhof, M. J. & Satta, G. Probabilistic parsing as intersection. In Proc. 8th International Conference on Parsing Technologies 137–148 (2003).
- Huang, L. & Sagae, K. Dynamic programming for linear-time incremental parsing. In Proc. 48th Annual Meeting of the Association for Computational Linguistics 1077–1086 (Association for Computational Linguistics, 2010).
- Huang, L., Fayong, S. & Guo, Y. Structured perceptron with inexact search. In Proc. 2012 Conference of the North American Chapter of the Association for Computational Linguistics: Human Language Technologies 142–151 (Association for Computational Linguistics, 2012).
Cited by
Therapeutic cancer vaccines: Advancements, challenges, and prospects
Fan, T., Zhang, M., Yang, J., Zhu, Z., Cao, W., & Dong, C. (2023) · Signal Transduction and Targeted Therapy · doi:10.1038/s41392-023-01674-3 · Cited by 597
mRNA vaccines for infectious diseases — advances, challenges and opportunities
Pardi, N., & Krammer, F. (2024) · Nature Reviews Drug Discovery · doi:10.1038/s41573-024-01042-y · Cited by 229
Designing nanotheranostics with machine learning
Rao, L., Yuan, Y., Shen, X., Yu, G., & Chen, X. (2024) · Nature Nanotechnology · doi:10.1038/s41565-024-01753-8 · Cited by 207
“More importantly, polymer surface activity was found 94,97 • Nanoplasmonic detection and nanopore sequencing 30,111 • mRNA vaccine and nanodrug development 39,133 Unsupervised learning”
InfluentialChemically Modified Platforms for Better RNA Therapeutics
Shi, Y., Zhen, X., Zhang, Y., Li, Y., Koo, S., Saiding, Q., Kong, N., Liu, G., Chen, W., & Tao, W. (2024) · Chemical Reviews · doi:10.1021/acs.chemrev.3c00611 · Cited by 172
Self-citationStrategies for non-viral vectors targeting organs beyond the liver
Kim, J., Eygeris, Y., Ryals, R. C., Jozić, A., & Sahay, G. (2023) · Nature Nanotechnology · doi:10.1038/s41565-023-01563-4 · Cited by 171
“Zhang et al. recently reported a novel algorithm called LinearDesign, which has the ability to optimize both codon usage and mRNA stability concurrently 209 .”
Metadata
- Authors
- Zhang, H., Zhang, L., Lin, A., Xu, C., Li, Z., Liu, K., Liu, B., Ma, X., Zhao, F., Jiang, H., Chen, C., Shen, H., Li, H., Mathews, D. H., Zhang, Y., & Huang, L.
- Affiliations
- Oregon State University (US)
- China Pharmaceutical University (CN)
- Baidu (China) (CN)
- National University of Singapore (SG)
- University of Rochester Medicine (US)
- Corresponding author
- Zhang, Liang
- Li, Hangwen
- Mathews, David H.
- Zhang, Yujian
- Huang, Liang
- ORCID
- Venue
- Nature
- Published
- 2023-05-02
- Volume
- 621
- Issue
- 7978
- Pages
- 396-403
- ISSN
- 0028-0836 (ISSN-L)
- 1476-4687
- PMC
- PMC10499610
- OpenAlex
- W4367681391
- Semantic Scholar
- 0ce2602824c861bd268acb6a61c6681b85e32df7
- Cited by
- 531
- References
- 61
- Citations by year
- 2026: 193 · 2025: 182 · 2024: 119 · 2023: 32
- FWCI
- 40.70
- Type
- journal article
- Language
- en
- Open access
- hybrid
- doi.org
- Licence
- cc-by
- creativecommons.org/licenses/by/4.0 (tdm)
- creativecommons.org/licenses/by/4.0 (vor)
- Locations
- Nature (publishedVersion, cc-by)
- PubMed Central (publishedVersion, cc-by)
- PubMed (publishedVersion)
- arXiv (Cornell University) (submittedVersion)
- RePEc: Research Papers in Economics (submittedVersion)
- arXiv (Cornell University)
- Funders
- Pfizer
- Sanofi
- Baidu
- National Institutes of Health
- University of California, Davis
- National Institute of General Medical Sciences (R35GM145283)
- Topics
- Life Sciences › Biochemistry, Genetics and Molecular Biology › Molecular Biology › RNA and protein synthesis mechanisms
- Health Sciences › Medicine › Infectious Diseases › SARS-CoV-2 and COVID-19 Research
- Life Sciences › Biochemistry, Genetics and Molecular Biology › Molecular Biology › RNA Interference and Gene Delivery
- Keywords
- mRNA vaccine design, mRNA stability, codon optimization, SARS-CoV-2 spike protein, mRNA secondary structure, immunogenicity, antibody titers, mRNA half-life, varicella-zoster vaccine, mRNA therapeutics
- MeSH terms
- COVID-19, SARS-CoV-2, COVID-19 Vaccines, mRNA Vaccines, Algorithms, Animals, Codon, Half-Life, Humans, RNA, Messenger, Herpesvirus 3, Human, RNA Stability, Mice, Spike Glycoprotein, Coronavirus
About these checks
Registry, retraction, Cites and statistics results are computed, not judged, with one exception: a printed reference that no index lists is read once by a model before it counts as a citation error. Claims are extracted by a model and kept only when their quote appears verbatim in the text; each cited source is then checked, with a model’s help, for whether it says what the claim relies on. Those verdicts can be wrong — read the claim’s quote and the cited source before relying on one.
The claim verdicts this report counts are experimental: their accuracy is not yet measured.
A language model drew the claims from the paper on 2026-10-09, under version 3 of the claim definition (model deepseek-v4.1-flash, prompt extract-v3).
A second model labelled each claim on 2026-10-09 (model jev-1.13-20260917, definition revision gold-guideline-v0.2).
Cited sources are checked with a language model’s help (gpt-6-sol).
Statistics and arithmetic are recomputed, not judged.
Confidence bands are shown only for fields calibrated on our annotated test set. None is calibrated yet, so no band is shown.
What counts as a claim ›How we measure confidence ›How we check this ›
Are you an author, or do you see a problem with this page? Request a review
How to cite
Cite CoChat for the checks on this page, and the paper for its own findings.
- This page
- CoChat. (2026). Citation check: Algorithm for optimized mRNA design improves stability and immunogenicity. https://app.cochat.ai/papers/10.1038/s41586-023-06127-z
- The paper
- Zhang, H., Zhang, L., Lin, A., Xu, C., Li, Z., Liu, K., Liu, B., Ma, X., Zhao, F., Jiang, H., Chen, C., Shen, H., Li, H., Mathews, D. H., Zhang, Y., & Huang, L. (2023). Algorithm for optimized mRNA design improves stability and immunogenicity. Nature. https://doi.org/10.1038/s41586-023-06127-z
Data sources
Bibliographic data: Semantic Scholar, OpenAlex, Crossref.
Contains information from the Semantic Scholar Academic Graph Datasets, made available under the ODC Attribution License (ODC-BY 1.0).
Semantic Scholar’s data is described in: Kinney, R., et al. (2023). The Semantic Scholar Open Data Platform. arXiv:2301.10140.
