PreprintCited by 10Bacteriophages and microbial interactionsPlant and Fungal Interactions ResearchBacterial Genetics and Biotechnology

The DOI matches its Crossref record; 1 of the 1 references it cites were found in a registry or an index.

In depth characterization of an archaeal virus-host system reveals numerous virus exclusion mechanisms

Open access

Preprint — published as 10.3389/fmicb.2023.1274068

Abstract

Archaeal head-tailed viruses appear, at first sight, very closely related to head-tailed bacteriophages simply due to morphological similarities and similar life cycles. However, they encounter host cells that are very different from bacteria and share characteristics, that greatly influence virus life cycles, with eukaryotes. Here we present an in-depth characterization of the archaeal head-tailed virus, HRTV-Dl1, isolated from Deep Lake, Antarctica. The host Halorubrum lacusprofundi exhibits a large arsenal of virus exclusion mechanisms, indicating a long ongoing arms race with viruses. However, we uncover that the majority of this arsenal was lost spontaneously in a strain grown under non-challenging laboratory conditions. By challenging both the parental strain and the sensitive strain with HRTV-DL1, we discovered a number of putative virus exclusion mechanisms that are only activated in the sensitive strain upon the lack of defense systems present in the parental strain. We identify virus exclusion mechanisms that are also common in bacteria, mechanisms that are unique to archaea, and a potential mechanisms involving the archaeal homolog of the eukaryotic ORC1 and CDC6. We identify one of two S-layer proteins as primary receptor for HRTV-DL1, demonstrating that the presence of two different S-layer proteins in one strain provides a strong advantage in the arms race with viruses. Our results clearly reflect the differences between bacterial and archaeal head-tailed viruses. Finally, we observed that our intention to isolate a clean and stable model virus-host system led to the generation of a virus-host pair with reduced genomes. This model system is great to study in the laboratory, but barely reflects the entire spectrum of virus-host interactions as they would occur in the environment, emphasizing the importance of combining wet lab data with environmental data.

Overview

The claims and statistics of this paper haven’t been checked yet.

Run the check — free, no account needed. It reads the open-access text and checks the sources it cites.

A few free checks a day · papers already verified open instantly · results are public

Integrity signals

Registry

Crossref · 10.1101/2022.10.18.512658

Cites

1 of 1 references verified0 citation errors · 0 not checkable

Statistics

Figures

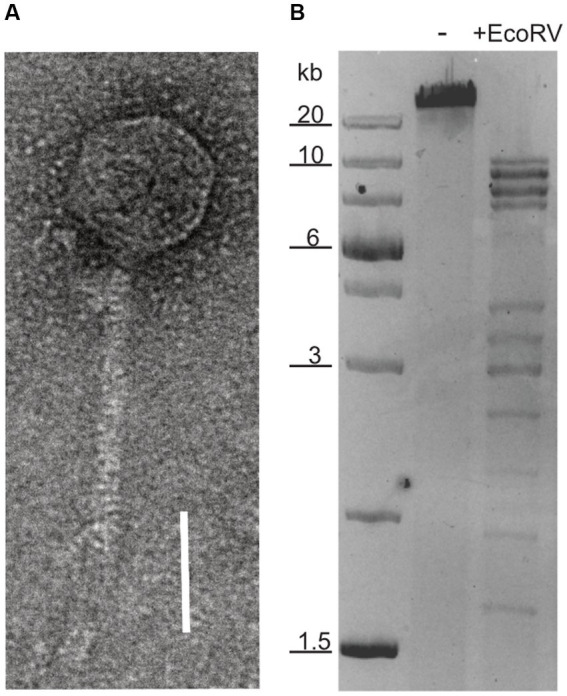
Figure 1 Nucleic acid content and particle of HRTV-DL. (A) Electron micrograph of HRTV-DL particle. Sample was negatively stained with 2% uranyl acetate. Size bar: 50 nm. (B) Total DNA of HRTV-DL undigested (-) and digested with EcoRV (+EcoRV). MW size marker is shown to the left of the gel (GeneRuler 1 kb Plus DNA Ladder, Thermo Fisher Scientific). DNA was separated on 1% agarose gels and stained with SYBR™ Safe DNA stain. Size bar: 50 nm. Original images have been modified by cropping to improve visual presentation.
Figure 1 Nucleic acid content and particle of HRTV-DL. (A) Electron micrograph of HRTV-DL particle. Sample was negatively stained with 2% uranyl acetate. Size bar: 50 nm. (B) Total DNA of HRTV-DL undigested (-) and digested with EcoRV (+EcoRV). MW size marker is shown to the left of the gel (GeneRuler 1 kb Plus DNA Ladder, Thermo Fisher Scientific). DNA was separated on 1% agarose gels and stained with SYBR™ Safe DNA stain. Size bar: 50 nm. Original images have been modified by cropping to improve visual presentation.CC BY · PubMed Central
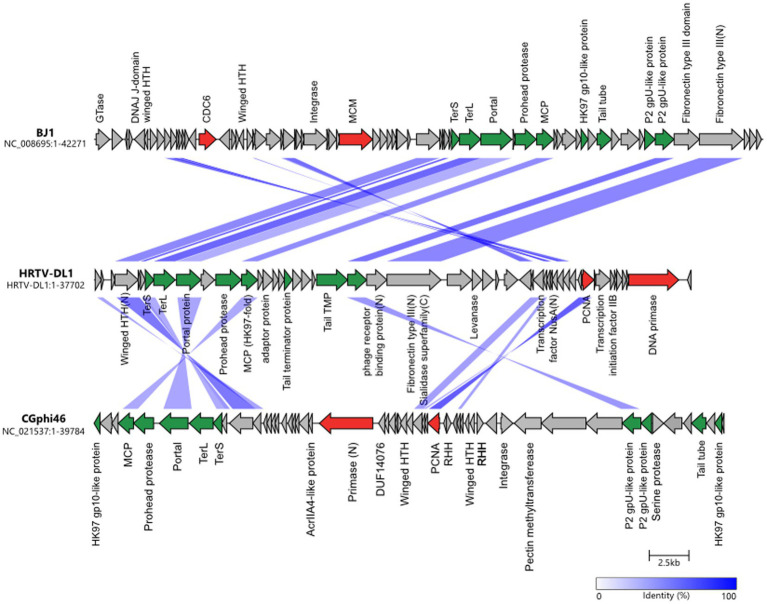
Figure 2 Comparisons of genomes HRTV-DL1 (OP630575) with BJ1 (NC_008695) and CGphi46 (NC_021537) belonging to the Flexireviridae. Protein functions are indicated above or below the corresponding ORFs. Genes encoding virus morphogenesis–related proteins are colored in green, whereas replication-related genes are colored in red. Homologous genes shared between viruses are connected by shadings of different degrees of blue based on the amino acid sequence identity. Figure was generated with clinker & clustermap.js (Gilchrist and Chooi, 2021).
Figure 2 Comparisons of genomes HRTV-DL1 (OP630575) with BJ1 (NC_008695) and CGphi46 (NC_021537) belonging to the Flexireviridae. Protein functions are indicated above or below the corresponding ORFs. Genes encoding virus morphogenesis–related proteins are colored in green, whereas replication-related genes are colored in red. Homologous genes shared between viruses are connected by shadings of different degrees of blue based on the amino acid sequence identity. Figure was generated with clinker & clustermap.js (Gilchrist and Chooi, 2021).CC BY · PubMed Central
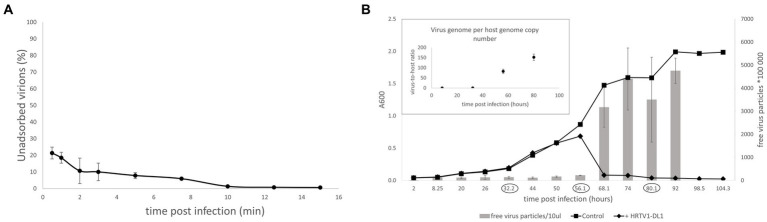
Figure 3 Life cycle of HRTV-DL1. (A) Adsorption of HRTV-DL1 to cells of Hrr. lacusprofundi ACAM34_UNSW. Cells were incubated with HRTV-DL1 at room temperature (20°C). The number of unbound virus particles was determined at different time points post infection by plaque assay. Graph represents one of three biological replicates. Error bars represent standard deviation from three independent experiments. (B) Growth curve of uninfected control and HRTV-DL1 infected Hrr. lacusprofundi ACAM34_UNSW. Free virus particles in 10ul culture supernatant were determined by plaque assay. Inset: Virus-host ratio determined by comparing copy numbers of host main chromosome and virus genome. Copy numbers were determined per ml cell culture by qPCR and samples were taken at time points encircled in the growth curve in the main figure. Graphs represent one of three biological replicates. Error bars represent standard deviation from three independent experiments.
Figure 3 Life cycle of HRTV-DL1. (A) Adsorption of HRTV-DL1 to cells of Hrr. lacusprofundi ACAM34_UNSW. Cells were incubated with HRTV-DL1 at room temperature (20°C). The number of unbound virus particles was determined at different time points post infection by plaque assay. Graph represents one of three biological replicates. Error bars represent standard deviation from three independent experiments. (B) Growth curve of uninfected control and HRTV-DL1 infected Hrr. lacusprofundi ACAM34_UNSW. Free virus particles in 10ul culture supernatant were determined by plaque assay. Inset: Virus-host ratio determined by comparing copy numbers of host main chromosome and virus genome. Copy numbers were determined per ml cell culture by qPCR and samples were taken at time points encircled in the growth curve in the main figure. Graphs represent one of three biological replicates. Error bars represent standard deviation from three independent experiments.CC BY · PubMed Central
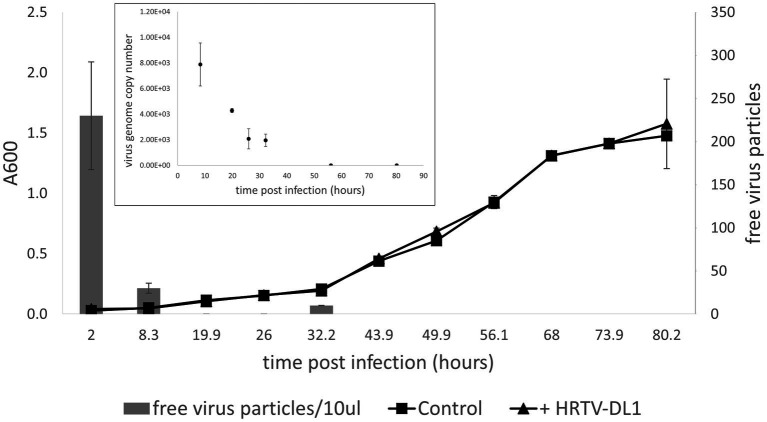
Figure 4 Infection of Hrr. lacusprofundi ACAM34_DSMZ with HRTV-DL1. Growth curve of uninfected control and HRTV-DL1 infected Hrr. lacusprofundi ACAM34_DSMZ. Free virus particles in 10ul culture supernatant were determined by plaque assay. Inset: Virus genome copy number determined per ml cell culture by qPCR. Samples were taken from the growth curve shown in the main figure. Samples in which virus genomes could not be detected by qPCR were set to 0. Graphs represent one of three biological replicates. Error bars represent standard deviation from three independent experiments.
Figure 4 Infection of Hrr. lacusprofundi ACAM34_DSMZ with HRTV-DL1. Growth curve of uninfected control and HRTV-DL1 infected Hrr. lacusprofundi ACAM34_DSMZ. Free virus particles in 10ul culture supernatant were determined by plaque assay. Inset: Virus genome copy number determined per ml cell culture by qPCR. Samples were taken from the growth curve shown in the main figure. Samples in which virus genomes could not be detected by qPCR were set to 0. Graphs represent one of three biological replicates. Error bars represent standard deviation from three independent experiments.CC BY · PubMed Central
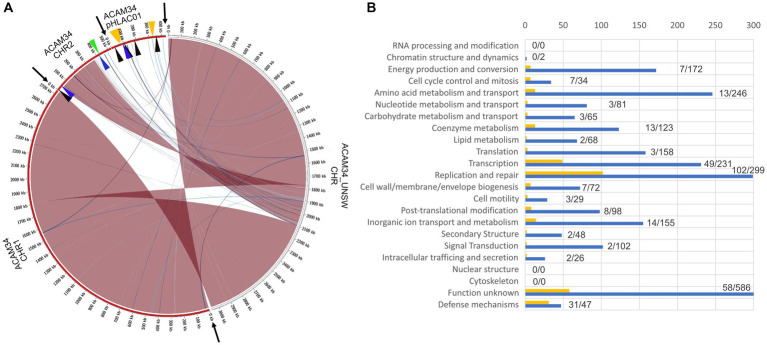
Figure 5 (A) Genome comparison of ACAM34_UNSW with the three replicons CHR1, CHR2 and pHLAC01 (NC_012029.1, NC_012028.1 and NC_012030.1) of the reference genome from NCBI (ATCC 49239). Interconnecting lines highlight regions present in both genomes (red/blue colors indicates same/reverse orientation on the two genomes). The figure highlights that the ACAM34_UNSW genome (on the right side, white outer ring) consists of a single replicon comprising the full length primary replicon (NC_012029.1) and parts of one secondary replicon (NC_012028.1) of the reference genome while pHLAC01 (NC_012030.1) of the reference genome (on the right side, red outer ring) is lost. Genomic regions shared between the two genomes were identified using NUCmer (Kurtz et al., 2004) and visualized with Circos (Krzywinski et al., 2009) wrapped within the script mummer2circos.py (https://github.com/metagenlab/mummer2circos). Black arrows indicate the borders between the three replicons of the reference genome. Colored arrows mark the position of the virus defense systems predicted with PADLOC (Payne et al., 2022). Black: DNA modification system, Blue: Argonaut-like protein, Green: BREX system, Orange: CRISPR system. (B) Functional profile of genes lost in ACAM34_UNSW. Blue bars represent the number of genes assigned to each particular functional category of all genes present on the ACAM34_DSMZ genome (X). Yellow bars represent the number of genes assigned to each particular functional category of all genes lost in ACAM34_UNSW (Y). Numbers behind the bars indicated genes lost / total amount of genes assigned to the category (Y/X). Functional classification of the Hrr. lacusprofundi genomes was performed using the cluster of orthologous genes (COG) database.
Figure 5 (A) Genome comparison of ACAM34_UNSW with the three replicons CHR1, CHR2 and pHLAC01 (NC_012029.1, NC_012028.1 and NC_012030.1) of the reference genome from NCBI (ATCC 49239). Interconnecting lines highlight regions present in both genomes (red/blue colors indicates same/reverse orientation on the two genomes). The figure highlights that the ACAM34_UNSW genome (on the right side, white outer ring) consists of a single replicon comprising the full length primary replicon (NC_012029.1) and parts of one secondary replicon (NC_012028.1) of the reference genome while pHLAC01 (NC_012030.1) of the reference genome (on the right side, red outer ring) is lost. Genomic regions shared between the two genomes were identified using NUCmer (Kurtz et al., 2004) and visualized with Circos (Krzywinski et al., 2009) wrapped within the script mummer2circos.py (https://github.com/metagenlab/mummer2circos). Black arrows indicate the borders between the three replicons of the reference genome. Colored arrows mark the position of the virus defense systems predicted with PADLOC (Payne et al., 2022). Black: DNA modification system, Blue: Argonaut-like protein, Green: BREX system, Orange: CRISPR system. (B) Functional profile of genes lost in ACAM34_UNSW. Blue bars represent the number of genes assigned to each particular functional category of all genes present on the ACAM34_DSMZ genome (X). Yellow bars represent the number of genes assigned to each particular functional category of all genes lost in ACAM34_UNSW (Y). Numbers behind the bars indicated genes lost / total amount of genes assigned to the category (Y/X). Functional classification of the Hrr. lacusprofundi genomes was performed using the cluster of orthologous genes (COG) database.CC BY · PubMed Central
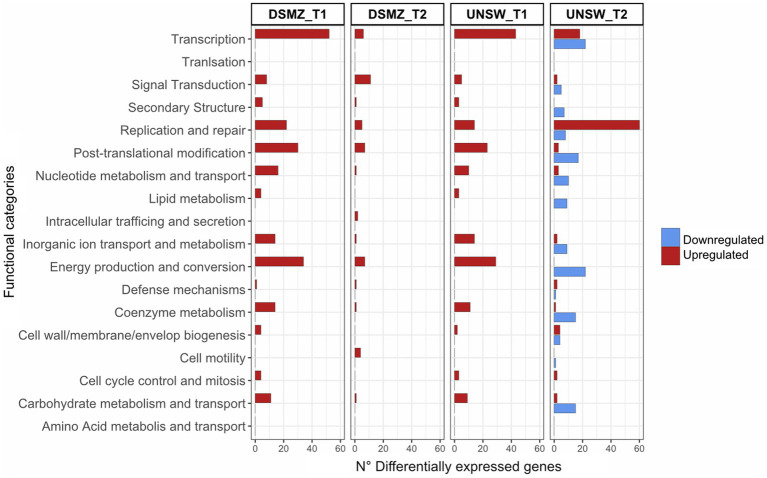
Figure 6 Functional profile of differentially expressed genes in ACAM34_DSMZ and ACAM34_UNSW under infection with HRTV-DL1. Bars represent the number of differentially expressed genes assigned to each particular functional category at a given time point (T1 = 32 h post infection, T2 = 56 h post infection). Functional classification of the Hrr. lacusprofundi genomes was performed using the cluster of orthologous genes (COG) database. The colors of the bars indicate if genes are upregulated (red) or downregulated (blue) respectively. Genes that were not assigned to any functional category are not displayed on the plot (for detailed information see Supplementary Tables S5, S6).
Figure 6 Functional profile of differentially expressed genes in ACAM34_DSMZ and ACAM34_UNSW under infection with HRTV-DL1. Bars represent the number of differentially expressed genes assigned to each particular functional category at a given time point (T1 = 32 h post infection, T2 = 56 h post infection). Functional classification of the Hrr. lacusprofundi genomes was performed using the cluster of orthologous genes (COG) database. The colors of the bars indicate if genes are upregulated (red) or downregulated (blue) respectively. Genes that were not assigned to any functional category are not displayed on the plot (for detailed information see Supplementary Tables S5, S6).CC BY · PubMed Central
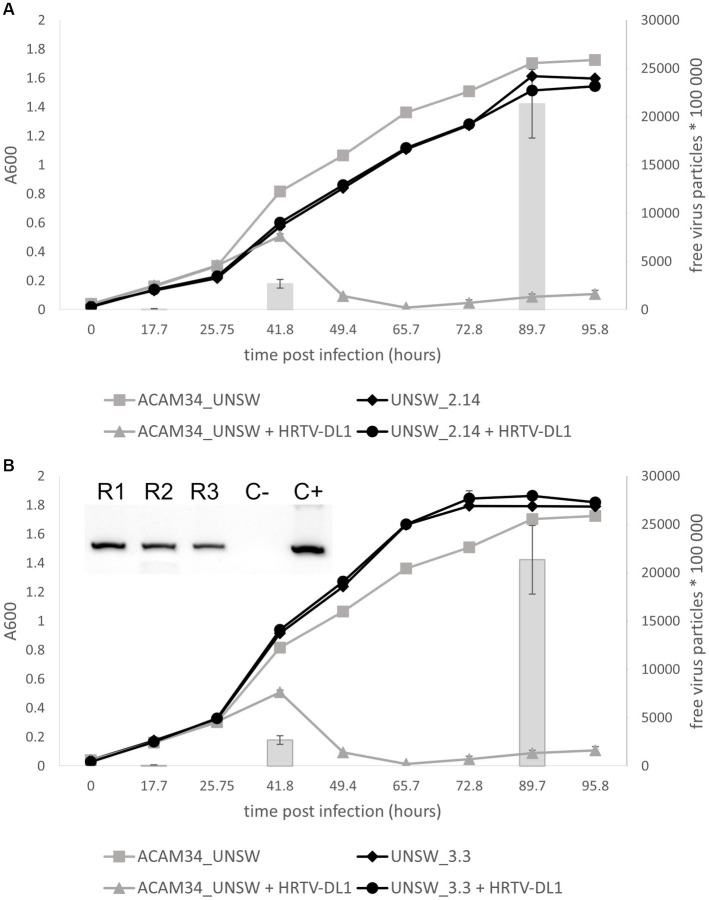
Figure 7 Life cycle of HRTV-DL1 in ACAM34_UNSW escape mutants. Growth curves of uninfected control and HRTV-DL1 infected Hrr. lacusprofundi ACAM34_UNSW, and escape mutants UNSW_2.14 (A) and UNSW_3.3 (B). Free virus particles in 10 ul culture supernatant were determined by plaque assay and are presented by gray bars for the parental strain. For number of virus particles in supernatants of escape mutant cultures please refer to Supplementary Table S11. Graphs represent one replicate for the uninfected controls and one of three biological replicates for infected cultures. Error bars represent standard deviation from three independent experiments. Inset in (B) PCR confirming infection of three replicates of UNSW_3.3 with HRTV-DL1 (R1-R3 replicate 1–3; C− negative control; C+ positive control).
Figure 7 Life cycle of HRTV-DL1 in ACAM34_UNSW escape mutants. Growth curves of uninfected control and HRTV-DL1 infected Hrr. lacusprofundi ACAM34_UNSW, and escape mutants UNSW_2.14 (A) and UNSW_3.3 (B). Free virus particles in 10 ul culture supernatant were determined by plaque assay and are presented by gray bars for the parental strain. For number of virus particles in supernatants of escape mutant cultures please refer to Supplementary Table S11. Graphs represent one replicate for the uninfected controls and one of three biological replicates for infected cultures. Error bars represent standard deviation from three independent experiments. Inset in (B) PCR confirming infection of three replicates of UNSW_3.3 with HRTV-DL1 (R1-R3 replicate 1–3; C− negative control; C+ positive control).CC BY · PubMed Central

Verification

Claims the paper makes

The claims and statistics of this paper haven’t been checked yet.

Run the check — free, no account needed. It reads the open-access text and checks the sources it cites.

A few free checks a day · papers already verified open instantly · results are public

Self-check

Percentages, sums and reported differences re-computed from the paper’s own numbers.

The self-check needs the paper’s full text.

Citations

Cites

Research works printed but not linked: 73

  1. 10.1017/S0954102099000243 · DOI
  2. 10.1111/j.1574-6968.2000.tb08937.x · DOI
  3. 10.1073/pnas.1307090110 · DOI
  4. 10.1093/molbev/msy075 · DOI
  5. 10.1186/s40168-018-0495-3 · DOI
  6. 10.1128/MMBR.00042-14 · DOI
  7. 10.1038/nature12650 · DOI
  8. 10.1038/s41564-017-0009-2 · DOI
  9. 10.1111/j.1462-2920.2009.02101.x · DOI
  10. 10.1038/ismej.2015.110 · DOI
  11. 10.3390/life4040681 · DOI
  12. 10.1073/pnas.2205037119 · DOI
  13. 10.1371/journal.pbio.3001442 · DOI · Paper page
  14. 10.1038/s41579-019-0278-2 · DOI
  15. 10.1016/S0723-2020(88)80044-4 · DOI
  16. 1982, Halobacterium halobium phage øH, The EMBO Journal, 1, 87, 10.1002/j.1460-2075.1982.tb01129.x · DOI
  17. 10.1093/nar/gkaa939 · DOI
  18. 10.1093/bioinformatics/bti125 · DOI
  19. 10.1093/nar/gkaa977 · DOI · Paper page
  20. 10.1016/j.jmb.2006.03.043 · DOI
  21. 10.1016/j.jmb.2010.08.044 · DOI
  22. 10.1021/bi900928n · DOI
  23. 10.1038/nrd2400 · DOI
  24. 10.3389/fmicb.2015.00552 · DOI
  25. 10.1016/j.mib.2013.08.008 · DOI
  26. 10.1128/AEM.03152-16 · DOI
  27. 10.1128/JB.02046-14 · DOI
  28. 2020, The Structural Basis of T4 Phage Lysis Control: DNA as the Signal for Lysis Inhibition, Journal of molecular biology, 432, 4623, 10.1016/j.jmb.2020.06.013 · DOI
  29. 10.1186/1471-2164-8-410 · DOI
  30. 10.1111/j.1758-2229.2008.00007.x · DOI
  31. 10.1073/pnas.2022578118 · DOI
  32. 10.1093/nar/gkj014 · DOI · Paper page
  33. 10.1016/j.ygeno.2008.01.001 · DOI
  34. 10.1093/femsre/fuy010 · DOI
  35. 10.1016/j.febslet.2012.07.026 · DOI
  36. 10.1016/0014-5793(77)81004-1 · DOI
  37. 10.1128/JVI.01020-13 · DOI
  38. 10.26508/lsa.201900536 · DOI
  39. 10.3389/fmicb.2019.00051 · DOI
  40. 10.1139/w04-113 · DOI
  41. 10.1038/s41396-019-0580-z · DOI
  42. 10.1093/nar/gkac400 · DOI
  43. 10.1093/oxfordjournals.molbev.a026297 · DOI
  44. 10.1016/j.cub.2011.11.055 · DOI
  45. 10.1126/science.aav4294 · DOI
  46. 10.1038/s41586-021-04058-1 · DOI · Paper page
  47. 10.3390/pathogens9100786 · DOI
  48. 10.1371/journal.ppat.1010744 · DOI
  49. 10.1126/science.aar4120 · DOI
  50. 10.1101/2022.10.04.510915 · DOI · Paper page
  51. 10.1002/jobm.201800204 · DOI
  52. 10.1111/mmi.12248 · DOI
  53. 10.1073/pnas.74.11.5104 · DOI
  54. 10.1080/15476286.2015.1019998 · DOI
  55. 10.1091/mbc.11.5.1673 · DOI
  56. 10.1093/nar/gkq262 · DOI
  57. 10.1242/jcs.178723 · DOI
  58. 10.1128/JB.01020-13 · DOI
  59. 10.1016/j.virol.2005.01.043 · DOI
  60. 10.1006/viro.1993.1643 · DOI
  61. 10.1038/srep34639 · DOI
  62. 10.1371/journal.pone.0105592 · DOI
  63. 10.1038/s41587-019-0072-8 · DOI · Paper page
  64. 10.1089/cmb.2012.0021 · DOI
  65. 10.1093/bioinformatics/btaa490 · DOI
  66. 10.1093/bioinformatics/btu153 · DOI
  67. 10.1093/bioinformatics/bti553 · DOI
  68. 10.1038/s41598-017-07910-5 · DOI
  69. 10.1128/jb.91.2.469-476.1966 · DOI
  70. 10.1093/nar/gkm360 · DOI
  71. 10.1093/bioinformatics/btab007 · DOI
  72. 10.1186/gb-2004-5-2-r12 · DOI · Paper page
  73. 10.1101/gr.092759.109 · DOI

Metadata

Authors
Mercier, C., Thies, D., Zhong, L., Raftery, M. J., Cavicchioli, R., & Erdmann, S.
Affiliations
  • Max Planck Institute for Marine Microbiology (DE)
  • UNSW Sydney (AU)
Corresponding author
Erdmann, Susanne
Venue
Frontiers in Microbiology
Publisher
openRxiv
Published
2022-10-18
Volume
14
Pages
1274068-1274068
ISSN
1664-302X (ISSN-L)
OpenAlex
W4386864121
Cited by
10
References
1
Citations by year
2026: 3 · 2025: 1 · 2024: 3 · 2023: 3
FWCI
1.62
Type
journal article
Language
en
Open access
Licence
cc-by
Locations
  • Frontiers in Microbiology (publishedVersion, cc-by)
  • bioRxiv (Cold Spring Harbor Laboratory) (acceptedVersion)
  • PubMed Central (publishedVersion, cc-by)
  • PubMed (publishedVersion)
  • DOAJ (DOAJ: Directory of Open Access Journals) (submittedVersion, cc-by-sa)
Funders
  • Bristol-Myers Squibb Foundation
  • Analytical Center for the Government of the Russian Federation
  • University of New South Wales
  • Max-Planck-Gesellschaft
  • Australian Research Council (DP170102576)
Topics
  • Life Sciences › Immunology and Microbiology › Virology › Bacteriophages and microbial interactions
  • Life Sciences › Immunology and Microbiology › Virology › Plant and Fungal Interactions Research
  • Life Sciences › Biochemistry, Genetics and Molecular Biology › Genetics › Bacterial Genetics and Biotechnology
Keywords
archaeal viruses, Halorubrum lacusprofundi, host-virus interaction, genome rearrangement, S-layer proteins, viral receptor, host-virus arms race, cold adaptation, halophilic archaea

About these checks

Registry, retraction, Cites and statistics results are computed, not judged, with one exception: a printed reference that no index lists is read once by a model before it counts as a citation error. Claims are extracted by a model and kept only when their quote appears verbatim in the text; each cited source is then checked, with a model’s help, for whether it says what the claim relies on. Those verdicts can be wrong — read the claim’s quote and the cited source before relying on one.

Statistics and arithmetic are recomputed, not judged.

Confidence bands are shown only for fields calibrated on our annotated test set. None is calibrated yet, so no band is shown.

What counts as a claim ›How we measure confidence ›How we check this ›

Are you an author, or do you see a problem with this page? Request a review