PreprintCited by 14Single-cell and spatial transcriptomicsCell Image Analysis TechniquesGene expression and cancer classification

The DOI matches its Crossref record; 1 of the 1 references it cites were found in a registry or an index.

The impacts of active and self-supervised learning on efficient annotation of single-cell expression data

Open access
Geuenich, Michael J., Gong, Dae-won, Campbell, Kieran R.·2023·Nature Communications

Preprint — published as 10.1038/s41467-024-45198-y

Abstract

A crucial step in the analysis of single-cell data is annotating cells to cell types and states. While a myriad of approaches have been proposed, manual labeling of cells to create training datasets remains tedious and time-consuming. In the field of machine learning, active and self-supervised learning methods have been proposed to improve the performance of a classifier while reducing both annotation time and label budget. However, the benefits of such strategies for single-cell annotation have yet to be evaluated in realistic settings. Here, we perform a comprehensive benchmarking of active and self-supervised labeling strategies across a range of single-cell technologies and cell type annotation algorithms. We quantify the benefits of active learning and self-supervised strategies in the presence of cell type imbalance and variable similarity. We introduce several heuristic procedures tailored to single-cell data — including a marker-aware adaptive reweighting cell selection procedure — that shows competitive performance with existing approaches. In addition, we demonstrate that having prior knowledge of cell type markers improves annotation accuracy. Finally, we summarize our findings into a set of recommendations for those implementing cell type annotation procedures or platforms. An R package implementing the heuristic approaches introduced in this work may be found at https://github.com/camlab-bioml/leader .

Overview

The claims and statistics of this paper haven’t been checked yet.

Run the check — free, no account needed. It reads the open-access text and checks the sources it cites.

A few free checks a day · papers already verified open instantly · results are public

Integrity signals

Registry

Crossref · 10.1101/2023.06.13.544850

Cites

1 of 1 references verified0 citation errors · 0 not checkable

Statistics

Figures

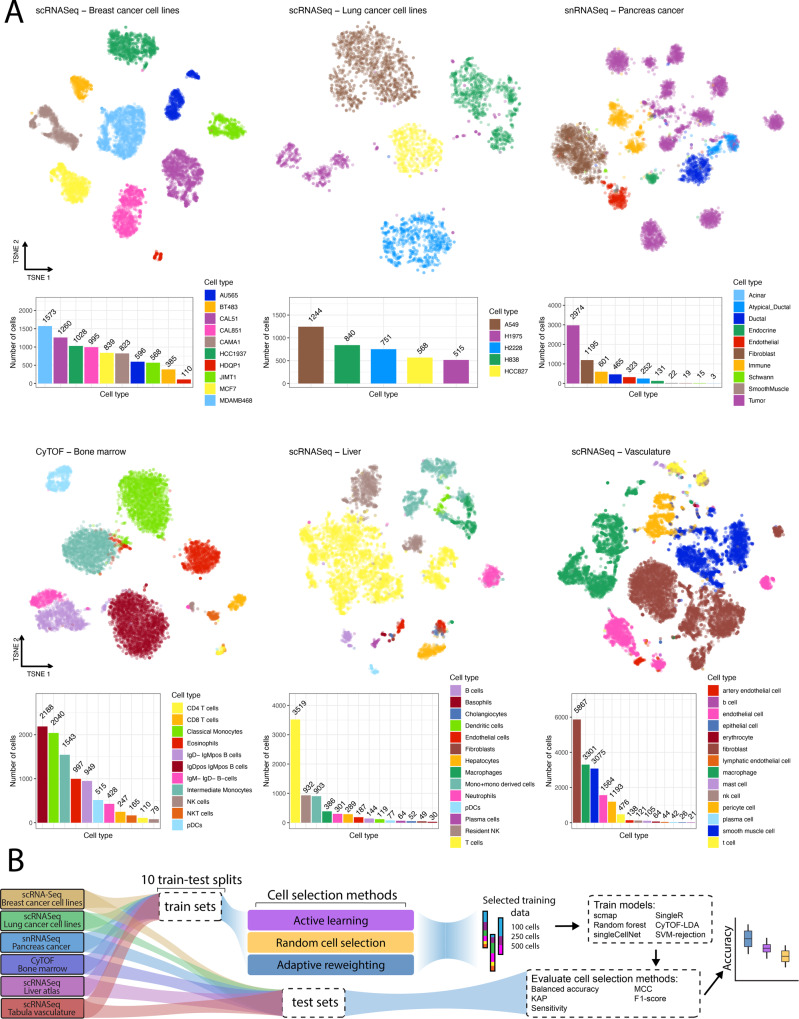
Fig. 1 Benchmarking overview. A TSNE embedding of datasets used in this benchmarking colored by cell type (top) along with bar charts of cell type composition (bottom). B Schematic of the evaluation procedure: each dataset is split into 10 different train-test splits using a 50/50 split. Datasets of size 100, 250 and 500 cells are then sampled from the training dataset using active learning, adaptive reweighting and a random sampling (baseline). SingleR, scmap, CyTOF-LDA, a random forest model, singleCellNet, and a support vector machine is then trained using ground truth labels and evaluated by quantifying cell type prediction accuracy on the held-out test set. Source data are provided on zenodo: 10.5281/zenodo.10403475.
Fig. 1 Benchmarking overview. A TSNE embedding of datasets used in this benchmarking colored by cell type (top) along with bar charts of cell type composition (bottom). B Schematic of the evaluation procedure: each dataset is split into 10 different train-test splits using a 50/50 split. Datasets of size 100, 250 and 500 cells are then sampled from the training dataset using active learning, adaptive reweighting and a random sampling (baseline). SingleR, scmap, CyTOF-LDA, a random forest model, singleCellNet, and a support vector machine is then trained using ground truth labels and evaluated by quantifying cell type prediction accuracy on the held-out test set. Source data are provided on zenodo: 10.5281/zenodo.10403475.CC BY · PubMed Central
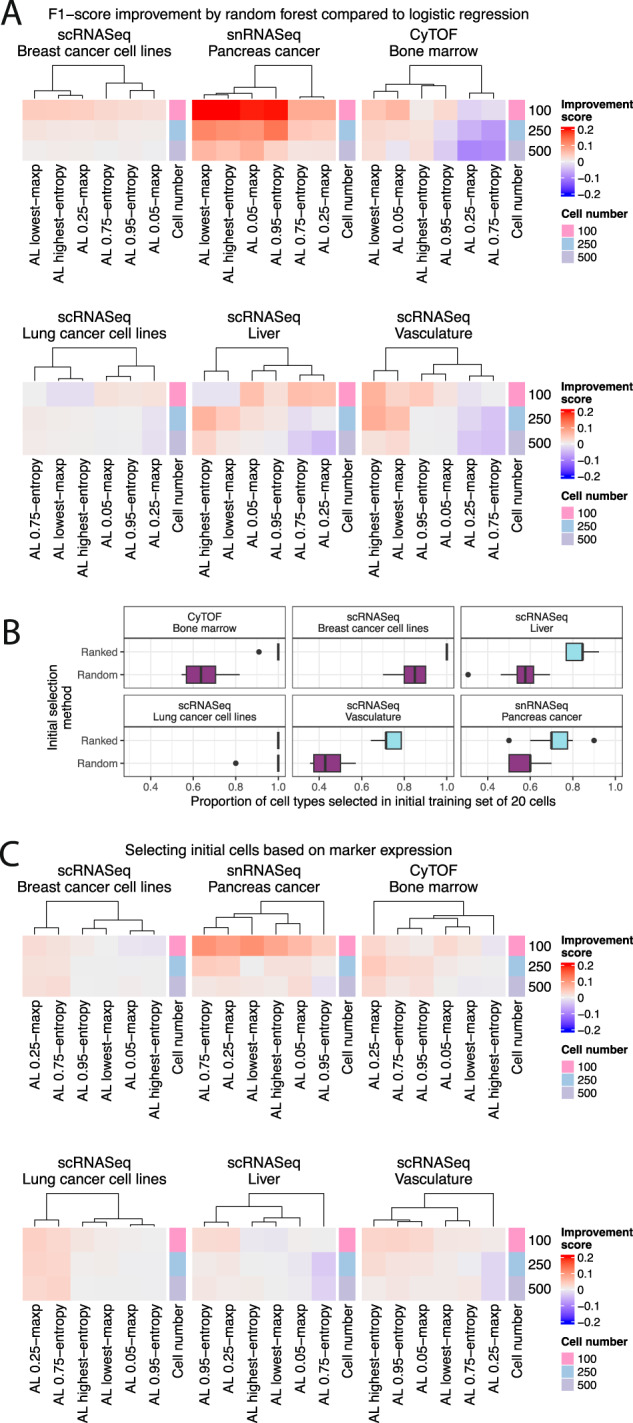
Fig. 2 Active learning is most effective with random forest classifiers and when selecting the initial set of cells by marker expression. A Performance comparison of classifiers trained using a random forest and logistic regression to provide predictive uncertainty estimates for active learning. The relative difference in F1 improvement score is calculated as the difference in F1-score between the random forest and logistic regression models and standardized by the logistic regression F1-score. This score is averaged across train-test splits and cell type prediction methods. The initial set of cells was selected randomly. B Proportion of all cell types represented in the ground truth dataset selected by the random and ranking selection procedures for each of the 10 train test splits. Boxplots depict the median as the center line, the boxes define interquartile range (IQR), the whiskers extend up to 1.5 times the IQR and all points depict outliers from this range. C Same as (A) with the improvement score as the difference between the performance when the initial cells are selected based on cell type marker information and random selection. This score is averaged across train-test splits, active learning algorithms, and cell type prediction methods. The cell number specifies the total size of the training set. Source data are provided on zenodo: 10.5281/zenodo.10403475.
Fig. 2 Active learning is most effective with random forest classifiers and when selecting the initial set of cells by marker expression. A Performance comparison of classifiers trained using a random forest and logistic regression to provide predictive uncertainty estimates for active learning. The relative difference in F1 improvement score is calculated as the difference in F1-score between the random forest and logistic regression models and standardized by the logistic regression F1-score. This score is averaged across train-test splits and cell type prediction methods. The initial set of cells was selected randomly. B Proportion of all cell types represented in the ground truth dataset selected by the random and ranking selection procedures for each of the 10 train test splits. Boxplots depict the median as the center line, the boxes define interquartile range (IQR), the whiskers extend up to 1.5 times the IQR and all points depict outliers from this range. C Same as (A) with the improvement score as the difference between the performance when the initial cells are selected based on cell type marker information and random selection. This score is averaged across train-test splits, active learning algorithms, and cell type prediction methods. The cell number specifies the total size of the training set. Source data are provided on zenodo: 10.5281/zenodo.10403475.CC BY · PubMed Central
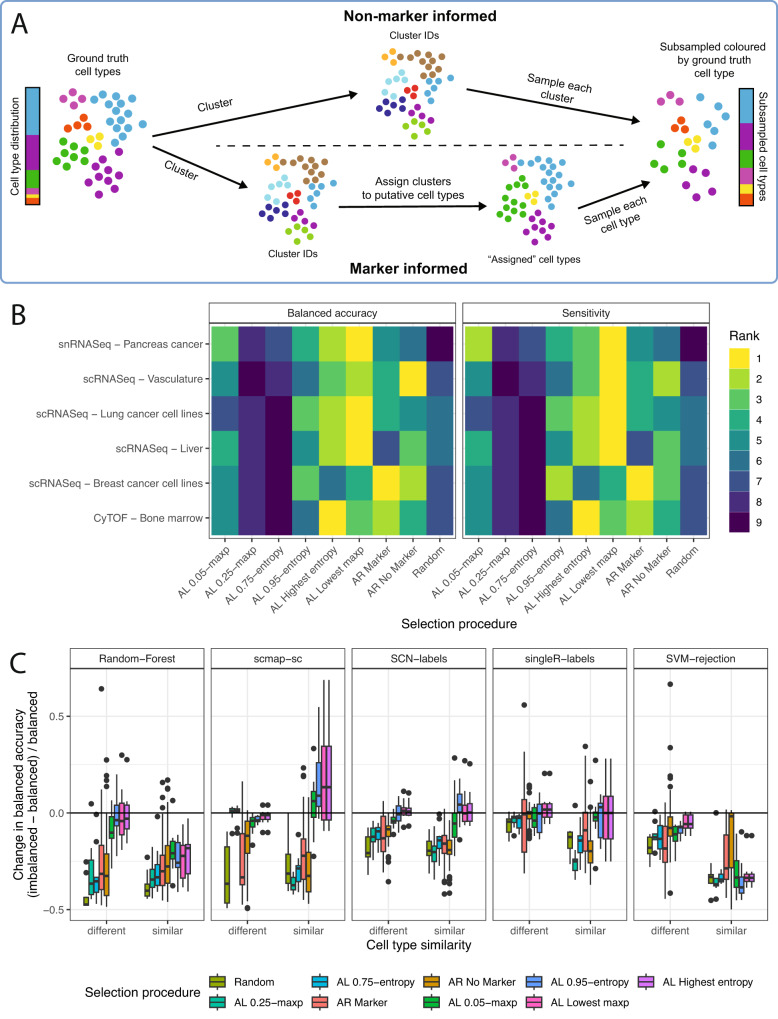
Fig. 3 Investigating the effect of different cell selection methods on predictive performance. A Schematic depicting the adaptive reweighting algorithm. First, the full dataset is clustered using existing methods. In the non-marker-informed case (top) a subsampled dataset to be labeled is created by randomly selecting a set number of cells from each cluster. In the marker-informed case (bottom), each cluster is assigned a putative cell type based on the average expression of marker genes. A subsampled dataset of the size requested by the user is then created by sampling an equal number of cells from all putative cell types. B Performance of all selection methods tested across ten different train test splits (AL active learning, AR adaptive reweighting). Each selection method is ranked by the median balanced accuracy and sensitivity across seeds and cell type assignment methods. For the active learning results, the initial cell selection was ranked, and a random forest was used. C The difference in balanced accuracy between an imbalanced and a balanced dataset standardized by the balanced dataset for the snRNASeq cohort indicates improved classification accuracy by active learning approaches in imbalanced settings. Selection procedures are ordered by the average change in balanced accuracy. The balanced dataset is composed of two cell types with 250 cells each, while the imbalanced dataset is composed of 50 cells of one type, and 450 of another. In the snRNASeq cohort the similar dataset is composed of tumor and atypical ductal cells, while the different dataset is composed of tumor and immune cells. Boxplots depict the median as the center line, the boxes define interquartile range (IQR), the whiskers extend up to 1.5 times the IQR and all points depict outliers from this range. Source data are provided on zenodo: 10.5281/zenodo.10403475.
Fig. 3 Investigating the effect of different cell selection methods on predictive performance. A Schematic depicting the adaptive reweighting algorithm. First, the full dataset is clustered using existing methods. In the non-marker-informed case (top) a subsampled dataset to be labeled is created by randomly selecting a set number of cells from each cluster. In the marker-informed case (bottom), each cluster is assigned a putative cell type based on the average expression of marker genes. A subsampled dataset of the size requested by the user is then created by sampling an equal number of cells from all putative cell types. B Performance of all selection methods tested across ten different train test splits (AL active learning, AR adaptive reweighting). Each selection method is ranked by the median balanced accuracy and sensitivity across seeds and cell type assignment methods. For the active learning results, the initial cell selection was ranked, and a random forest was used. C The difference in balanced accuracy between an imbalanced and a balanced dataset standardized by the balanced dataset for the snRNASeq cohort indicates improved classification accuracy by active learning approaches in imbalanced settings. Selection procedures are ordered by the average change in balanced accuracy. The balanced dataset is composed of two cell types with 250 cells each, while the imbalanced dataset is composed of 50 cells of one type, and 450 of another. In the snRNASeq cohort the similar dataset is composed of tumor and atypical ductal cells, while the different dataset is composed of tumor and immune cells. Boxplots depict the median as the center line, the boxes define interquartile range (IQR), the whiskers extend up to 1.5 times the IQR and all points depict outliers from this range. Source data are provided on zenodo: 10.5281/zenodo.10403475.CC BY · PubMed Central
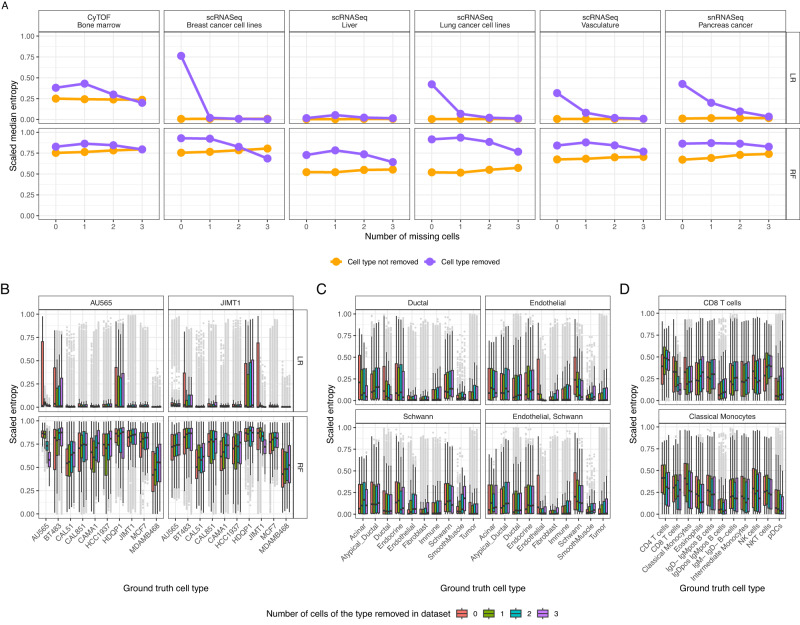
Fig. 4 Unlabeled cells have higher entropy values. A Median scaled entropy values for each cohort when all cells of a type were removed (purple) and all other cells (yellow). B Entropy of the cell type predictive distribution for all cells not in the initial training set of 20 cells for the scRNASeq breast cancer dataset. Boxplots are colored by the number of cells present of a particular type (shown in the plot title), while the x axis shows the ground truth cell type label. C For the snRNASeq pancreas cancer dataset, with the bottom right panel depicting the effect of removed endothelial and schwann cells and (D) effect of removing CD8 T cells and classical monocytes from the CyTOF bone marrow dataset. As entropy is bounded by the total number of classes, the entropy values depicted were scaled by the maximum possible value for each experiment. Shown are the results across the 10 different train test splits. All boxplots depict the median as the center line, the boxes define interquartile range (IQR), the whiskers extend up to 1.5 times the IQR and all points depict outliers from this range. Abbreviations: logistic regression (LR), random forest (RF). Source data are provided on zenodo: 10.5281/zenodo.10403475.
Fig. 4 Unlabeled cells have higher entropy values. A Median scaled entropy values for each cohort when all cells of a type were removed (purple) and all other cells (yellow). B Entropy of the cell type predictive distribution for all cells not in the initial training set of 20 cells for the scRNASeq breast cancer dataset. Boxplots are colored by the number of cells present of a particular type (shown in the plot title), while the x axis shows the ground truth cell type label. C For the snRNASeq pancreas cancer dataset, with the bottom right panel depicting the effect of removed endothelial and schwann cells and (D) effect of removing CD8 T cells and classical monocytes from the CyTOF bone marrow dataset. As entropy is bounded by the total number of classes, the entropy values depicted were scaled by the maximum possible value for each experiment. Shown are the results across the 10 different train test splits. All boxplots depict the median as the center line, the boxes define interquartile range (IQR), the whiskers extend up to 1.5 times the IQR and all points depict outliers from this range. Abbreviations: logistic regression (LR), random forest (RF). Source data are provided on zenodo: 10.5281/zenodo.10403475.CC BY · PubMed Central
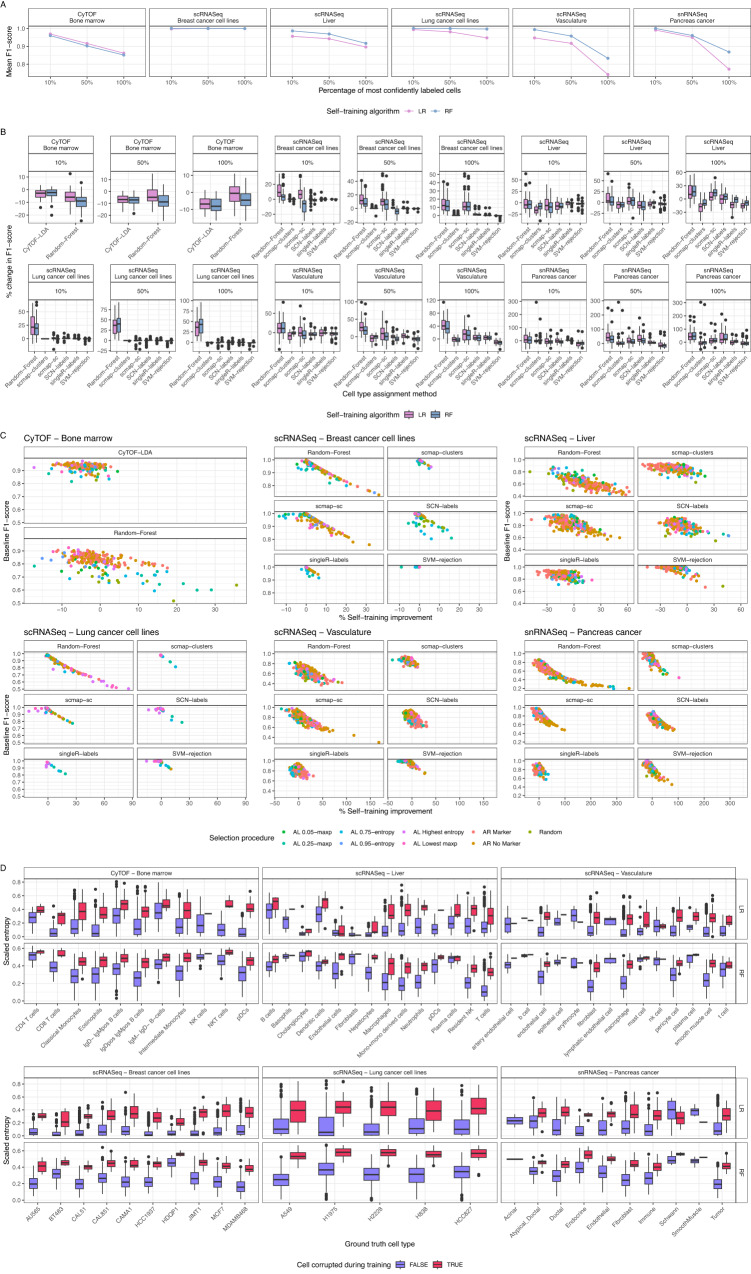
Fig. 5 Self-training can increase performance of some cell type assignment algorithms. A F1-score of each self-training algorithm for each cohort decreases as a larger set of predictively-labeled cells are included. The x-axis shows the percent of cells with highest confidence of the overall dataset that were labeled using the self-training method. The initial set of training cells were picked using active learning. B Overall improvement in F1-score when including cells labeled using self-training relative to the baseline accuracy (only training on the cells labeled with ground truth values). Shown are the results using an initial training set of 100 cells that were selected using active learning and a self-training strategy. The percentage specifies the percent of most confident cells that are self-labeled. C Correlation between self-training improvement and original performance. D Entropy of all cells represented in the randomly selected 250 cell training datasets shown for each of the 10 train splits. The x-axis denotes the ground truth cell type, while each boxplot is colored by whether the cell was corrupted to a different cell type. Like Fig. 4, because entropy is bounded by the total number of classes, the entropy values depicted were scaled by the maximum possible value for each experiment. All boxplots depict the median as the center line, the boxes define interquartile range (IQR), the whiskers extend up to 1.5 times the IQR and all points depict outliers from this range. Source data are provided on zenodo: 10.5281/zenodo.10403475.
Fig. 5 Self-training can increase performance of some cell type assignment algorithms. A F1-score of each self-training algorithm for each cohort decreases as a larger set of predictively-labeled cells are included. The x-axis shows the percent of cells with highest confidence of the overall dataset that were labeled using the self-training method. The initial set of training cells were picked using active learning. B Overall improvement in F1-score when including cells labeled using self-training relative to the baseline accuracy (only training on the cells labeled with ground truth values). Shown are the results using an initial training set of 100 cells that were selected using active learning and a self-training strategy. The percentage specifies the percent of most confident cells that are self-labeled. C Correlation between self-training improvement and original performance. D Entropy of all cells represented in the randomly selected 250 cell training datasets shown for each of the 10 train splits. The x-axis denotes the ground truth cell type, while each boxplot is colored by whether the cell was corrupted to a different cell type. Like Fig. 4, because entropy is bounded by the total number of classes, the entropy values depicted were scaled by the maximum possible value for each experiment. All boxplots depict the median as the center line, the boxes define interquartile range (IQR), the whiskers extend up to 1.5 times the IQR and all points depict outliers from this range. Source data are provided on zenodo: 10.5281/zenodo.10403475.CC BY · PubMed Central
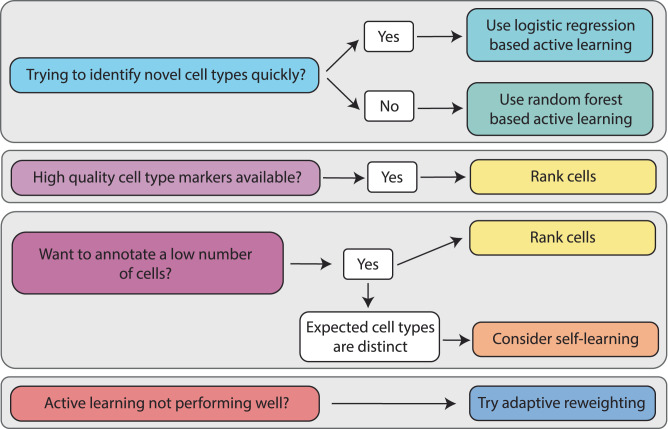
Fig. 6 Recommendations for practitioners. A set of instructions outlining the criteria based on which practitioners should decide which cell type selection method to choose to aid in machine-learning based efficient annotation. The choice will heavily depend on the amount of prior knowledge available to the user in the form of possible cell type markers, dataset imbalance and the number of cells a user wishes to annotate.
Fig. 6 Recommendations for practitioners. A set of instructions outlining the criteria based on which practitioners should decide which cell type selection method to choose to aid in machine-learning based efficient annotation. The choice will heavily depend on the amount of prior knowledge available to the user in the form of possible cell type markers, dataset imbalance and the number of cells a user wishes to annotate.CC BY · PubMed Central

Verification

Claims the paper makes

The claims and statistics of this paper haven’t been checked yet.

Run the check — free, no account needed. It reads the open-access text and checks the sources it cites.

A few free checks a day · papers already verified open instantly · results are public

Self-check

Percentages, sums and reported differences re-computed from the paper’s own numbers.

The self-check needs the paper’s full text.

Citations

Cites

Show all 1 references

Research works printed but not linked: 47

  1. Jovic, D. et al. Single-cell RNA sequencing technologies and applications: A brief overview. Clin. Transl. Med. 12, e694 (2022). · DOI
  2. Ge, G. et al. Single-Cell RNA-seq Reveals a Developmental Hierarchy Super-Imposed Over Subclonal Evolution in the Cellular Ecosystem of Prostate Cancer. Adv. Sci. 9, e2105530 (2022). · DOI
  3. 10.1038/nature13173 · DOI · Paper page
  4. 10.1038/nature20123 · DOI
  5. 10.1182/blood-2016-05-716480 · DOI · Paper page
  6. 10.1038/s41586-018-0394-6 · DOI · Paper page
  7. Tracey, L. J. , An, Y. & Justice, M. J. CyTOF: An Emerging Technology for Single-Cell Proteomics in the Mouse. Curr Protoc 1, e118 (2021). · DOI
  8. 10.1038/nmeth.2869 · DOI · Paper page
  9. 2020, The single-cell pathology landscape of breast cancer, Nature, 578, 615, 10.1038/s41586-019-1876-x · DOI
  10. Luecken, M. D. & Theis, F. J . Current best practices in single-cell RNA-seq analysis: a tutorial. Mol. Syst. Biol. 15, e8746 (2019). · DOI · Paper page
  11. 10.1007/s00412-018-0659-8 · DOI · Paper page
  12. Zappia, L. , Phipson, B. & Oshlack, A . Exploring the single-cell RNA-seq analysis landscape with the scRNA-tools database. PLoS Comput. Biol. 14, e1006245 (2018). · DOI
  13. 10.1016/J.CELL.2021.04.048 · DOI · Paper page
  14. 10.1038/s41598-019-41695-z · DOI · Paper page
  15. 10.1038/nmeth.4463 · DOI · Paper page
  16. 10.1016/j.csbj.2021.06.043 · DOI · Paper page
  17. 10.1038/s41374-021-00639-w · DOI
  18. 2021, Automated assignment of cell identity from single-cell multiplexed imaging and proteomic data, Cell Syst, 12, 1173, 10.1016/j.cels.2021.08.012 · DOI
  19. 2019, Supervised clustering for single-cell analysis, Nat. Methods, 16, 965, 10.1038/s41592-019-0534-4 · DOI
  20. 10.21203/rs.2.10442/v1 · DOI
  21. 2017, Automated cell type discovery and classification through knowledge transfer, Bioinformatics, 33, 1689, 10.1093/bioinformatics/btx054 · DOI
  22. 10.1038/nmeth.4644 · DOI
  23. 10.1038/s41590-018-0276-y · DOI · Paper page
  24. 2019, Predicting Cell Populations in Single Cell Mass Cytometry Data, Cytometry A, 95, 769, 10.1002/cyto.a.23738 · DOI
  25. Eyler, C. E. et al. Single-cell lineage analysis reveals genetic and epigenetic interplay in glioblastoma drug resistance. Genome Biol. 21, 174 (2020). · DOI
  26. 10.1101/gr.273300.120 · DOI
  27. 10.1038/s41586-020-2536-x · DOI
  28. 2023, CASSL: A cell-type annotation method for single cell transcriptomics data using semi-supervised learning, Applied Intelligence, 53, 1287, 10.1007/s10489-022-03440-4 · DOI
  29. 10.1093/bioinformatics/btab286 · DOI
  30. Dong, J. , Zhang, Y. & Wang, F . scSemiAE: a deep model with semi-supervised learning for single-cell transcriptomics. BMC Bioinformatics 23, 161 (2022). · DOI
  31. 2022, scBERT as a large-scale pretrained deep language model for cell type annotation of single-cell RNA-seq data, Nature Machine Intelligence, 4, 852, 10.1038/s42256-022-00534-z · DOI · Paper page
  32. 2022, A single-cell analysis of breast cancer cell lines to study tumour heterogeneity and drug response, Nat. Commun, 13, 1714, 10.1038/s41467-022-29358-6 · DOI
  33. 10.1038/s41588-022-01134-8 · DOI · Paper page
  34. 2016, Automated mapping of phenotype space with single-cell data, Nat. Methods, 13, 493, 10.1038/nmeth.3863 · DOI
  35. 10.1038/nmeth.4236 · DOI · Paper page
  36. Hein, A. et al. A Comparison of Uncertainty Quantification Methods for Active Learning in Image Classification. in 2022 International Joint Conference on Neural Networks (IJCNN) 1–8 (2022). · DOI
  37. 2021, Benchmarking Computational Doublet-Detection Methods for Single-Cell RNA Sequencing Data, Cell Syst, 12, 176, 10.1016/j.cels.2020.11.008 · DOI · Paper page
  38. 10.1038/s41587-020-0465-8 · DOI · Paper page
  39. Zhu, J. & Hovy, E. Active Learning for Word Sense Disambiguation with Methods for Addressing the Class Imbalance Problem. in Proceedings of the 2007 Joint Conference on Empirical Methods in Natural Language Processing and Computational Natural Language Learning (EMNLP-CoNLL) 783–790 (Association for Computational Linguistics, 2007).
  40. Bloodgood, M. & Vijay-Shanker, K. Taking into Account the Differences between Actively and Passively Acquired Data: The Case of Active Learning with Support Vector Machines for Imbalanced Datasets. arXiv [cs.LG] (2014).
  41. Blagus, R. & Lusa, L . Class prediction for high-dimensional class-imbalanced data. BMC Bioinformatics 11, 523 (2010). · DOI
  42. 2015, Self-labeled techniques for semi-supervised learning: taxonomy, software and empirical study, Knowl. Inf. Syst, 42, 245, 10.1007/s10115-013-0706-y · DOI
  43. 2016, A step-by-step workflow for low-level analysis of single-cell RNA-seq data with Bioconductor, F1000Res, 5, 2122
  44. 2019, HDCytoData: Collection of high-dimensional cytometry benchmark datasets in Bioconductor object formats, F1000Res, 8, 1459, 10.12688/f1000research.20210.2 · DOI
  45. 10.1093/bioinformatics/btw777 · DOI · Paper page
  46. 10.18637/jss.v028.i05 · DOI · Paper page
  47. 10.1109/JSTSP.2011.2139193 · DOI

Metadata

Authors
Geuenich, M. J., Gong, D.-W., & Campbell, K. R.
Affiliations
  • University of Toronto (CA)
  • Lunenfeld-Tanenbaum Research Institute (CA)
  • Ontario Institute for Cancer Research (CA)
Corresponding author
  • Geuenich, Michael J.
  • Campbell, Kieran R.
Venue
Nature Communications
Publisher
openRxiv
Published
2023-06-14
Volume
15
Issue
1
Pages
1014-1014
ISSN
2041-1723 (ISSN-L)
OpenAlex
W4391512208
Cited by
14
References
1
Citations by year
2026: 2 · 2025: 4 · 2024: 6 · 2023: 2
FWCI
1.63
Type
journal article
Language
en
Open access
Licence
cc-by
Locations
  • Nature Communications (publishedVersion, cc-by)
  • bioRxiv (Cold Spring Harbor Laboratory) (acceptedVersion, cc-by-nc-nd)
  • PubMed Central (publishedVersion, cc-by)
  • PubMed (publishedVersion)
  • RePEc: Research Papers in Economics (submittedVersion)
  • DOAJ (DOAJ: Directory of Open Access Journals) (submittedVersion, cc-by-sa)
Funders
  • Princess Margaret Cancer Foundation
  • Canada Research Chairs
  • Canadian Institutes of Health Research (PJT175270)
  • Natural Sciences and Engineering Research Council of Canada (RGPIN 2020, rgpin-2020-04083)
Topics
  • Life Sciences › Biochemistry, Genetics and Molecular Biology › Molecular Biology › Single-cell and spatial transcriptomics
  • Life Sciences › Biochemistry, Genetics and Molecular Biology › Biophysics › Cell Image Analysis Techniques
  • Life Sciences › Biochemistry, Genetics and Molecular Biology › Molecular Biology › Gene expression and cancer classification
Keywords
cell type annotation, active learning (machine learning), self-supervised learning, label budget, single-cell gene expression, cell type markers
MeSH terms
Machine Learning, Supervised Machine Learning, Algorithms, Awareness, Technology, Single-Cell Analysis

About these checks

Registry, retraction, Cites and statistics results are computed, not judged, with one exception: a printed reference that no index lists is read once by a model before it counts as a citation error. Claims are extracted by a model and kept only when their quote appears verbatim in the text; each cited source is then checked, with a model’s help, for whether it says what the claim relies on. Those verdicts can be wrong — read the claim’s quote and the cited source before relying on one.

Statistics and arithmetic are recomputed, not judged.

Confidence bands are shown only for fields calibrated on our annotated test set. None is calibrated yet, so no band is shown.

What counts as a claim ›How we measure confidence ›How we check this ›

Are you an author, or do you see a problem with this page? Request a review

How to cite

Cite CoChat for the checks on this page, and the paper for its own findings.

This page
CoChat. (2026). Citation check: The impacts of active and self-supervised learning on efficient annotation of single-cell expression data. https://app.cochat.ai/papers/10.1101/2023.06.13.544850
The paper
Geuenich, M. J., Gong, D.-W., & Campbell, K. R. (2023). The impacts of active and self-supervised learning on efficient annotation of single-cell expression data. Nature Communications. https://doi.org/10.1101/2023.06.13.544850