PreprintCited by 34Mitochondrial Function and PathologyHeat shock proteins researchAutophagy in Disease and Therapy

The DOI matches its Crossref record; 1 of the 1 references it cites were found in a registry or an index.

Triaging of ⍺-helical proteins to the mitochondrial outer membrane by distinct chaperone machinery based on substrate topology

Open access

Preprint — published as 10.1016/j.molcel.2024.01.028 · Paper page

Abstract

SUMMARY: Mitochondrial outer membrane ⍺-helical proteins play critical roles in mitochondrial-cytoplasmic communication, but the rules governing the targeting and insertion of these biophysically diverse substrates remain unknown. Here, we first defined the complement of required mammalian biogenesis machinery through genome-wide CRISPRi screens using topologically distinct membrane proteins. Systematic analysis of nine identified factors across 21 diverse ⍺-helical substrates reveals that these components are organized into distinct targeting pathways which act on substrates based on their topology. NAC is required for efficient targeting of polytopic proteins whereas signal-anchored proteins require TTC1, a novel cytosolic chaperone which physically engages substrates. Biochemical and mutational studies reveal that TTC1 employs a conserved TPR domain and a hydrophobic groove in its C-terminal domain to support substrate solubilization and insertion into mitochondria. Thus, targeting of diverse mitochondrial membrane proteins is achieved through topological triaging in the cytosol using principles with similarities to ER membrane protein biogenesis systems.

Overview

The claims and statistics of this paper haven’t been checked yet.

Run the check — free, no account needed. It reads the open-access text and checks the sources it cites.

A few free checks a day · papers already verified open instantly · results are public

Integrity signals

Registry

Crossref · 10.1101/2023.08.16.553624

Cites

1 of 1 references verified0 citation errors · 0 not checkable

Statistics

Figures

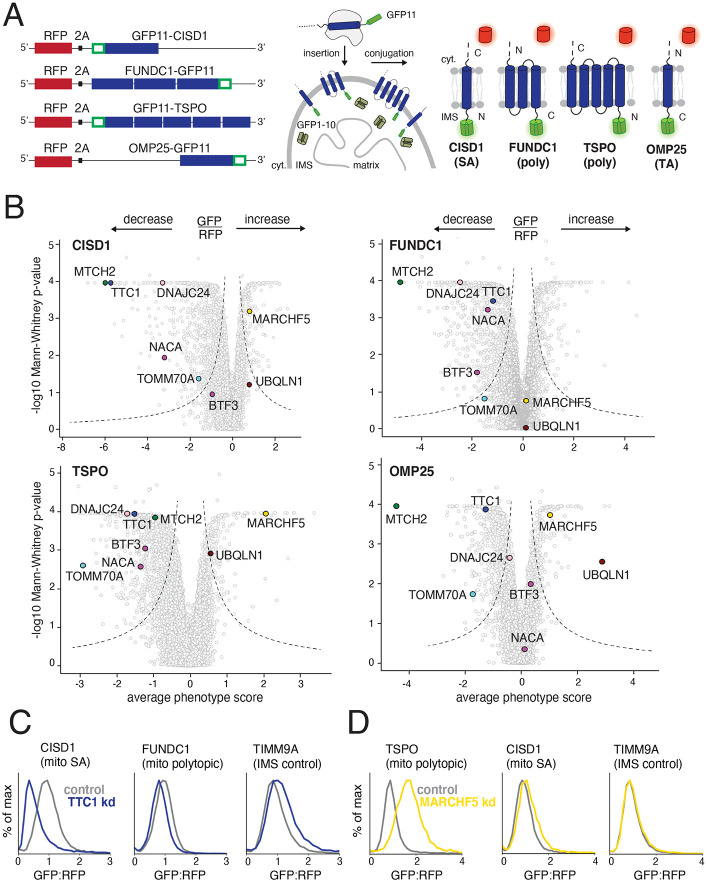
Figure 1. Identifying factors required for the biogenesis of topologically distinct α-helical mitochondrial outer membrane proteins. (A) The insertion of α-helical mitochondrial outer membrane proteins of diverse topologies (SA: signal-anchored, poly: polytopic and TA: tail-anchored) was queried using a split GFP reporter system. GFP11-fused reporters were expressed in a K562 cell line constitutively expressing GFP1-10 in the intermembrane space (IMS) such that insertion in the correct topology would result in complementation and GFP fluorescence. RFP (red fluorescent protein) separated by a viral P2A acts as a translation normalization marker. (B) Volcano plots of the GFP:RFP stabilization phenotype for the three strongest sgRNAs and Mann-Whitney p-values for the genome-wide CRISPRi FACS screens (two independent replicates each) for the four reporters in (A). Each gene is indicated by a gray dot, with specific genes of interest that either decrease or increase the GFP:RFP ratio highlighted across all four screens. The OMP25 screen was conducted in a previous study with identical screening conditions and is replotted to allow for direct comparison (Guna et. al, 2022). (C) Integration of the indicated GFP11-fused reporters in K562 cell lines expressing IMS GFP1-10 in the presence of a non-targeting (control) sgRNA or sgRNAs targeting TTC1 or (D) MARCHF5. TIMM9A is an IMS control reporter. Flow data was normalized based on the GFP:RFP ratio and plotted as histograms. See Figures S1 and S2.
Figure 1. Identifying factors required for the biogenesis of topologically distinct α-helical mitochondrial outer membrane proteins. (A) The insertion of α-helical mitochondrial outer membrane proteins of diverse topologies (SA: signal-anchored, poly: polytopic and TA: tail-anchored) was queried using a split GFP reporter system. GFP11-fused reporters were expressed in a K562 cell line constitutively expressing GFP1-10 in the intermembrane space (IMS) such that insertion in the correct topology would result in complementation and GFP fluorescence. RFP (red fluorescent protein) separated by a viral P2A acts as a translation normalization marker. (B) Volcano plots of the GFP:RFP stabilization phenotype for the three strongest sgRNAs and Mann-Whitney p-values for the genome-wide CRISPRi FACS screens (two independent replicates each) for the four reporters in (A). Each gene is indicated by a gray dot, with specific genes of interest that either decrease or increase the GFP:RFP ratio highlighted across all four screens. The OMP25 screen was conducted in a previous study with identical screening conditions and is replotted to allow for direct comparison (Guna et. al, 2022). (C) Integration of the indicated GFP11-fused reporters in K562 cell lines expressing IMS GFP1-10 in the presence of a non-targeting (control) sgRNA or sgRNAs targeting TTC1 or (D) MARCHF5. TIMM9A is an IMS control reporter. Flow data was normalized based on the GFP:RFP ratio and plotted as histograms. See Figures S1 and S2.CC BY-NC-ND · PubMed Central
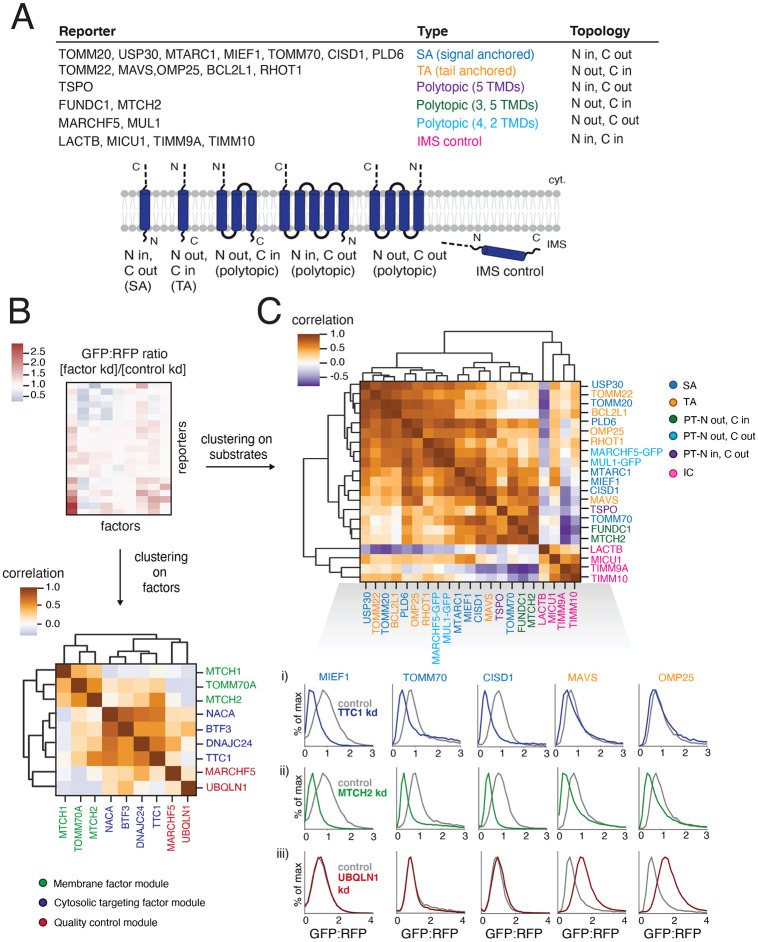
Figure 2. Systematically exploring pathways affecting the biogenesis of diverse α-helical mitochondrial outer membrane proteins (A) Table describing a comprehensive set of α-helical outer membrane proteins used as reporters to query the specificity of hits (highlighted in Figure 1B) derived from the genome-wide CRISPRi screens. Type and topology of each protein is stated and depicted. IMS control reporters were also included (for a total of 21 substrates assayed). ‘LACTB’ and ‘MICU1’ indicate just the respective targeting sequence fused to GFP11. For proteins with both termini in the cytosol (MUL1 and MARCHF5) and therefore incompatible with the split GFP system, full-length GFP was fused to the C-termini. (B) To analyze the effects of factors of interest on α-helical proteins of different topologies, each reporter in (A) was expressed in K562 ZIM3 CRISPRi cells constitutively expressing IMS GFP1-10 and a sgRNA guide against the factor or a non-targeting control and analyzed by flow cytometry. The GFP:RFP ratios were then normalized to the non-targeting control ratios to generate a comprehensive dataset represented as a heatmap (see Figure S3A for details). Hierarchical clustering of the correlation matrix of all factors results in the assignment of putative biogenesis pathways. (C) Clustering of the correlation matrix of all reporters assigns outer membrane reporters into clusters largely defined by type and topology. Individual histograms showing GFP:RFP changes in response to factor depletion that are predictive of SA and TA reporter clustering patterns are shown here: i) responses to TTC1 depletion, ii) responses to MTCH2 depletion, iii) responses to UBQLN1 depletion. See Figure S3 for complete reporter GFP:RFP changes (for all factors). See Figures S3 and S4.
Figure 2. Systematically exploring pathways affecting the biogenesis of diverse α-helical mitochondrial outer membrane proteins (A) Table describing a comprehensive set of α-helical outer membrane proteins used as reporters to query the specificity of hits (highlighted in Figure 1B) derived from the genome-wide CRISPRi screens. Type and topology of each protein is stated and depicted. IMS control reporters were also included (for a total of 21 substrates assayed). ‘LACTB’ and ‘MICU1’ indicate just the respective targeting sequence fused to GFP11. For proteins with both termini in the cytosol (MUL1 and MARCHF5) and therefore incompatible with the split GFP system, full-length GFP was fused to the C-termini. (B) To analyze the effects of factors of interest on α-helical proteins of different topologies, each reporter in (A) was expressed in K562 ZIM3 CRISPRi cells constitutively expressing IMS GFP1-10 and a sgRNA guide against the factor or a non-targeting control and analyzed by flow cytometry. The GFP:RFP ratios were then normalized to the non-targeting control ratios to generate a comprehensive dataset represented as a heatmap (see Figure S3A for details). Hierarchical clustering of the correlation matrix of all factors results in the assignment of putative biogenesis pathways. (C) Clustering of the correlation matrix of all reporters assigns outer membrane reporters into clusters largely defined by type and topology. Individual histograms showing GFP:RFP changes in response to factor depletion that are predictive of SA and TA reporter clustering patterns are shown here: i) responses to TTC1 depletion, ii) responses to MTCH2 depletion, iii) responses to UBQLN1 depletion. See Figure S3 for complete reporter GFP:RFP changes (for all factors). See Figures S3 and S4.CC BY-NC-ND · PubMed Central
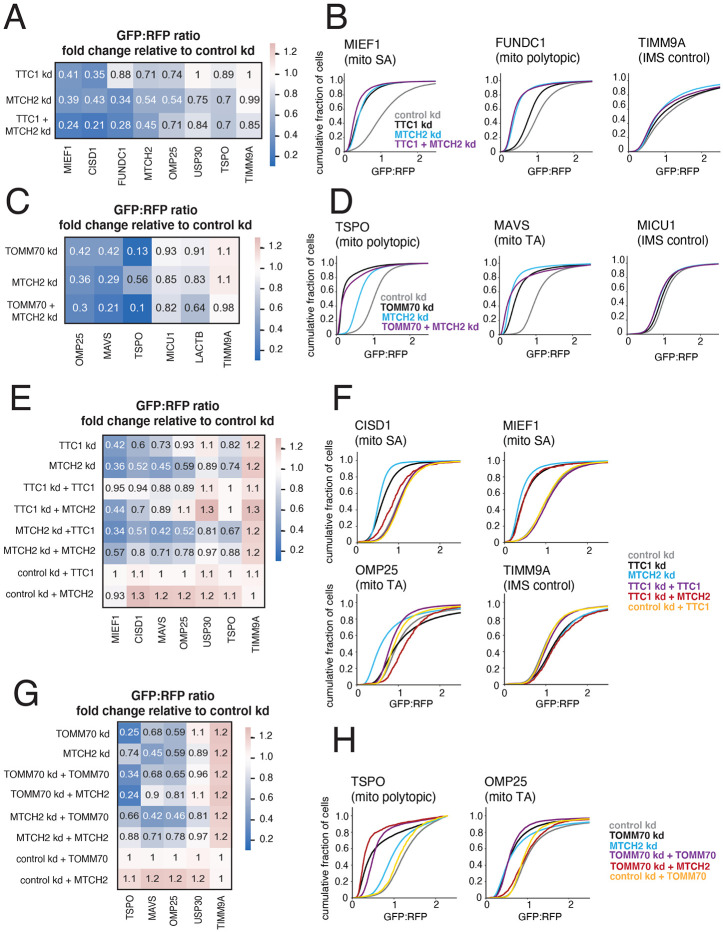
Figure 3. TTC1 and TOMM70 exert effects on α-helical membrane protein integration independent of their effects on the MTCH2 insertase (A) Arrayed dual guides were used to assess the genetic interaction of TTC1 and MTCH2 by monitoring outer membrane integration of GFP11-fused α-helical reporters dependent on TTC1 and MTCH2 (MIEF1, CISD1, MTCH2), MTCH2 alone (USP30, FUNDC1, OMP25) and neither (TSPO, TIMM9A) (dependencies noted from Figure S3A). Reporters were expressed in K562 ZIM3 CRISPRi IMS GFP1-10 cells and i) sgRNAs targeting TTC1 and MTCH2, ii) sgRNAs targeting TTC1 and a non-targeting control, iii) sgRNAs targeting MTCH2 and a non-targeting control. Data is represented as a heatmap colored by the fold change in reporter integration (GFP:RFP ratio) for each condition relative to cells expressing a non-targeting sgRNA. (B) Flow data for representative reporters from (A) plotted as cdf (cumulative distribution function) plots. (C) The genetic interaction of TOMM70A and MTCH2 was assessed in a similar manner to (A) with reporters dependent on TOMM70A and MTCH2 (OMP25, MAVS), TOMM70A alone (TSPO) and neither (MICU1, LACTB, TIMM9A). As in (A), dependencies are noted from arrayed screen results in Figure S3A. (D) Flow data for representative reporters from (C) plotted as cdf plots. (E) To determine the extent to which TTC1 biogenesis defects are a secondary consequence of MTCH2 loss, outer membrane integration of GFP11-fused α-helical reporters was measured in K562 IMS GFP1-10 cells constitutively expressing a sgRNA against TTC1 and i) exogenous 3xFLAG-tagged TTC1 in a cassette with a BFP translation marker, ii) exogenous MTCH2 with a BFP translation marker and iii) BFP alone. Reporter integration was measured with the same conditions for cells expressing sgRNAs targeting MTCH2 and non-targeting sgRNAs (control). Data is represented as a heatmap colored in the same manner as (A) and (C). (F) Flow data for representative reporters from (E) plotted as cdf plots. (G) The extent to which TOMM70A biogenesis defects are a secondary consequence of MTCH2 loss is assessed in the same manner as (E). (H) Flow data for representative reporters from (E) plotted as cdf plots. See Figure S5.
Figure 3. TTC1 and TOMM70 exert effects on α-helical membrane protein integration independent of their effects on the MTCH2 insertase (A) Arrayed dual guides were used to assess the genetic interaction of TTC1 and MTCH2 by monitoring outer membrane integration of GFP11-fused α-helical reporters dependent on TTC1 and MTCH2 (MIEF1, CISD1, MTCH2), MTCH2 alone (USP30, FUNDC1, OMP25) and neither (TSPO, TIMM9A) (dependencies noted from Figure S3A). Reporters were expressed in K562 ZIM3 CRISPRi IMS GFP1-10 cells and i) sgRNAs targeting TTC1 and MTCH2, ii) sgRNAs targeting TTC1 and a non-targeting control, iii) sgRNAs targeting MTCH2 and a non-targeting control. Data is represented as a heatmap colored by the fold change in reporter integration (GFP:RFP ratio) for each condition relative to cells expressing a non-targeting sgRNA. (B) Flow data for representative reporters from (A) plotted as cdf (cumulative distribution function) plots. (C) The genetic interaction of TOMM70A and MTCH2 was assessed in a similar manner to (A) with reporters dependent on TOMM70A and MTCH2 (OMP25, MAVS), TOMM70A alone (TSPO) and neither (MICU1, LACTB, TIMM9A). As in (A), dependencies are noted from arrayed screen results in Figure S3A. (D) Flow data for representative reporters from (C) plotted as cdf plots. (E) To determine the extent to which TTC1 biogenesis defects are a secondary consequence of MTCH2 loss, outer membrane integration of GFP11-fused α-helical reporters was measured in K562 IMS GFP1-10 cells constitutively expressing a sgRNA against TTC1 and i) exogenous 3xFLAG-tagged TTC1 in a cassette with a BFP translation marker, ii) exogenous MTCH2 with a BFP translation marker and iii) BFP alone. Reporter integration was measured with the same conditions for cells expressing sgRNAs targeting MTCH2 and non-targeting sgRNAs (control). Data is represented as a heatmap colored in the same manner as (A) and (C). (F) Flow data for representative reporters from (E) plotted as cdf plots. (G) The extent to which TOMM70A biogenesis defects are a secondary consequence of MTCH2 loss is assessed in the same manner as (E). (H) Flow data for representative reporters from (E) plotted as cdf plots. See Figure S5.CC BY-NC-ND · PubMed Central
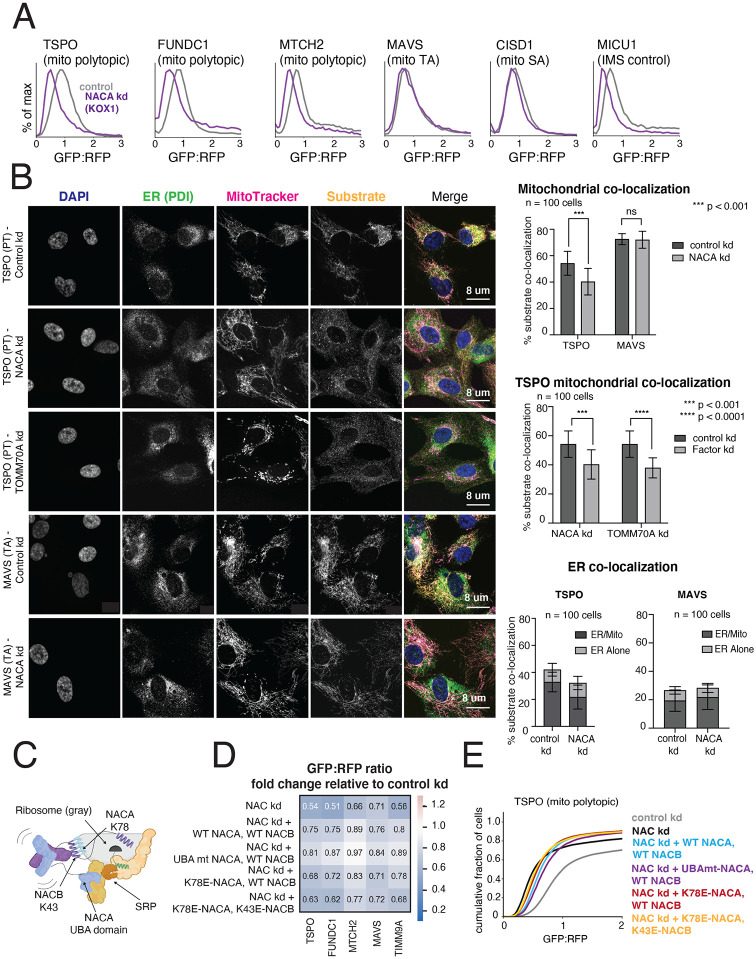
Figure 4. The NAC complex is required for the efficient delivery of polytopic α-helical proteins to the mitochondrial outer membrane (A) Integration of indicated GFP11-fused SA, TA, polytopic and IMS control reporters in K562 KOX1 CRISPRi cells constitutively expressing IMS GFP1-10 and either a sgRNA targeting NACα or a non-targeting sgRNA (control). (B) (Left) Changes in localization of endogenous TSPO (polytopic) and MAVS (TA) were assessed using immunostaining and confocal microscopy in RPE1 ZIM3 CRISPRi cells expressing sgRNAs targeting NACα, TOMM70 or a non-targeting control. Merge colors: Blue: DAPI, Green: ER, Yellow: Substrate, Magenta: MitoTracker. (Right) Quantification of endogenous substrates co-localized to MitoTracker (mitochondrial marker) and PDI (ER marker) were measured and plotted (see Methods for details). Quantification of substrates co-localized to the ER were split into i) percent co-localized to ER/MitoTracker overlapping regions and ii) percent co-localized to the rest of the ER (‘ER alone’) (see FIgure S6D). For more detailed substrate localization analysis across all conditions, see Figures S6C-F. Error bars show mean ± SD of 100 cells. Statistical significance was evaluated by multiple unpaired t-tests with the Holm-Sidak multiple test correction. ***, p < 0.001. ****, p < 0.0001. ns (non-significant), p > 0.05. (C) Model of a translating ribosome engaging NAC and SRP. NACα (blue) and NACβ (purple) interact with the ribosome (gray) through electrostatic interactions mediated by the indicated lysine residues (NACα K78 and NACβ K43). SRP is recruited to the ribosome through electrostatic interactions with the UBA domain of NACα (at residues D205 and N208), where it engages the substrate nascent chain (green) co-translationally. (D) The effects of ribosome-binding mutants of NACα and NACβ (K78E and K43E respectively) and a UBA-domain binding mutant of NACα (D205R + N208R) on integration of select GFP11-fused reporters in K562 KOX1 CRISPRi IMS GFP1-10 cells was tested using a similar strategy as in Figures 3E and 3G. Both members of the NAC complex were simultaneously depleted using CRISPRi and abilities of exogenous wild-type (WT) and mutant versions of NACα and NACβ to rescue reporter integration defects were assessed. Rescue constructs are in a cassette with a BFP translation marker. Data is represented as a heatmap colored by the effects of exogenous additions of NACα and NACβ (WT and mutant versions as indicated) on reporter integration in the mitochondria relative to the control condition (non-targeting sgRNA + BFP alone, as shown in Figures 3E and 3G). (E) Flow cytometry data for polytopic reporter TSPO across all conditions shown in (D) represented as a cdf plot. See Figures S6 and S7.
Figure 4. The NAC complex is required for the efficient delivery of polytopic α-helical proteins to the mitochondrial outer membrane (A) Integration of indicated GFP11-fused SA, TA, polytopic and IMS control reporters in K562 KOX1 CRISPRi cells constitutively expressing IMS GFP1-10 and either a sgRNA targeting NACα or a non-targeting sgRNA (control). (B) (Left) Changes in localization of endogenous TSPO (polytopic) and MAVS (TA) were assessed using immunostaining and confocal microscopy in RPE1 ZIM3 CRISPRi cells expressing sgRNAs targeting NACα, TOMM70 or a non-targeting control. Merge colors: Blue: DAPI, Green: ER, Yellow: Substrate, Magenta: MitoTracker. (Right) Quantification of endogenous substrates co-localized to MitoTracker (mitochondrial marker) and PDI (ER marker) were measured and plotted (see Methods for details). Quantification of substrates co-localized to the ER were split into i) percent co-localized to ER/MitoTracker overlapping regions and ii) percent co-localized to the rest of the ER (‘ER alone’) (see FIgure S6D). For more detailed substrate localization analysis across all conditions, see Figures S6C-F. Error bars show mean ± SD of 100 cells. Statistical significance was evaluated by multiple unpaired t-tests with the Holm-Sidak multiple test correction. ***, p < 0.001. ****, p < 0.0001. ns (non-significant), p > 0.05. (C) Model of a translating ribosome engaging NAC and SRP. NACα (blue) and NACβ (purple) interact with the ribosome (gray) through electrostatic interactions mediated by the indicated lysine residues (NACα K78 and NACβ K43). SRP is recruited to the ribosome through electrostatic interactions with the UBA domain of NACα (at residues D205 and N208), where it engages the substrate nascent chain (green) co-translationally. (D) The effects of ribosome-binding mutants of NACα and NACβ (K78E and K43E respectively) and a UBA-domain binding mutant of NACα (D205R + N208R) on integration of select GFP11-fused reporters in K562 KOX1 CRISPRi IMS GFP1-10 cells was tested using a similar strategy as in Figures 3E and 3G. Both members of the NAC complex were simultaneously depleted using CRISPRi and abilities of exogenous wild-type (WT) and mutant versions of NACα and NACβ to rescue reporter integration defects were assessed. Rescue constructs are in a cassette with a BFP translation marker. Data is represented as a heatmap colored by the effects of exogenous additions of NACα and NACβ (WT and mutant versions as indicated) on reporter integration in the mitochondria relative to the control condition (non-targeting sgRNA + BFP alone, as shown in Figures 3E and 3G). (E) Flow cytometry data for polytopic reporter TSPO across all conditions shown in (D) represented as a cdf plot. See Figures S6 and S7.CC BY-NC-ND · PubMed Central
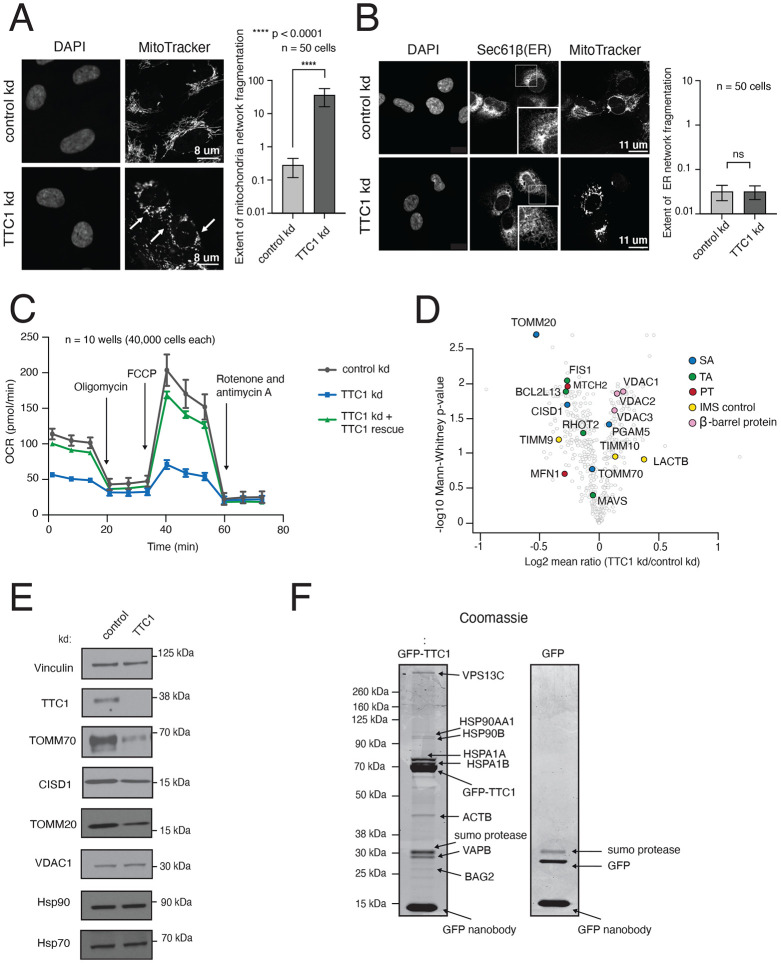
Figure 5. TTC1 is required for mitochondrial integrity and the biogenesis of endogenous outer membrane proteins (A) RPE1 ZIM3 CRISPRi cells expressing either a sgRNA targeting TTC1 or a non-targeting sgRNA were analyzed by super-resolution confocal microscopy to assess changes in mitochondrial morphology. The white arrows indicate mitochondrial fragmentation in TTC1 depleted cells. Extent of network fragmentation is calculated using the median count: area ratio of the mitochondrial network in each condition with log10 values plotted. (B) The effects of TTC1 depletion on ER morphology in RPE1 ZIM3 CRISPRi cells, assessed through immunostaining with Sec61β and calculated as in (A). For (A) and (B), error bars show mean ± SD of 50 cells. Statistical significance was evaluated using the Welch corrected unpaired t-test. ****, p < 0.0001. ns (non-significant), p > 0.05. (C) Mitochondrial respiration was assessed in K562 ZIM3 CRISPRi cells depleted of TTC1 where levels were then rescued with an exogenous copy (see Figure S10D for protein levels) using a Seahorse assay to monitor oxygen consumption rates (OCR). Arrows indicate time of drug treatment. Data are presented as average ± SD, n = 10. (D) TMT mass-spectrometry analysis of K562 KOX1 CRISPRi cells expressing guides targeting TTC1 relative to cells expressing non-targeting guides (control). Data shown here are normalized to mitochondrial proteome levels and evaluated for statistical significance across 3 biological replicates. Outer membrane proteins of interest are colored by topology. (E) Immunoblotting of endogenous proteins in K562 KOX1 CRISPRi TTC1 depleted cells and control cells (non-targeting sgRNA) using vinculin as the loading control. (F) HEK293T cells stably expressing endogenously tagged TTC1-GFP were used to identify endogenous TTC1 interaction partners. TTC1-GFP was purified under native conditions using an anti-GFP nanobody (Pleiner et al, 2020). Interaction partners were analyzed by separation through SDS-PAGE, detection with Coomassie staining and identification by mass spectrometry. As a control for non-specific interactions, HEK293T cells were transduced with GFP before purification using the GFP-nanobody and downstream analysis in the same manner. See Figure S8.
Figure 5. TTC1 is required for mitochondrial integrity and the biogenesis of endogenous outer membrane proteins (A) RPE1 ZIM3 CRISPRi cells expressing either a sgRNA targeting TTC1 or a non-targeting sgRNA were analyzed by super-resolution confocal microscopy to assess changes in mitochondrial morphology. The white arrows indicate mitochondrial fragmentation in TTC1 depleted cells. Extent of network fragmentation is calculated using the median count: area ratio of the mitochondrial network in each condition with log10 values plotted. (B) The effects of TTC1 depletion on ER morphology in RPE1 ZIM3 CRISPRi cells, assessed through immunostaining with Sec61β and calculated as in (A). For (A) and (B), error bars show mean ± SD of 50 cells. Statistical significance was evaluated using the Welch corrected unpaired t-test. ****, p < 0.0001. ns (non-significant), p > 0.05. (C) Mitochondrial respiration was assessed in K562 ZIM3 CRISPRi cells depleted of TTC1 where levels were then rescued with an exogenous copy (see Figure S10D for protein levels) using a Seahorse assay to monitor oxygen consumption rates (OCR). Arrows indicate time of drug treatment. Data are presented as average ± SD, n = 10. (D) TMT mass-spectrometry analysis of K562 KOX1 CRISPRi cells expressing guides targeting TTC1 relative to cells expressing non-targeting guides (control). Data shown here are normalized to mitochondrial proteome levels and evaluated for statistical significance across 3 biological replicates. Outer membrane proteins of interest are colored by topology. (E) Immunoblotting of endogenous proteins in K562 KOX1 CRISPRi TTC1 depleted cells and control cells (non-targeting sgRNA) using vinculin as the loading control. (F) HEK293T cells stably expressing endogenously tagged TTC1-GFP were used to identify endogenous TTC1 interaction partners. TTC1-GFP was purified under native conditions using an anti-GFP nanobody (Pleiner et al, 2020). Interaction partners were analyzed by separation through SDS-PAGE, detection with Coomassie staining and identification by mass spectrometry. As a control for non-specific interactions, HEK293T cells were transduced with GFP before purification using the GFP-nanobody and downstream analysis in the same manner. See Figure S8.CC BY-NC-ND · PubMed Central
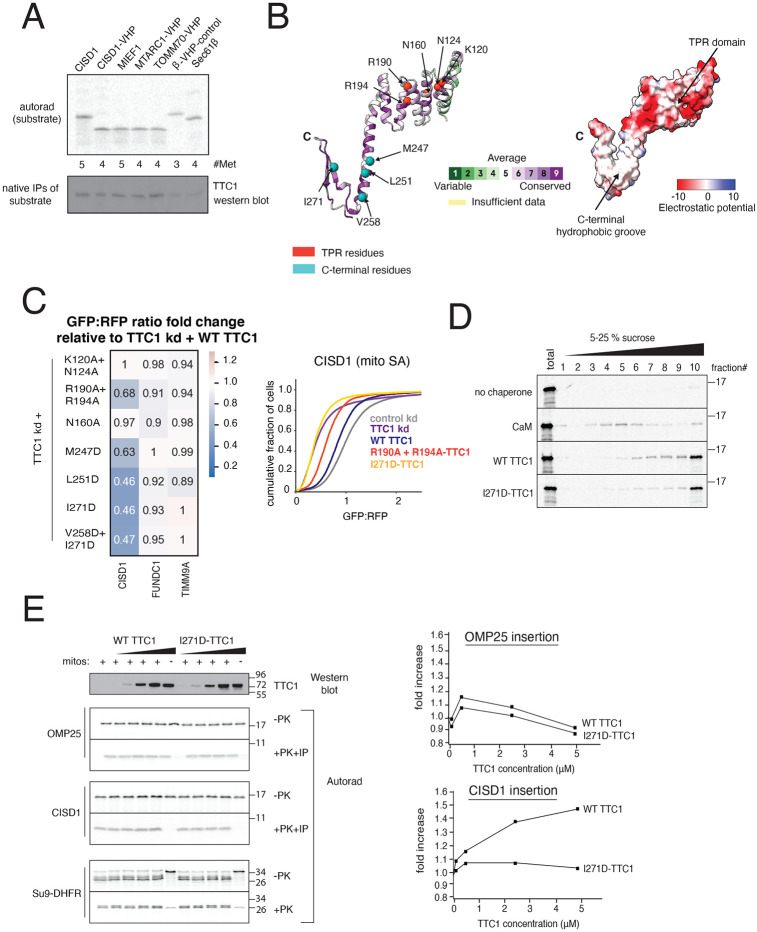
Figure 6. TTC1 chaperones nascent SA proteins and promotes insertion into mitochondria in vitro, using a C-terminal hydrophobic groove to direct biogenesis (A) Indicated substrates tagged with 3xFLAG were translated in rabbit reticulocyte lysate (RRL) in the presence of 35S and released with puromycin. Immunoprecipitation and immunoblotting show the levels of TTC1 associated with the nascent substrates. (B) AlphaFold2 model of TTC1 structure colored by i) evolutionary conservation using the ConSurf server (see Methods for details) showing high conservation in the TPR domain and the C-terminus (left) and ii) electrostatic potential indicating a hydrophobic groove at the C-terminus (right). (C) The effects of putative heat-shock binding TPR domain mutants and C-terminal point mutants (individual residues indicated in (B)) on integration of indicated GFP11-fused reporters in K562 ZIM3 CRISPRi IMS GFP1-10 cells expressing a sgRNA targeting TTC1 were assessed in a similar manner to Figure 4D. (Left) Data is represented as a heatmap colored by the fold change in reporter integration (GFP:RFP ratio) for TTC1 depleted cells expressing WT or mutant TTC1. (Right) Flow data for the effects of the R190A+R194A TPR domain and I271D C-terminal mutants on SA reporter CISD1 is plotted as a cdf plot. (D) CISD1 was translated in vitro in the presence of 35S in the PURE system in the presence of either i) no chaperone, ii) purified calmodulin, iii) purified WT TTC1, iv) purified I271D-TTC1. The translations were run on a sucrose gradient and the extent of the substrate remaining soluble was determined by autoradiography. (D) (Left) Insertion into mitochondria isolated from wild-type K562 cells of endogenous CISD1 (SA), OMP25 (TA) and Su9-DHFR translated from RRL in the presence of increasing amounts of WT TTC1 or the I271D mutant (matched concentrations). Insertion is assessed by PK (proteinase K) digestion followed by an IP of the protected 6xHis tag. (Right) Quantification of the fold increase for mitochondrial insertion of OMP25 and CISD1 stimulated by WT and I271D-TTC1. See Figures S9 and S10.
Figure 6. TTC1 chaperones nascent SA proteins and promotes insertion into mitochondria in vitro, using a C-terminal hydrophobic groove to direct biogenesis (A) Indicated substrates tagged with 3xFLAG were translated in rabbit reticulocyte lysate (RRL) in the presence of 35S and released with puromycin. Immunoprecipitation and immunoblotting show the levels of TTC1 associated with the nascent substrates. (B) AlphaFold2 model of TTC1 structure colored by i) evolutionary conservation using the ConSurf server (see Methods for details) showing high conservation in the TPR domain and the C-terminus (left) and ii) electrostatic potential indicating a hydrophobic groove at the C-terminus (right). (C) The effects of putative heat-shock binding TPR domain mutants and C-terminal point mutants (individual residues indicated in (B)) on integration of indicated GFP11-fused reporters in K562 ZIM3 CRISPRi IMS GFP1-10 cells expressing a sgRNA targeting TTC1 were assessed in a similar manner to Figure 4D. (Left) Data is represented as a heatmap colored by the fold change in reporter integration (GFP:RFP ratio) for TTC1 depleted cells expressing WT or mutant TTC1. (Right) Flow data for the effects of the R190A+R194A TPR domain and I271D C-terminal mutants on SA reporter CISD1 is plotted as a cdf plot. (D) CISD1 was translated in vitro in the presence of 35S in the PURE system in the presence of either i) no chaperone, ii) purified calmodulin, iii) purified WT TTC1, iv) purified I271D-TTC1. The translations were run on a sucrose gradient and the extent of the substrate remaining soluble was determined by autoradiography. (D) (Left) Insertion into mitochondria isolated from wild-type K562 cells of endogenous CISD1 (SA), OMP25 (TA) and Su9-DHFR translated from RRL in the presence of increasing amounts of WT TTC1 or the I271D mutant (matched concentrations). Insertion is assessed by PK (proteinase K) digestion followed by an IP of the protected 6xHis tag. (Right) Quantification of the fold increase for mitochondrial insertion of OMP25 and CISD1 stimulated by WT and I271D-TTC1. See Figures S9 and S10.CC BY-NC-ND · PubMed Central
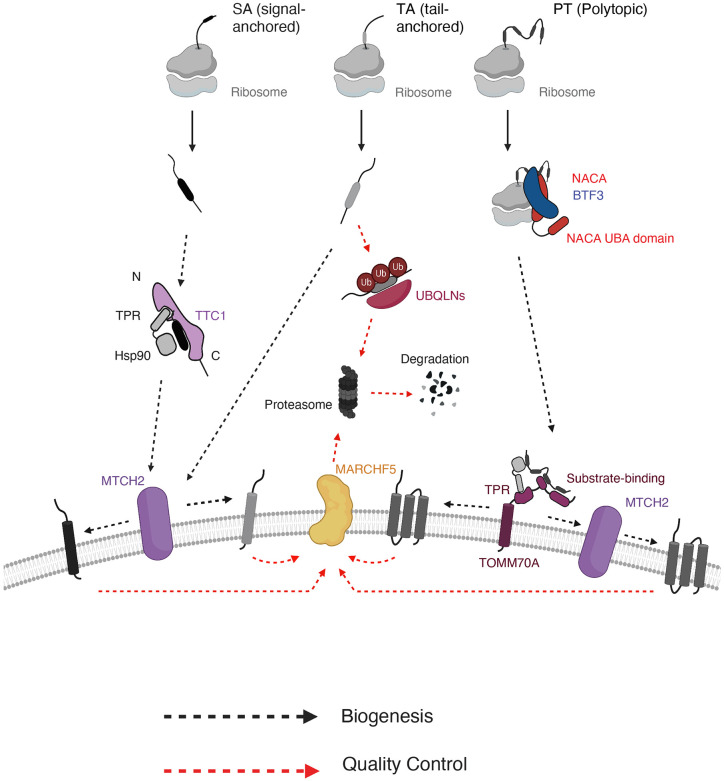
Figure 7. Working model for α-helical outer membrane protein biogenesis using multiple parallel pathways. Biogenesis pathways including cytosolic targeting, membrane insertion and quality control are depicted for three main types of α-helical outer membrane proteins (signal-anchored, tail-anchored and polytopic). Nascent outer membrane proteins are likely triaged during targeting in the cytosol, with signal-anchored proteins being targeted through cytosolic chaperone TTC1 and polytopic proteins targeted through co-translational chaperone complex NAC. Whether NAC directly engages and targets the polytopic proteins to the OMM remains to be explored. All proteins converge on MTCH1/2 insertases at the membrane for insertion, with some polytopic proteins depending more heavily on recruitment by TOMM70. Similarly, membrane-resident E3 ligase MARCHF5 handles quality control of aberrant/misfolded TMDs for substrates of all α-helical protein types, with some variation within protein type. In the cytosol, quality control processes are more divergent with tail-anchored proteins degraded using UBQLNs and no definitive pathway for other protein types.
Figure 7. Working model for α-helical outer membrane protein biogenesis using multiple parallel pathways. Biogenesis pathways including cytosolic targeting, membrane insertion and quality control are depicted for three main types of α-helical outer membrane proteins (signal-anchored, tail-anchored and polytopic). Nascent outer membrane proteins are likely triaged during targeting in the cytosol, with signal-anchored proteins being targeted through cytosolic chaperone TTC1 and polytopic proteins targeted through co-translational chaperone complex NAC. Whether NAC directly engages and targets the polytopic proteins to the OMM remains to be explored. All proteins converge on MTCH1/2 insertases at the membrane for insertion, with some polytopic proteins depending more heavily on recruitment by TOMM70. Similarly, membrane-resident E3 ligase MARCHF5 handles quality control of aberrant/misfolded TMDs for substrates of all α-helical protein types, with some variation within protein type. In the cytosol, quality control processes are more divergent with tail-anchored proteins degraded using UBQLNs and no definitive pathway for other protein types.CC BY-NC-ND · PubMed Central

Verification

Claims the paper makes

The claims and statistics of this paper haven’t been checked yet.

Run the check — free, no account needed. It reads the open-access text and checks the sources it cites.

A few free checks a day · papers already verified open instantly · results are public

Self-check

Percentages, sums and reported differences re-computed from the paper’s own numbers.

The self-check needs the paper’s full text.

Citations

Cites

Show all 1 references

Research works printed but not linked: 119

  1. 10.1111/j.1365-2796.2007.01792.x · DOI
  2. 10.1146/annurev-cellbio-100616-060439 · DOI
  3. 2022, The mechanisms of integral membrane protein biogenesis, Nat. Rev. Mol. Cell. Biol, 23, 107, 10.1038/s41580-021-00413-2 · DOI
  4. 10.1006/jmbi.2000.4315 · DOI · Paper page
  5. 10.1126/science.1113752 · DOI · Paper page
  6. 10.1038/nature06384 · DOI · Paper page
  7. 10.1146/annurev.biophys.37.032807.125904 · DOI
  8. 10.1146/annurev-cellbio-092910-154125 · DOI
  9. 10.1146/annurev.biochem.70.1.755 · DOI
  10. 10.1038/nature02342 · DOI
  11. Voorhees, R. M. and Hegde, R. S . (2015). Structures of the scanning and engaged states of the mammalian SRP-ribosome complex. eLife. https://doi.org/10.7554/ eLife.07975. · DOI
  12. 10.1016/S0092-8674(00)00028-3 · DOI
  13. Weng, T. H. , Steinchen, W. , Beatrix, B. , Berninghausen, O. , Becker, T. , Bange, G. , Cheng, J. and Beckmann, R . Architecture of the active posttranslational Sec translocon. (2021). EMBO J. 40, e105643. · DOI
  14. 10.1016/j.bbamcr.2013.02.021 · DOI
  15. 2014, Fidelity of cotranslational protein targeting by the signal recognition particle, Annu. Rev. Biophys, 43, 381, 10.1146/annurev-biophys-051013-022653 · DOI
  16. 10.1101/cshperspect.a041252 · DOI
  17. 10.1016/j.molcel.2010.08.038 · DOI
  18. 10.1016/j.cub.2018.02.004 · DOI
  19. 10.1038/nature13471 · DOI
  20. 10.1126/science.aao3099 · DOI
  21. 10.1016/j.molcel.2020.08.012 · DOI
  22. 10.1016/j.cell/2018.10.009 · DOI
  23. 2020, An intramembrane chaperone complex facilitates membrane protein biogenesis, Nature, 584, 630, 10.1038/s41586-020-2624-y · DOI
  24. 10.1016/j.molcel.2014.05.025 · DOI
  25. 10.1126/science.aah6130 · DOI
  26. McKenna, M.J. , Sim, S.I. , Ordureau, A. , Wei, L. , Harper, J.W. , Shao, S. and Park, E . (2020). The endoplasmic reticulum P5A-ATPase is a transmembrane helix dislocase. Science 369 (6511). · DOI
  27. 2019, Versatility of Preprotein Transfer from the Cytosol to Mitochondria, Trends Cell. Biol, 7, 534
  28. 2021, Mechanisms and pathways of mitochondrial outer membrane protein biogenesis, Biochem. Biophys. Acta Bioenerg, 1862, 148323, 10.1016/j.bbabio.2020.148323 · DOI
  29. 10.1016/S0092-8674(00)80691-1 · DOI
  30. 10.1073/pnas.2200158119 · DOI
  31. 10.1083/jcb.201708044 · DOI
  32. 10.1038/26780 · DOI
  33. 10.1016/j.cell.2008.01.028 · DOI
  34. 10.1038/s41586-020-03113-7 · DOI
  35. 10.1083/jcb.201102044 · DOI
  36. 10.1016/j.cell.2017.07.012 · DOI
  37. 2019, Cryo-EM structure of the mitochondrial protein-import channel TOM complex at near-atomic resolution, Nat. Struct. Mol. Biol, 12, 1158
  38. 10.1038/s41586-019-1680-7 · DOI
  39. 2020, Atomic structure of human TOM core complex, Cell Discov, 6, 67, 10.1038/s41421-020-00198-2 · DOI
  40. 10.1083/jcb.201706043 · DOI
  41. 2020, The mitochondrial import complex MIM functions as main translocase for a-helical outer membrane proteins, Cell Rep, 31, 107567, 10.1016/j.celrep.2020.107567 · DOI
  42. 10.7554/eLife.34488 · DOI
  43. 10.1126/science.add1856 · DOI
  44. 10.1074/jbc.C700107200 · DOI
  45. 10.1073/pnas.0707189104 · DOI
  46. 10.1074/jbc.M117.789800 · DOI
  47. 10.1021/bi0267487 · DOI · Paper page
  48. 10.1074/jbc.M608820200 · DOI · Paper page
  49. 10.1038/ncb2422 · DOI
  50. Jost, M., Xu, J., Yamada, J., Kampmann, M., Horlbeck, M.A., Salemi, M.R., Phinney, B.S., Weissman, J.S. and Nunnari, J., 2021, Genome-wide CRISPRi screening identifies OCIAD1 as a prohibitin client and regulatory determinant of mitochondrial Complex III assembly in human cells, Elife, 0, e67624
  51. 10.7554/eLife.19760 · DOI · Paper page
  52. 10.1083/jcb.200702143 · DOI
  53. 2020, Systematic identification of regulators of oxidative stress reveals non-canonical roles for peroxisomal import and the pentose phosphate pathway, Cell Reports, 30, 1417, 10.1016/j.celrep.2020.01.013 · DOI
  54. 10.1242/jcs.015610 · DOI
  55. 10.7554/elife.69142 · DOI
  56. 10.1016/S0092-8674(00)80830-2 · DOI · Paper page
  57. 2012, Structure and mechanistic insights into novel iron-mediated moonlighting functions of human J-protein cochaperone, Dph4. J. Biol. Chem, 287, 13194-13205
  58. 10.1038/370434a0 · DOI
  59. 10.15252/embj.2020105643 · DOI
  60. 10.1038/sj.emboj.7601249 · DOI
  61. 10.1093/jb/mvu016 · DOI
  62. 10.1016/j.molcel.2016.05.020 · DOI
  63. 10.1016/j.cell.2005.04.011 · DOI · Paper page
  64. 10.1091/mbc.E08-11-1108 · DOI
  65. van Leyen, K., Lo, E.H., Beatrix, B., Katayama, I., Jin, G. and Nakamura, T., 2009, alphaNAC depletion as an initiator of ER stress-induced apoptosis in hypoxia, Cell Death Differ, 11, 1505
  66. 2019, Dual Role of Ribosome-Binding Domain of NAC as a Potent Suppressor of Protein Aggregation and Aging-Related Proteinopathies, Mol. Cell, 74, 729, 10.1016/j.molcel.2019.03.012 · DOI
  67. 10.1126/science.abl6459 · DOI
  68. 10.1038/nature01920 · DOI
  69. 2000, bicaudal encodes the Drosophila beta NAC homolog, a component of the ribosomal translational machinery, Development, 127, 559, 10.1242/dev.127.3.559 · DOI
  70. 10.1073/pnas.92.12.5411 · DOI
  71. 10.1126/science.aaa5335 · DOI
  72. 2023, NAC controls cotranslational N-terminal methionine excision in eukaryotes, Science, 380, 1238, 10.1126/science.adg3297 · DOI
  73. 10.7554/eLife.81856 · DOI
  74. 2020, An efficient KRAB domain for CRISPRi applications in human cells, Nat. Methods, 11, 1093
  75. 10.1091/mbc.10.10.3289 · DOI
  76. 10.1074/jbc.M704201200 · DOI
  77. 10.1038/ncomms6711 · DOI
  78. 2017, αβ’-NAC cooperates with Sam37 to mediate early stages of mitochondrial protein import, FEBS J, 284, 814, 10.1111/febs.14024 · DOI
  79. 2022, Mapping information-rich genotype-phenotype landscapes with genome-scale Perturb-seq, Cell, 185, 2559, 10.1016/j.cell.2022.05.013 · DOI · Paper page
  80. 2021, The modified mitochondrial outer membrane carrier MTCH2 links mitochondrial fusion to lipogenesis, J. Cell. Biol, 220, e202103122, 10.1083/jcb.202103122 · DOI
  81. 2021, Sharma R, et. al, MitoCarta3.0: an updated mitochondrial proteome now with sub-organelle localization and pathway annotations. Nucleic Acids Res, 49, D1541-D1547
  82. 10.1038/332800a0 · DOI
  83. 1990, Mitochondrial precursor protein, Effects of 70-kilodalton heat shock protein on polypeptide folding, aggregation, and import competence. J. Biol. Chem, 265, 11069-11076
  84. 10.1016/S0092-8674(02)01250-3 · DOI · Paper page
  85. 2006, Hsp90 functions in the targeting and outer membrane translocation steps of Tom70-mediated mitochondrial import, J. Biol. Chem, 28, 33313
  86. 10.1083/jcb.201712029 · DOI
  87. 10.1126/science.abb5008 · DOI
  88. 10.1007/s12672-013-0151-0 · DOI
  89. 10.1093/nar/gki370 · DOI
  90. 10.1093/nar/gkw408 · DOI · Paper page
  91. 2023, Using evolutionary data to make sense of macromolecules with a “face-lifted” ConSurf, Protein Sci, 32, e4582, 10.1002/pro.4582 · DOI
  92. 10.1038/nature08319 · DOI
  93. 10.1126/science.1519061 · DOI
  94. 10.1016/S0092-8674(00)81418-X · DOI
  95. 10.1016/j.celrep.2021.108936 · DOI
  96. 2010, Methods Mol, Biol, 607, 11
  97. 10.1111/febs.13813 · DOI
  98. 2022, A network of cytosolic (co)chaperones promotes the biogenesis of mitochondrial signal-anchored outer membrane proteins, Elife, 11, e77706, 10.7554/eLife.77706 · DOI
  99. 10.15252/embj.201899264 · DOI
  100. 10.1016/j.cell.2013.02.003 · DOI
  101. 10.1126/science.aar3607 · DOI
  102. 10.1038/nature20169 · DOI
  103. 10.1186/s13024-020-00376-6 · DOI · Paper page
  104. 10.1111/jnc.13731 · DOI
  105. 10.1016/j.cell.2016.07.002 · DOI · Paper page
  106. 2014, Genome-Scale CRISPR-Mediated Control of Gene Repression and Activation, Cell, 159, 647-661
  107. 10.1016/j.molcel.2017.09.012 · DOI
  108. 10.1074/jbc.RA119.009432 · DOI · Paper page
  109. 2005, Protein tagging and detection with engineered self-assembling fragments of green fluorescent protein, Nat. Biotechnol, 1, 102
  110. 10.1038/ncomms11046 · DOI
  111. 10.1016/j.celrep.2020.02.084 · DOI
  112. 10.1016/j.molcel.2014.06.003 · DOI · Paper page
  113. 10.1186/s13059-017-1164-8 · DOI
  114. 10.1016/j.chroma.2014.02.029 · DOI
  115. 2019, Mapping Relative Differences in Human Salivary Gland Secretions by Dried Saliva Spot Sampling and nanoLC-MS/MS, Proteomics, 19, e1900023, 10.1002/pmic.201900023 · DOI
  116. 2007, In-gel digestion for mass spectrometric characterization of proteins and proteomes, Nat. Protocols, 1, 2856
  117. 2007, Protocol for micro-purification, enrichment, pre-fractionation and storage of peptides for proteomics using StageTips, Nat. Protocols, 2, 1896, 10.1038/nprot.2007.261 · DOI · Paper page
  118. 10.1007/978-1-60327-412-8_20 · DOI
  119. Bolte, S. and Cordelières, F.P . (2006). A guided tour into subcellular colocalization analysis in light microscopy. J. Microsc. 213–232. · DOI

Metadata

Authors
Muthukumar, G., Stevens, T. A., Inglis, A. J., Esantsi, T. K., Saunders, R. A., Schulte, F., Voorhees, R. M., Guna, A., & Weissman, J. S.
Affiliations
  • Whitehead Institute for Biomedical Research (US)
  • California Institute of Technology (US)
  • Howard Hughes Medical Institute (US)
Corresponding author
  • Guna, Alina
  • Weissman, Jonathan S.
Venue
Molecular Cell
Publisher
openRxiv
Published
2023-08-17
Volume
84
Issue
6
Pages
1101-1119.e9
ISSN
1097-2765 (ISSN-L)
OpenAlex
W4392302547
Cited by
34
References
1
Citations by year
2026: 15 · 2025: 17 · 2024: 2
FWCI
4.63
Type
journal article
Language
en
Open access
Licence
cc-by
Locations
  • Molecular Cell (publishedVersion, cc-by)
  • bioRxiv (Cold Spring Harbor Laboratory) (acceptedVersion, cc-by-nc-nd)
  • PubMed (publishedVersion)
  • PubMed Central (submittedVersion, cc-by-nc-nd)
Funders
  • Howard Hughes Medical Institute
  • Human Frontier Science Program
  • National Institutes of Health (1s10od028520-01a1)
  • National Institute of General Medical Sciences (T32GM007287)
Topics
  • Life Sciences › Biochemistry, Genetics and Molecular Biology › Molecular Biology › Mitochondrial Function and Pathology
  • Life Sciences › Biochemistry, Genetics and Molecular Biology › Molecular Biology › Heat shock proteins research
  • Life Sciences › Biochemistry, Genetics and Molecular Biology › Cell Biology › Autophagy in Disease and Therapy
Keywords
mitochondrial outer membrane, alpha-helical membrane proteins, protein targeting, protein insertion, molecular chaperones, NAC, TPR domain, polytopic membrane proteins, membrane topology, mitochondrial biogenesis, CRISPRi screen

About these checks

Registry, retraction, Cites and statistics results are computed, not judged, with one exception: a printed reference that no index lists is read once by a model before it counts as a citation error. Claims are extracted by a model and kept only when their quote appears verbatim in the text; each cited source is then checked, with a model’s help, for whether it says what the claim relies on. Those verdicts can be wrong — read the claim’s quote and the cited source before relying on one.

Statistics and arithmetic are recomputed, not judged.

Confidence bands are shown only for fields calibrated on our annotated test set. None is calibrated yet, so no band is shown.

What counts as a claim ›How we measure confidence ›How we check this ›

Are you an author, or do you see a problem with this page? Request a review

How to cite

Cite CoChat for the checks on this page, and the paper for its own findings.

This page
CoChat. (2026). Citation check: Triaging of ⍺-helical proteins to the mitochondrial outer membrane by distinct chaperone machinery based on substrate topology. https://app.cochat.ai/papers/10.1101/2023.08.16.553624
The paper
Muthukumar, G., Stevens, T. A., Inglis, A. J., Esantsi, T. K., Saunders, R. A., Schulte, F., Voorhees, R. M., Guna, A., & Weissman, J. S. (2023). Triaging of ⍺-helical proteins to the mitochondrial outer membrane by distinct chaperone machinery based on substrate topology. Molecular Cell. https://doi.org/10.1101/2023.08.16.553624