Student or educator? Sign up with your school email and get 6 months of Pro free.
PreprintCited by 1interferon and immune responsesInvertebrate Immune Response MechanismsRNA Interference and Gene Delivery

The DOI matches its Crossref record; 81 of the 81 references it cites were found in a registry or an index.

C. elegans Dicer acts with the RIG-I-like helicase DRH-1 and RDE-4 to cleave dsRNA

Open access

Preprint — published as 10.7554/elife.93979.3 · Paper page

Abstract

Abstract/Summary: Invertebrates use the endoribonuclease Dicer to cleave viral dsRNA during antiviral defense, while vertebrates use RIG-I-like Receptors (RLRs), which bind viral dsRNA to trigger an interferon response. While some invertebrate Dicers act alone during antiviral defense, C. elegans Dicer acts in a complex with a dsRNA binding protein called RDE-4, and an RLR ortholog called DRH-1. We used biochemical and structural techniques to provide mechanistic insight into how these proteins function together. We found RDE-4 is important for ATP-independent and ATP-dependent cleavage reactions, while helicase domains of both DCR-1 and DRH-1 contribute to ATP-dependent cleavage. DRH-1 plays the dominant role in ATP hydrolysis, and like mammalian RLRs, has an N-terminal domain that functions in autoinhibition. A cryo-EM structure indicates DRH-1 interacts with DCR-1’s helicase domain, suggesting this interaction relieves autoinhibition. Our study unravels the mechanistic basis of the collaboration between two helicases from typically distinct innate immune defense pathways.

Overview

The claims and statistics of this paper haven’t been checked yet.

Run the check — free, no account needed. It reads the open-access text and checks the sources it cites.

A few free checks a day · papers already verified open instantly · results are public

Integrity signals

Registry

Crossref · 10.1101/2023.09.21.558868

Cites

81 of 81 references verified0 citation errors · 0 not checkable

Statistics

Figures

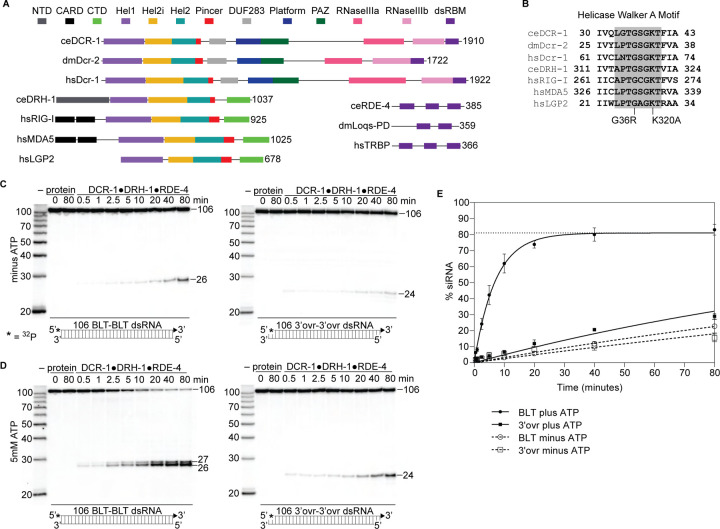
Figure 1. The C. elegans antiviral complex DCR-1•DRH-1•RDE-4 preferentially cleaves blunt dsRNA in an ATP-dependent manner. A. Colored rectangles depict conserved domains. NCBI conserved domains65, Clustal Omega Multiple Sequence Alignments66–68, and previous reports11,28,34 were used in defining domain boundaries. Numbers to right of open-reading frame indicate total amino acids in protein. Organism is indicated: ce, C. elegans; dm, Drosophila melanogaster, hs, Homo sapiens. B. Amino acids within Walker A motif (shaded) of the Hel1 subdomain with mutations indicated for DCR-1 (G36R) and DRH-1 (K320A). Number indicates the residues at the beginning and end. C. Single-turnover cleavage assays of DCR-1•DRH-1•RDE-4 (25nM) with 106 BLT or 3’ovr dsRNA (1nM) at 20°C in the absence of ATP. Sense (top) strand was 5’ 32P-end labeled (*) and contained a 2’,3’ cyclic phosphate (filled triangle in cartoon under gel) to minimize cleavage from that end (see Figure S2). Products were separated by 17% denaturing PAGE, and a representative PhosphorImage is shown (n ≥ 3). Left, marker nucleotide lengths. See also Figures S1 – S3. D. Same as C except with 5mM ATP added to the reaction. E. Quantification of single-turnover assays as in C and D with symbol key below. Data points are mean ± SD (n = 3). Dotted line indicates amplitude constraint (see Materials and methods).
Figure 1. The C. elegans antiviral complex DCR-1•DRH-1•RDE-4 preferentially cleaves blunt dsRNA in an ATP-dependent manner. A. Colored rectangles depict conserved domains. NCBI conserved domains65, Clustal Omega Multiple Sequence Alignments66–68, and previous reports11,28,34 were used in defining domain boundaries. Numbers to right of open-reading frame indicate total amino acids in protein. Organism is indicated: ce, C. elegans; dm, Drosophila melanogaster, hs, Homo sapiens. B. Amino acids within Walker A motif (shaded) of the Hel1 subdomain with mutations indicated for DCR-1 (G36R) and DRH-1 (K320A). Number indicates the residues at the beginning and end. C. Single-turnover cleavage assays of DCR-1•DRH-1•RDE-4 (25nM) with 106 BLT or 3’ovr dsRNA (1nM) at 20°C in the absence of ATP. Sense (top) strand was 5’ 32P-end labeled (*) and contained a 2’,3’ cyclic phosphate (filled triangle in cartoon under gel) to minimize cleavage from that end (see Figure S2). Products were separated by 17% denaturing PAGE, and a representative PhosphorImage is shown (n ≥ 3). Left, marker nucleotide lengths. See also Figures S1 – S3. D. Same as C except with 5mM ATP added to the reaction. E. Quantification of single-turnover assays as in C and D with symbol key below. Data points are mean ± SD (n = 3). Dotted line indicates amplitude constraint (see Materials and methods).CC BY-NC-ND · PubMed Central
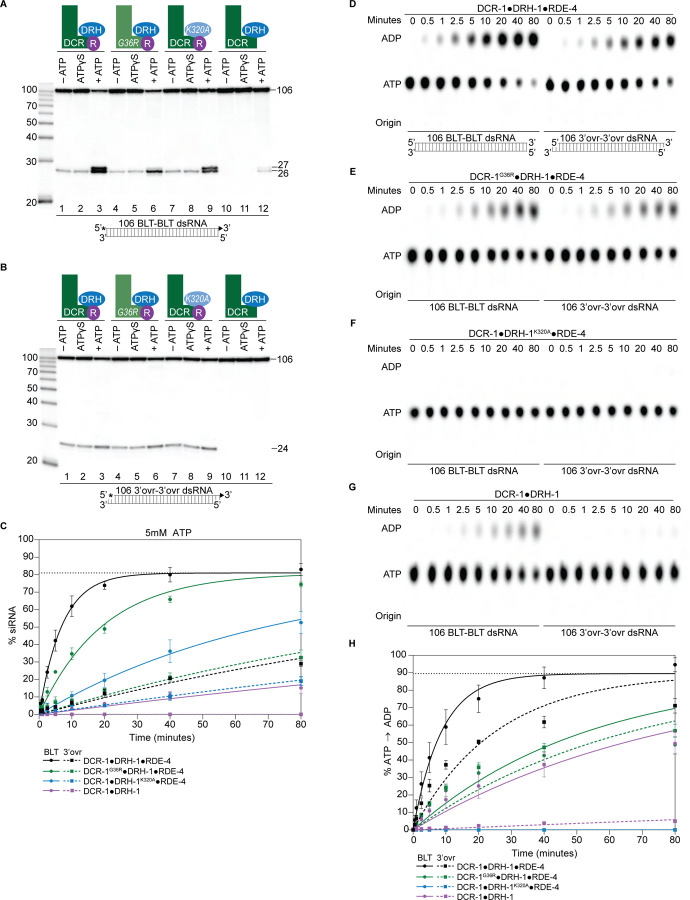
Figure 2. ATP-dependent cleavage reactions are mediated by DCR-1 and DRH-1 helicase domains, whereas RDE-4 is needed for ATP-independent and ATP-dependent cleavage reactions. A. Cartoons indicate complexes and variants, with mutations in DCR-1 (green) and DRH-1 (blue) indicated with the amino acid change, and the presence of RDE-4 (R) represented with a purple circle. Single-turnover cleavage assays of 106 BLT dsRNA (1nM) with indicated protein complex (25nM) ± 5mM ATP or ATPγS, incubated at 20°C for 60 minutes. Sense strand was 5’ 32P-end labeled (*) and contained a 2’,3’ cyclic phosphate (filled triangle in cartoon under gel) to minimize cleavage from the opposite end (see Figure S2). Products were separated by 17% denaturing PAGE, and a representative PhosphorImage is shown (n = 3). Left, marker nucleotide lengths. B. Same as A except with 106 3’ovr dsRNA (1nM). C. Quantification of single-turnover assays over time, using wildtype or variant antiviral complexes as indicated (25nM), with 106 BLT dsRNA (1nM) or 106 3’ovr dsRNA (1nM) plus 5 mM ATP. Data points are mean ± SD (n = 3). See Figure S4A – S4C for representative primary data. Plateau constrained to 81.02 (dotted line). See Materials and methods. D. DCR-1•DRH-1•RDE-4 (25nM) was incubated with 106 BLT or 3’ovr dsRNA (400nM) with 100μM α−32P-ATP at 20°C. ATP hydrolysis monitored by thin-layer chromatography (TLC), and a representative PhosphorImage is shown (n ≥ 3). Positions of origin, ATP, and ADP are indicated. See also Figure S4D – S4E. E – G. Same as D except with complexes indicated. H. Quantification of ATP hydrolysis assays as in D – G. Data points are mean ± SD (n = 3) with symbol key below graph. Plateau constrained to 89.55 (dotted line). See Materials and methods.
Figure 2. ATP-dependent cleavage reactions are mediated by DCR-1 and DRH-1 helicase domains, whereas RDE-4 is needed for ATP-independent and ATP-dependent cleavage reactions. A. Cartoons indicate complexes and variants, with mutations in DCR-1 (green) and DRH-1 (blue) indicated with the amino acid change, and the presence of RDE-4 (R) represented with a purple circle. Single-turnover cleavage assays of 106 BLT dsRNA (1nM) with indicated protein complex (25nM) ± 5mM ATP or ATPγS, incubated at 20°C for 60 minutes. Sense strand was 5’ 32P-end labeled (*) and contained a 2’,3’ cyclic phosphate (filled triangle in cartoon under gel) to minimize cleavage from the opposite end (see Figure S2). Products were separated by 17% denaturing PAGE, and a representative PhosphorImage is shown (n = 3). Left, marker nucleotide lengths. B. Same as A except with 106 3’ovr dsRNA (1nM). C. Quantification of single-turnover assays over time, using wildtype or variant antiviral complexes as indicated (25nM), with 106 BLT dsRNA (1nM) or 106 3’ovr dsRNA (1nM) plus 5 mM ATP. Data points are mean ± SD (n = 3). See Figure S4A – S4C for representative primary data. Plateau constrained to 81.02 (dotted line). See Materials and methods. D. DCR-1•DRH-1•RDE-4 (25nM) was incubated with 106 BLT or 3’ovr dsRNA (400nM) with 100μM α−32P-ATP at 20°C. ATP hydrolysis monitored by thin-layer chromatography (TLC), and a representative PhosphorImage is shown (n ≥ 3). Positions of origin, ATP, and ADP are indicated. See also Figure S4D – S4E. E – G. Same as D except with complexes indicated. H. Quantification of ATP hydrolysis assays as in D – G. Data points are mean ± SD (n = 3) with symbol key below graph. Plateau constrained to 89.55 (dotted line). See Materials and methods.CC BY-NC-ND · PubMed Central
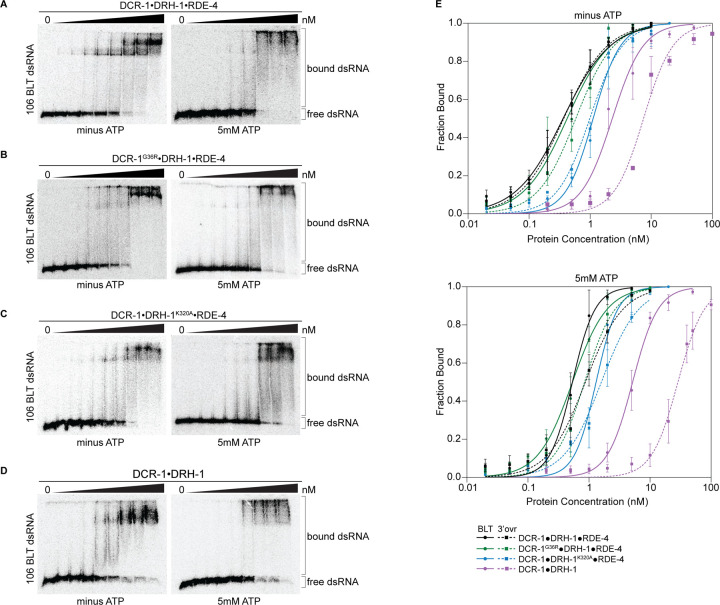
Figure 3. Binding affinity of DCR-1•DRH-1•RDE-4 wildtype and mutant complexes for 106 BLT dsRNA in the absence or presence of ATP. A. Representative PhosphorImages showing gel mobility shift assays with increasing concentrations ranging from 0 to 5nM of DCR-1•DRH-1•RDE-4 with 106 BLT dsRNA ± 5mM ATP as indicated. Sense strand was 5’ 32P-end labeled (*) and contained a 2’,3’ cyclic phosphate. As labeled on right, all dsRNA that migrated through the gel more slowly than dsRNAfree was considered bound. B – D. Same as A except with indicated complexes. Protein concentrations increased from left to right as indicated and range from 0 to 10nM (B and C), and 0 to 50nM (D). E. Radioactivity in PhosphorImages as in A-D was quantified to generate binding isotherms for wildtype and mutant complexes ± 5mM ATP (see key). Fraction bound was determined using radioactivity for dsRNAfree and dsRNAbound. Data was fit to calculate dissociation constant, Kd, using the Hill formalism, where fraction bound = 1/(1 + (Kdn/[P]n)). Data points, mean ± SD (n ≥ 3). See also Figure S5.
Figure 3. Binding affinity of DCR-1•DRH-1•RDE-4 wildtype and mutant complexes for 106 BLT dsRNA in the absence or presence of ATP. A. Representative PhosphorImages showing gel mobility shift assays with increasing concentrations ranging from 0 to 5nM of DCR-1•DRH-1•RDE-4 with 106 BLT dsRNA ± 5mM ATP as indicated. Sense strand was 5’ 32P-end labeled (*) and contained a 2’,3’ cyclic phosphate. As labeled on right, all dsRNA that migrated through the gel more slowly than dsRNAfree was considered bound. B – D. Same as A except with indicated complexes. Protein concentrations increased from left to right as indicated and range from 0 to 10nM (B and C), and 0 to 50nM (D). E. Radioactivity in PhosphorImages as in A-D was quantified to generate binding isotherms for wildtype and mutant complexes ± 5mM ATP (see key). Fraction bound was determined using radioactivity for dsRNAfree and dsRNAbound. Data was fit to calculate dissociation constant, Kd, using the Hill formalism, where fraction bound = 1/(1 + (Kdn/[P]n)). Data points, mean ± SD (n ≥ 3). See also Figure S5.CC BY-NC-ND · PubMed Central
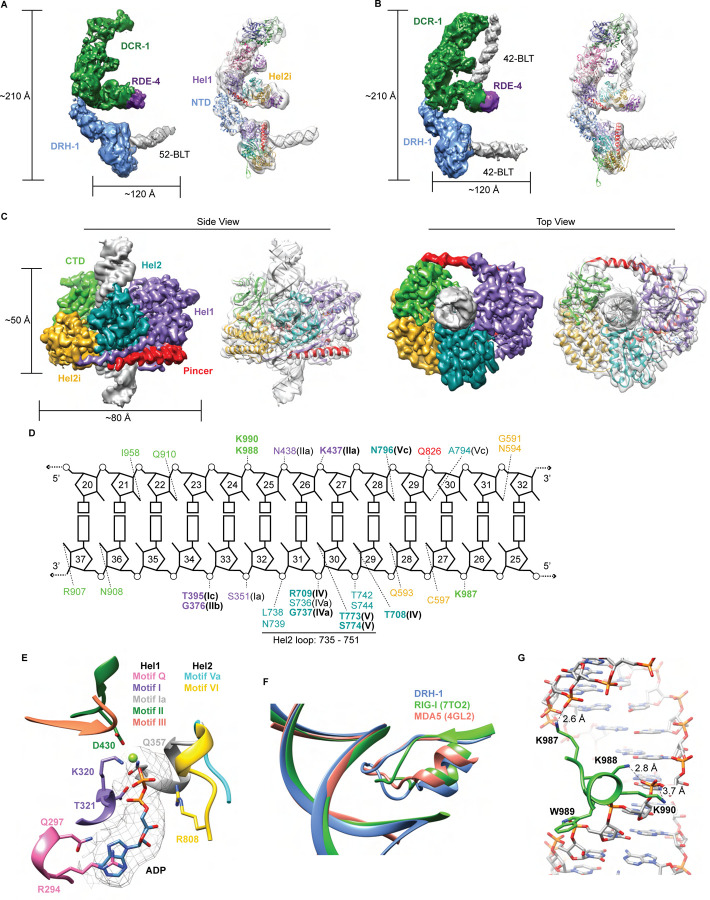
Figure 4. Cryo-EM analyses provide insight into ATP-dependent and ATP-independent cleavage mechanisms. A. 6.1 Å reconstruction of DCR-1•DRH-1•RDE-4. DCR-1 and RDE-4 densities were fitted with human Dicer in complex with TRBP (PBD 5ZAK)40, DRH-1 density was fitted with an AlphaFold2 model of DRH-144,45, and a 52-BLT A-form dsRNA was built in Chimera69. Color of protein names correlates with model colors. The domains of DCR-1, DRH-1, and RDE-4 are color coded the same as in Figure 1A. For simplicity, only domains discussed in the text are labeled. See also Figure S7. B. 7.6 Å reconstruction of DCR-1•DRH-1•RDE-4. DCR-1 and RDE-4 densities were fit with PBD 5ZAL40, DRH-1 density was fit with the AlphaFold2 prediction of DRH-144,45, and a 42-BLT A-form dsRNA was built in Chimera69. See also Figure S8. C. 3D reconstruction at 2.9 Å fitted with a refined model of the helicase and CTD domains of DRH-1 and dsRNA. See also Figure S9 and Table S2. D. The interactions between DRH-1 and dsRNA, determined with a 3.7 Å cutoff for contacts. Bold residues indicate residues that are identical with RIG-I, MDA5, or both. See also Figure S10. E. ADP, Mg++, and surrounding helicase motifs. Colors: motif Q (pink), motif I (purple), motif Ia (gray), motif II (green), motif III (coral), motif Va (cyan), and motif VI (yellow). The density of ADP is shown in mesh. F. Conserved loop in the Hel2 domain is inserted into the dsRNA major groove. DRH-1 = blue, residues 733 – 756; RIG-I (7TO2) = green, residues 659 – 679; MDA5 (4GL2) = salmon, residues 752 – 773. Note that this figure includes residues on each side of the loop. See also Figure S10. G. Lysines 987, 988, and 990 interact with the dsRNA backbone. See also Figure S10.
Figure 4. Cryo-EM analyses provide insight into ATP-dependent and ATP-independent cleavage mechanisms. A. 6.1 Å reconstruction of DCR-1•DRH-1•RDE-4. DCR-1 and RDE-4 densities were fitted with human Dicer in complex with TRBP (PBD 5ZAK)40, DRH-1 density was fitted with an AlphaFold2 model of DRH-144,45, and a 52-BLT A-form dsRNA was built in Chimera69. Color of protein names correlates with model colors. The domains of DCR-1, DRH-1, and RDE-4 are color coded the same as in Figure 1A. For simplicity, only domains discussed in the text are labeled. See also Figure S7. B. 7.6 Å reconstruction of DCR-1•DRH-1•RDE-4. DCR-1 and RDE-4 densities were fit with PBD 5ZAL40, DRH-1 density was fit with the AlphaFold2 prediction of DRH-144,45, and a 42-BLT A-form dsRNA was built in Chimera69. See also Figure S8. C. 3D reconstruction at 2.9 Å fitted with a refined model of the helicase and CTD domains of DRH-1 and dsRNA. See also Figure S9 and Table S2. D. The interactions between DRH-1 and dsRNA, determined with a 3.7 Å cutoff for contacts. Bold residues indicate residues that are identical with RIG-I, MDA5, or both. See also Figure S10. E. ADP, Mg++, and surrounding helicase motifs. Colors: motif Q (pink), motif I (purple), motif Ia (gray), motif II (green), motif III (coral), motif Va (cyan), and motif VI (yellow). The density of ADP is shown in mesh. F. Conserved loop in the Hel2 domain is inserted into the dsRNA major groove. DRH-1 = blue, residues 733 – 756; RIG-I (7TO2) = green, residues 659 – 679; MDA5 (4GL2) = salmon, residues 752 – 773. Note that this figure includes residues on each side of the loop. See also Figure S10. G. Lysines 987, 988, and 990 interact with the dsRNA backbone. See also Figure S10.CC BY-NC-ND · PubMed Central
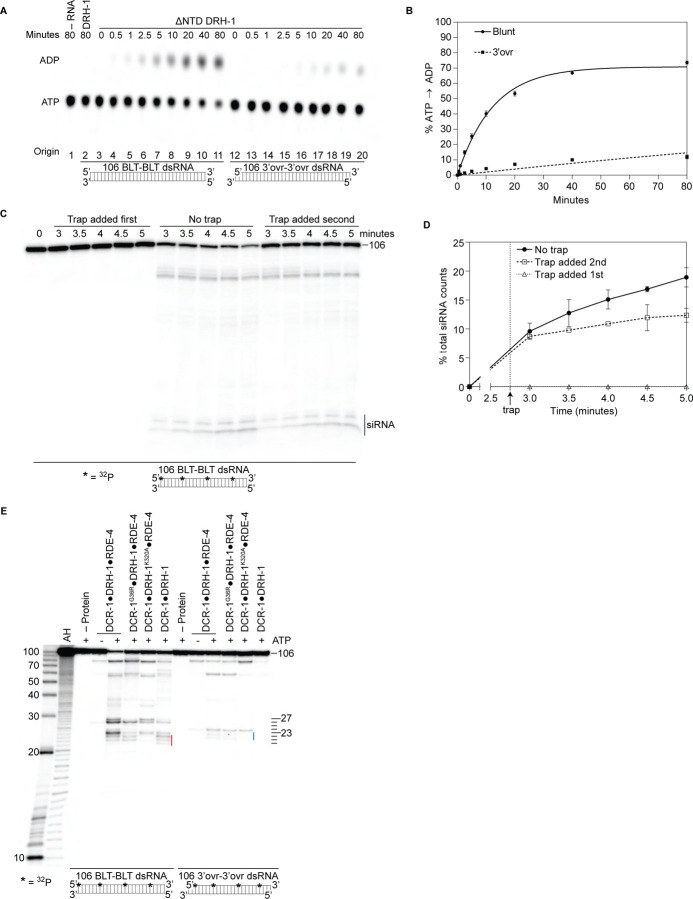
Figure 5. Autoinhibition of DRH-1 is relieved to promote processive cleavage. A. Full length DRH-1 (25nM) was incubated with 106 BLT dsRNA (400nM) with 100μM α−32P-ATP at 20°C (lane 2). ΔNTD DRH-1 (25nM) was incubated without RNA (-RNA; lane 1) or with 400nM 106 BLT (lanes 3 – 11) or 3’ovr dsRNA (lanes 12 – 20) with 100μM α−32P-ATP at 20°C. ATP hydrolysis was monitored by TLC, and a representative PhosphorImage is shown. Positions of origin, ATP, and ADP are indicated. B. Quantification of ATP hydrolysis assay as in A. Data points are mean ± SD (n = 3) with symbol key in graph. Plateau constrained to 89.55 (dotted line). See Materials and methods. C and D. A representative PhosphorImage (C) shows trap experiments using 50nM DCR-1•DRH-1•RDE-4 and 1nM 32P-internally-labeled 106 BLT dsRNA ± 2000nM 52 BLT cold dsRNA. Quantification (D) shows mean ± SD (n = 3). Cold dsRNA was added at 2.75 minutes as indicated by the vertical dotted line and arrow. E. Single-turnover cleavage assays of 106 BLT or 106 3’ovr dsRNA (1nM) with indicated protein complex (25nM) ± 5mM ATP as indicated. Sense strand was 32P-internally labeled to allow visualization of intermediates, with red line noting internal cleavage products of 21 – 23 nts and blue line noting 22 – 23 nt products. Products were separated by 17% denaturing PAGE, and a representative PhosphorImage is shown (n = 3). Left, marker nucleotide lengths. AH, alkaline hydrolysis.
Figure 5. Autoinhibition of DRH-1 is relieved to promote processive cleavage. A. Full length DRH-1 (25nM) was incubated with 106 BLT dsRNA (400nM) with 100μM α−32P-ATP at 20°C (lane 2). ΔNTD DRH-1 (25nM) was incubated without RNA (-RNA; lane 1) or with 400nM 106 BLT (lanes 3 – 11) or 3’ovr dsRNA (lanes 12 – 20) with 100μM α−32P-ATP at 20°C. ATP hydrolysis was monitored by TLC, and a representative PhosphorImage is shown. Positions of origin, ATP, and ADP are indicated. B. Quantification of ATP hydrolysis assay as in A. Data points are mean ± SD (n = 3) with symbol key in graph. Plateau constrained to 89.55 (dotted line). See Materials and methods. C and D. A representative PhosphorImage (C) shows trap experiments using 50nM DCR-1•DRH-1•RDE-4 and 1nM 32P-internally-labeled 106 BLT dsRNA ± 2000nM 52 BLT cold dsRNA. Quantification (D) shows mean ± SD (n = 3). Cold dsRNA was added at 2.75 minutes as indicated by the vertical dotted line and arrow. E. Single-turnover cleavage assays of 106 BLT or 106 3’ovr dsRNA (1nM) with indicated protein complex (25nM) ± 5mM ATP as indicated. Sense strand was 32P-internally labeled to allow visualization of intermediates, with red line noting internal cleavage products of 21 – 23 nts and blue line noting 22 – 23 nt products. Products were separated by 17% denaturing PAGE, and a representative PhosphorImage is shown (n = 3). Left, marker nucleotide lengths. AH, alkaline hydrolysis.CC BY-NC-ND · PubMed Central
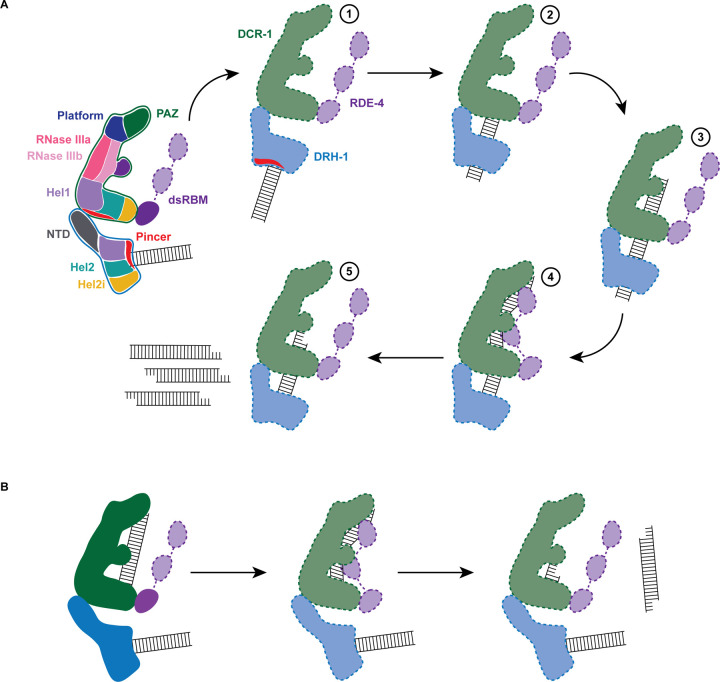
Figure 6. Working model of dsRNA cleavage by DCR-1•DRH-1•RDE-4. A. Model for ATP-dependent cleavage. Far left shows cartoon of complex with domains color-coded. Illustrations 1–5 show proposed steps as discussed in text, with DCR-1 (green), DRH-1, (blue) and RDE-4 (purple). Solid lines indicate structures observed in our cryo-EM studies, while dashed lines indicate proposed intermediates not yet observed. Pincer subdomain (red) is colored to orient proposed DRH-1 conformational change. Additional details in text. B. Model for ATP-independent cleavage, with colors and solid and dashed lines as in A.
Figure 6. Working model of dsRNA cleavage by DCR-1•DRH-1•RDE-4. A. Model for ATP-dependent cleavage. Far left shows cartoon of complex with domains color-coded. Illustrations 1–5 show proposed steps as discussed in text, with DCR-1 (green), DRH-1, (blue) and RDE-4 (purple). Solid lines indicate structures observed in our cryo-EM studies, while dashed lines indicate proposed intermediates not yet observed. Pincer subdomain (red) is colored to orient proposed DRH-1 conformational change. Additional details in text. B. Model for ATP-independent cleavage, with colors and solid and dashed lines as in A.CC BY-NC-ND · PubMed Central

Verification

Claims the paper makes

The claims and statistics of this paper haven’t been checked yet.

Run the check — free, no account needed. It reads the open-access text and checks the sources it cites.

A few free checks a day · papers already verified open instantly · results are public

Self-check

Percentages, sums and reported differences re-computed from the paper’s own numbers.

The self-check needs the paper’s full text.

Citations

Cites

Show all 81 references

Research works printed but not linked: 2

  1. 10.7554/elife.65810 · DOI
  2. 10.1007/s00249 · DOI

Metadata

Authors
Consalvo, C. D., Aderounmu, A. M., Donelick, H. M., Aruscavage, P. J., Eckert, D. M., Shen, P. S., & Bass, B. L.
Affiliations
University of Utah (US)
Corresponding author
  • Shen, Peter S.
  • Bass, Brenda L.
Venue
bioRxiv (Cold Spring Harbor Laboratory)
Publisher
openRxiv
Published
2023-09-21
OpenAlex
W4386967113
Cited by
1
References
81
Citations by year
2024: 1
Type
posted content
Language
en
Open access
Licence
cc-by-nc-nd
Locations
  • bioRxiv (Cold Spring Harbor Laboratory) (acceptedVersion, cc-by-nc-nd)
  • PubMed (publishedVersion)
  • PubMed Central (submittedVersion, cc-by-nc-nd)
Funders
  • U.S. Department of Energy
  • Oregon Health and Science University
  • National Institutes of Health (1s10od026959-01a1)
  • Office of Science
  • University of California, Davis
  • National Cancer Institute (R01CA260414, S10OD026959)
  • National Institute of General Medical Sciences (U24GM129547, U24GM129539, R35GM141262, R35GM133772)
  • National Institute of Allergy and Infectious Diseases (T32AI055434)
  • Biological and Environmental Research
  • Common Fund (U24 GM129539)
Topics
  • Life Sciences › Immunology and Microbiology › Immunology › interferon and immune responses
  • Life Sciences › Immunology and Microbiology › Immunology › Invertebrate Immune Response Mechanisms
  • Life Sciences › Biochemistry, Genetics and Molecular Biology › Molecular Biology › RNA Interference and Gene Delivery
Keywords
Dicer, RIG-I-like helicases, antiviral innate immunity, Caenorhabditis elegans, ATP hydrolysis, autoinhibition, helicase domain, cryo-EM structure, RNA interference, interferon response

About these checks

Registry, retraction, Cites and statistics results are computed, not judged, with one exception: a printed reference that no index lists is read once by a model before it counts as a citation error. Claims are extracted by a model and kept only when their quote appears verbatim in the text; each cited source is then checked, with a model’s help, for whether it says what the claim relies on. Those verdicts can be wrong — read the claim’s quote and the cited source before relying on one.

Statistics and arithmetic are recomputed, not judged.

Confidence bands are shown only for fields calibrated on our annotated test set. None is calibrated yet, so no band is shown.

What counts as a claim ›How we measure confidence ›How we check this ›

Are you an author, or do you see a problem with this page? Request a review

How to cite

Cite CoChat for the checks on this page, and the paper for its own findings.

This page
CoChat. (2026). Citation check: C. elegans Dicer acts with the RIG-I-like helicase DRH-1 and RDE-4 to cleave dsRNA. https://app.cochat.ai/papers/10.1101/2023.09.21.558868
The paper
Consalvo, C. D., Aderounmu, A. M., Donelick, H. M., Aruscavage, P. J., Eckert, D. M., Shen, P. S., & Bass, B. L. (2023). C. elegans Dicer acts with the RIG-I-like helicase DRH-1 and RDE-4 to cleave dsRNA. bioRxiv (Cold Spring Harbor Laboratory). https://doi.org/10.1101/2023.09.21.558868

Data sources

Bibliographic data: Semantic Scholar, OpenAlex, Crossref.

Contains information from the Semantic Scholar Academic Graph Datasets, made available under the ODC Attribution License (ODC-BY 1.0).

Semantic Scholar’s data is described in: Kinney, R., et al. (2023). The Semantic Scholar Open Data Platform. arXiv:2301.10140.