Student or educator? Sign up with your school email and get 6 months of Pro free.

The DOI matches its Crossref record; 1 of the 1 references it cites were found in a registry or an index.

Int&in: a machine learning-based web server for split site identification in inteins

Open access

Preprint — published as 10.1002/pro.4985

Abstract

Inteins are proteins that excise themselves out of host proteins and ligate the flanking polypeptides in an auto-catalytic process called protein splicing. They are gaining momentum in synthetic biology for their ability to post-translationally modify proteins of interest. In nature, inteins are either contiguous or split, in which case the two intein fragments must first form a complex for the splicing to occur. So far, heuristic methods have been employed whenever a new split site in an intein had to be identified. To make the process of split site identification in inteins faster, easier and less costly, we developed Int&in, a web server that uses a gaussian Naïve Bayes machine learning model to predict active and inactive split sites with high accuracy. The model was trained on a data set generated by us and validated using a large diverse data set from the literature, resulting in an accuracy of 0.76. Int&in will facilitate the engineering of novel split inteins for applications in biotechnology and synthetic biology.

Overview

The claims and statistics of this paper haven’t been checked yet.

Run the check — free, no account needed. It reads the open-access text and checks the sources it cites.

A few free checks a day · papers already verified open instantly · results are public

Integrity signals

Registry

Crossref · 10.1101/2023.09.27.559783

Cites

1 of 1 references verified0 citation errors · 0 not checkable

Statistics

Figures

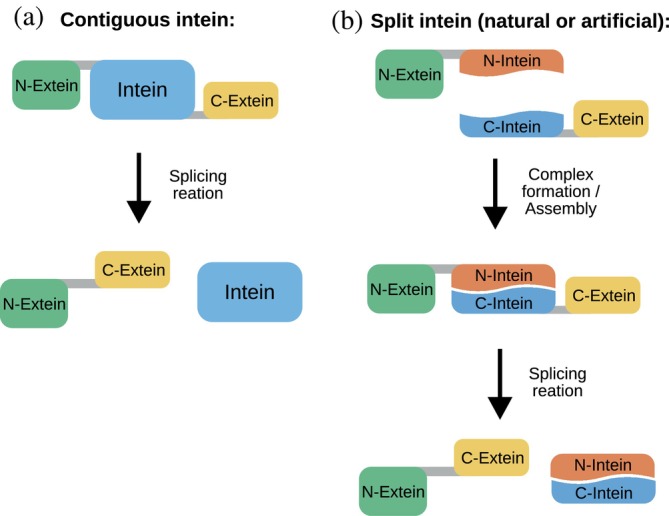
FIGURE 1 Schematic representation of the protein splicing reaction carried out by contiguous (a) and split (b) inteins.
FIGURE 1 Schematic representation of the protein splicing reaction carried out by contiguous (a) and split (b) inteins.CC BY-NC · PubMed Central
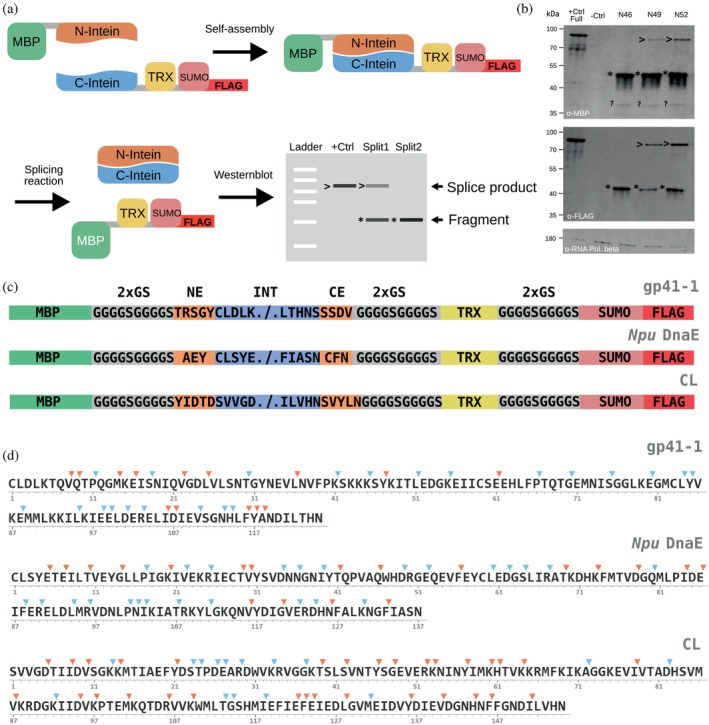
FIGURE 2 Generation of the dataset of split inteins for the development of the algorithm used in the Int&in web server. (a) Schematic representation of the experimental setup. MBP, maltose binding protein. TRX, thioredoxin. +Ctrl, positive control consisting of the MBP‐TRX‐SUMO‐FLAG fusion protein, additionally having the gp41‐1 local exteins between MBP and TRX. Split1, Split2, examples of split sites that will be analyzed. (b) Exemplary Western blot showing the splicing activity of Npu DnaE split at the indicated sites. NX, intein split at the amino acid at position X from the first amino acid of the intein (the N‐terminus). +Ctrl Full, positive control consisting of the full‐length intein, artificially expressed as contiguous intein. −Crtl, negative control consisting of untransformed cells. *, precursor (N‐intein visualized with the anti‐MBP antibody, or C‐intein visualized with anti‐FLAG antibody). >, splice product.?, likely degradation product. Loading control, RNA polymerase beta‐subunit. The N‐extein (MBP) is approximately 42 kDa. The C‐extein (TRX‐SUMO‐FLAG) fusion protein is expected to be around 26 kDa. The longest gp41‐1 fragment is expected to be about 13 kDa. Thus, the N‐/C‐inteins (N‐intein: MBP + N‐terminal intein fragment; C‐intein: C‐terminal intein fragment + TRX‐SUMO‐FLAG) are expected to be maximally 55 and 39 kDa respectively. The local exteins are expected to contribute minimally to the final size of the proteins. Notably, the splice product and the C‐constructs run at a higher molecular weight than expected. (c) Schematic representation of the construct design for gp41‐1, Npu DnaE and CL inteins split at various sites. The “split cassette” used to create the split versions is not visualized for simplicity. See Materials and Methods for details. NE, N‐terminal local exteins. CE, C‐terminal local exteins. (d) Sequences of the inteins used to generate the dataset and location of split sites. The color code indicates active (cyan) and inactive (orange) sites as experimentally assessed via Western blot. The numbers indicate residue positions.
FIGURE 2 Generation of the dataset of split inteins for the development of the algorithm used in the Int&in web server. (a) Schematic representation of the experimental setup. MBP, maltose binding protein. TRX, thioredoxin. +Ctrl, positive control consisting of the MBP‐TRX‐SUMO‐FLAG fusion protein, additionally having the gp41‐1 local exteins between MBP and TRX. Split1, Split2, examples of split sites that will be analyzed. (b) Exemplary Western blot showing the splicing activity of Npu DnaE split at the indicated sites. NX, intein split at the amino acid at position X from the first amino acid of the intein (the N‐terminus). +Ctrl Full, positive control consisting of the full‐length intein, artificially expressed as contiguous intein. −Crtl, negative control consisting of untransformed cells. *, precursor (N‐intein visualized with the anti‐MBP antibody, or C‐intein visualized with anti‐FLAG antibody). >, splice product.?, likely degradation product. Loading control, RNA polymerase beta‐subunit. The N‐extein (MBP) is approximately 42 kDa. The C‐extein (TRX‐SUMO‐FLAG) fusion protein is expected to be around 26 kDa. The longest gp41‐1 fragment is expected to be about 13 kDa. Thus, the N‐/C‐inteins (N‐intein: MBP + N‐terminal intein fragment; C‐intein: C‐terminal intein fragment + TRX‐SUMO‐FLAG) are expected to be maximally 55 and 39 kDa respectively. The local exteins are expected to contribute minimally to the final size of the proteins. Notably, the splice product and the C‐constructs run at a higher molecular weight than expected. (c) Schematic representation of the construct design for gp41‐1, Npu DnaE and CL inteins split at various sites. The “split cassette” used to create the split versions is not visualized for simplicity. See Materials and Methods for details. NE, N‐terminal local exteins. CE, C‐terminal local exteins. (d) Sequences of the inteins used to generate the dataset and location of split sites. The color code indicates active (cyan) and inactive (orange) sites as experimentally assessed via Western blot. The numbers indicate residue positions.CC BY-NC · PubMed Central
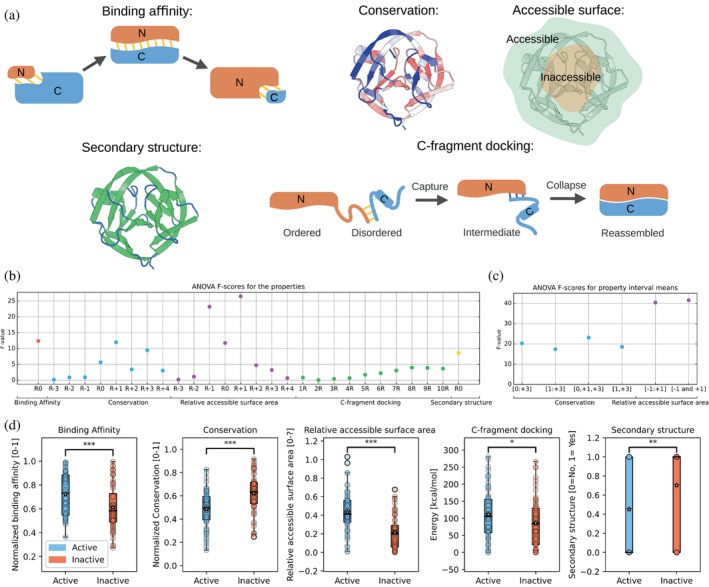
FIGURE 3 Protein sequence and structure properties with predictive power for discriminating between active and inactive split sites in inteins. (a) Depictions of the binding affinity, conservation (conserved residues are shown in red and non‐conserved residues in blue), secondary structure (helices and beta sheets are shown in green and unstructured elements in blue), C‐fragment docking (binding energy of the last 10 amino acids of thC‐fragment to the N‐fragment) are shown. (b) ANOVA F‐scores for the different properties. (c) ANOVA F‐scores for the mean of several sums of residues' properties for conservation and relative accessible surface area. (d) Boxplots of active and inactive split sites. A two‐sided Mann–Whitney U test was used for all properties but conservation and C‐fragment docking for which a two‐sided t‐test was used. *, p‐value <0.05; **, p‐value <0.01; ***, p‐value <0.001.
FIGURE 3 Protein sequence and structure properties with predictive power for discriminating between active and inactive split sites in inteins. (a) Depictions of the binding affinity, conservation (conserved residues are shown in red and non‐conserved residues in blue), secondary structure (helices and beta sheets are shown in green and unstructured elements in blue), C‐fragment docking (binding energy of the last 10 amino acids of thC‐fragment to the N‐fragment) are shown. (b) ANOVA F‐scores for the different properties. (c) ANOVA F‐scores for the mean of several sums of residues' properties for conservation and relative accessible surface area. (d) Boxplots of active and inactive split sites. A two‐sided Mann–Whitney U test was used for all properties but conservation and C‐fragment docking for which a two‐sided t‐test was used. *, p‐value <0.05; **, p‐value <0.01; ***, p‐value <0.001.CC BY-NC · PubMed Central
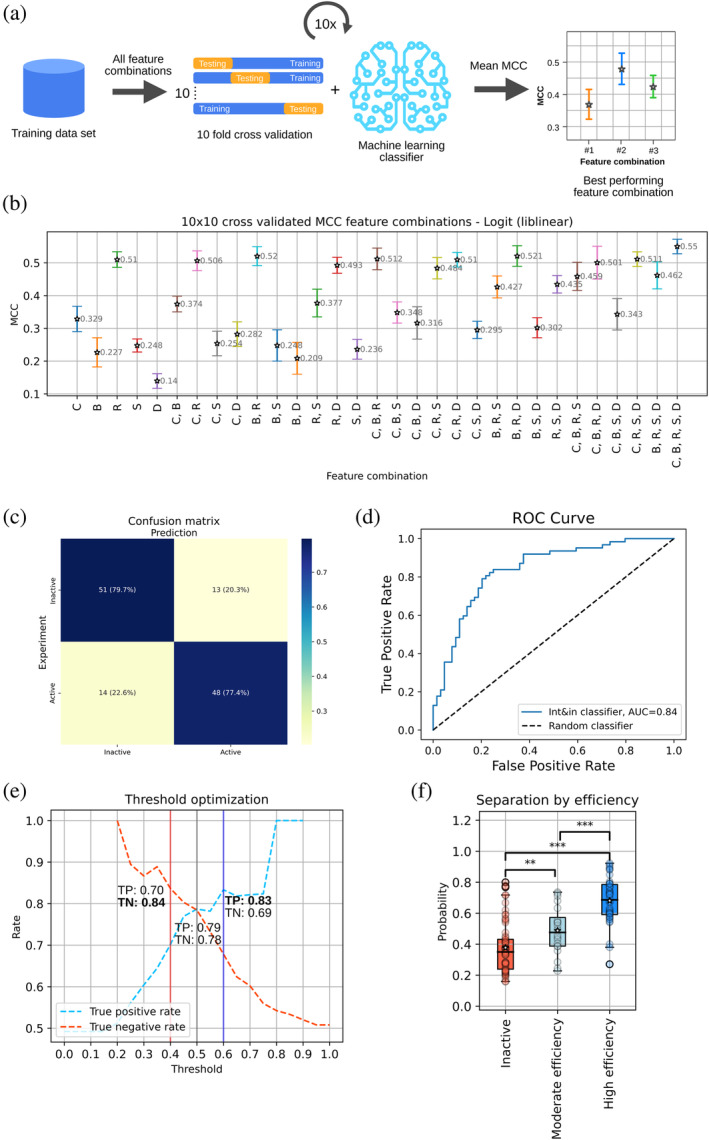
FIGURE 4 Int&in machine learning model creation with the training dataset. (a) Illustration of the workflow for identifying the best feature combination and classifier. (b) 10 × 10 CV MCCs plotted with their respective feature combinations. The following letters are used to code for the following features: C = conservation, B = binding affinity, R = relative accessible surface area, D = C‐fragment docking, S = secondary structure. (c) Confusion matrix of the Int&in machine learning model based on the logistic regression classifier with the following features: conservation, relative accessible surface area and secondary structure. (d) ROC curve of the Int&in machine learning model compared to a random classifier. (e) Plot showing the probability threshold adjusted from 0 to 1 with increments of 0.05 plotted against the true positive and true negative. The respective rates of true positives are shown for three different thresholds: 0.4 (red), 0.5 (gray) and 0.6 (blue).(f) Plot showing the separation of the inteins according to different splicing efficiencies as predicted by the model. The inactive group shows no activity whatsoever (n = 64), the moderate efficiency group contains all split sites leading to inteins with an activity <50% (n = 20) and the high efficiency group contains all split sites leading to inteins with an activity ≥50% (n = 42). The two‐sided Mann–Whitney U test was used for significance calculation, since the moderately efficient and highly efficient groups are not normally distributed. *, p‐value <0.05; **, p‐value <0.01; ***, p‐value <0.001.
FIGURE 4 Int&in machine learning model creation with the training dataset. (a) Illustration of the workflow for identifying the best feature combination and classifier. (b) 10 × 10 CV MCCs plotted with their respective feature combinations. The following letters are used to code for the following features: C = conservation, B = binding affinity, R = relative accessible surface area, D = C‐fragment docking, S = secondary structure. (c) Confusion matrix of the Int&in machine learning model based on the logistic regression classifier with the following features: conservation, relative accessible surface area and secondary structure. (d) ROC curve of the Int&in machine learning model compared to a random classifier. (e) Plot showing the probability threshold adjusted from 0 to 1 with increments of 0.05 plotted against the true positive and true negative. The respective rates of true positives are shown for three different thresholds: 0.4 (red), 0.5 (gray) and 0.6 (blue).(f) Plot showing the separation of the inteins according to different splicing efficiencies as predicted by the model. The inactive group shows no activity whatsoever (n = 64), the moderate efficiency group contains all split sites leading to inteins with an activity <50% (n = 20) and the high efficiency group contains all split sites leading to inteins with an activity ≥50% (n = 42). The two‐sided Mann–Whitney U test was used for significance calculation, since the moderately efficient and highly efficient groups are not normally distributed. *, p‐value <0.05; **, p‐value <0.01; ***, p‐value <0.001.CC BY-NC · PubMed Central
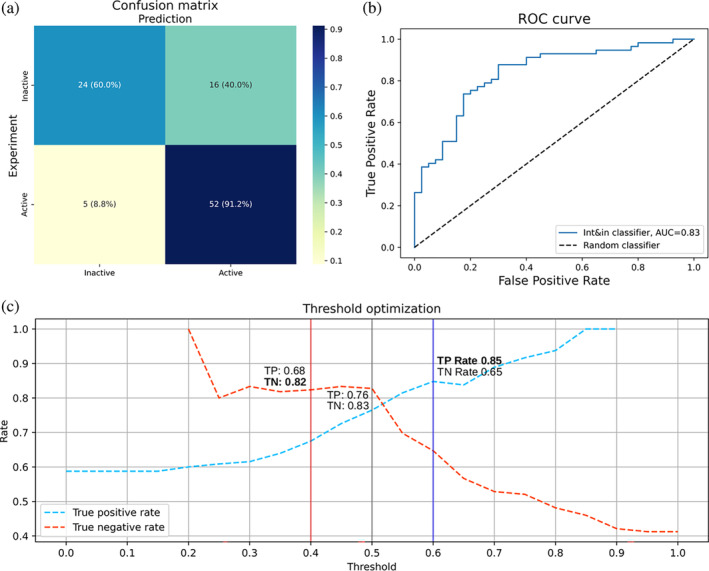
FIGURE 5 Int&in performs well on a testing dataset. (a) Confusion matrix of the Int&in machine learning model with the dataset of split sites from literature. (b) ROC curve of the Int&in machine learning model compared to a random classifier. (c) Plot showing the probability threshold adjusted from 0 to 1 with increments of 0.05 plotted against the true positive and true negative rates. The rates are shown for three different thresholds: 0.4 (red), 0.5 (gray) and 0.6 (blue).
FIGURE 5 Int&in performs well on a testing dataset. (a) Confusion matrix of the Int&in machine learning model with the dataset of split sites from literature. (b) ROC curve of the Int&in machine learning model compared to a random classifier. (c) Plot showing the probability threshold adjusted from 0 to 1 with increments of 0.05 plotted against the true positive and true negative rates. The rates are shown for three different thresholds: 0.4 (red), 0.5 (gray) and 0.6 (blue).CC BY-NC · PubMed Central

Verification

Claims the paper makes

The claims and statistics of this paper haven’t been checked yet.

Run the check — free, no account needed. It reads the open-access text and checks the sources it cites.

A few free checks a day · papers already verified open instantly · results are public

Self-check

Percentages, sums and reported differences re-computed from the paper’s own numbers.

The self-check needs the paper’s full text.

Citations

Cites

Show all 1 references

Research works printed but not linked: 60

  1. 2019, Switchable inteins for conditional protein splicing, Biol Chem, 400, 467, 10.1515/hsz-2018-0309 · DOI
  2. 2021, Load and Display: Engineering Encapsulin as a Modular Nanoplatform for Protein-Cargo Encapsulation and Protein-Ligand Decoration Using Split Intein and SpyTag/SpyCatcher, Biomacromolecules, 22, 3028, 10.1021/acs.biomac.1c00481 · DOI
  3. 2017, Efficient generation of bispecific IgG antibodies by split intein mediated protein trans-splicing system, Sci Rep, 7, 8360, 10.1038/s41598-017-08641-3 · DOI
  4. 10.1038/s41587-019-0105-3 · DOI · Paper page
  5. 2019, Split intein-mediated selection of cells containing two plasmids using a single antibiotic, Nat Commun, 10, 4967, 10.1038/s41467-019-12911-1 · DOI
  6. 2019, Bacterial Cell-Surface Display of Semisynthetic Cyclic Peptides, Chembiochem, 20, 72, 10.1002/cbic.201800552 · DOI
  7. 10.1038/srep26167 · DOI
  8. 10.1073/pnas.2006603117 · DOI
  9. 2018, Treatment of a metabolic liver disease by in vivo genome base editing in adult mice, Nat Med, 24, 1519, 10.1038/s41591-018-0209-1 · DOI · Paper page
  10. 10.1039/C5MB00341E · DOI
  11. 2019, Reduction of non-specific toxicity of immunotoxin by intein mediated reconstitution on target cells, Int Immunopharmacol, 66, 288, 10.1016/j.intimp.2018.11.039 · DOI
  12. 2018, Intein-mediated backbone cyclization of entolimod confers enhanced radioprotective activity in mouse models, PeerJ, 6, e5043, 10.7717/peerj.5043 · DOI
  13. 10.1021/bi051697+ · DOI
  14. 10.1021/ja026769o · DOI
  15. 10.1038/nmeth.1189 · DOI
  16. 2020, Split Intein-Mediated Protein Ligation for detecting protein-protein interactions and their inhibition, Nat Commun, 11, 2440, 10.1038/s41467-020-16299-1 · DOI
  17. 10.1016/S0167-4838(98)00157-5 · DOI · Paper page
  18. 10.1021/bi991902j · DOI
  19. 2018, Computational design of chemogenetic and optogenetic split proteins, Nat Commun, 9, 4042, 10.1038/s41467-018-06531-4 · DOI
  20. 10.1093/protein/gzu028 · DOI · Paper page
  21. 2022, ColabFold: making protein folding accessible to all, Nat Methods, 19, 679, 10.1038/s41592-022-01488-1 · doi:10.1038/s41592-022-01488-1 · Paper page
  22. 10.1074/jbc.M112.372680 · DOI · Paper page
  23. 10.1016/j.febslet.2006.02.045 · DOI · Paper page
  24. 10.1073/pnas.1909825116 · DOI
  25. 10.1074/jbc.M805474200 · DOI
  26. 10.1002/cbic.200900370 · DOI
  27. 10.1093/bioinformatics/btw514 · DOI · Paper page
  28. 10.7554/eLife.07454 · DOI · Paper page
  29. 10.1021/ja4104364 · DOI
  30. 2013, Naive Bayes classifier with feature selection to identify phage virion proteins, Comput Math Methods Med, 2013, 530696
  31. 10.1155/2015/978193 · DOI
  32. 10.1093/bioinformatics/btq302 · DOI · Paper page
  33. 2021, Quantification of organelle contact sites by split-GFP-based contact site sensors (SPLICS) in living cells, Nat Protoc, 16, 5287, 10.1038/s41596-021-00614-1 · DOI
  34. 2022, Engineering receptors in the secretory pathway for orthogonal signalling control, Nat Commun, 13, 7350, 10.1038/s41467-022-35161-0 · DOI
  35. 2022, Detection of SARS-CoV-2 RNA Using a DNA Aptamer Mimic of Green Fluorescent Protein, ACS Chem Biol, 17, 840, 10.1021/acschembio.1c00893 · DOI
  36. 10.1002/anie.200600570 · DOI
  37. 10.1073/pnas.2003613117 · DOI
  38. 2015, An Engineered Split Intein for Photoactivated Protein Trans-Splicing, PLoS One, 10, e0135965, 10.1371/journal.pone.0135965 · DOI
  39. 10.1073/pnas.96.2.400 · DOI
  40. 10.1021/ja991795g · DOI · Paper page
  41. 10.1016/S0022-2836(83)80079-5 · DOI · Paper page
  42. 10.1093/protein/15.2.91 · DOI
  43. 10.1073/pnas.96.17.9459 · DOI · Paper page
  44. 2022, RING 3.0: fast generation of probabilistic residue interaction networks from structural ensembles, Nucleic Acids Res, 50, W651, 10.1093/nar/gkac365 · DOI · Paper page
  45. 10.1016/0022-2836(73)90011-9 · DOI · Paper page
  46. 10.1007/s11004-009-9257-x · DOI · Paper page
  47. 10.1093/bioinformatics/14.9.755 · DOI · Paper page
  48. 10.1093/bioinformatics/btu739 · DOI · Paper page
  49. 10.1093/nar/gkh340 · DOI · Paper page
  50. 2002, Rate4Site: an algorithmic tool for the identification of functional regions in proteins by surface mapping of evolutionary determinants within their homologues, Bioinformatics 18 Suppl, 1, S71
  51. 10.1093/molbev/msh194 · DOI · Paper page
  52. 10.1093/nar/gkw408 · DOI · Paper page
  53. 2017, PRODIGY: A Contact-based Predictor of Binding Affinity in Protein-protein Complexes, Bio Protoc, 7, e2124
  54. 10.1016/0022-2836(71)90324-X · DOI · Paper page
  55. 2016, FreeSASA: An open source C library for solvent accessible surface area calculations, F1000Res, 5, 189, 10.12688/f1000research.7931.1 · DOI · Paper page
  56. 10.1002/bip.360221211 · DOI · Paper page
  57. 10.1093/nar/gkq1105 · DOI · Paper page
  58. M. L. Waskom , seaborn: statistical data visualization. Journal of Open Source Software 6 (2021). · DOI · Paper page
  59. 10.1038/35002125 · DOI · Paper page
  60. 10.1186/s12859-017-1934-z · DOI · Paper page

Metadata

Authors
Schmitz, M., Ballestin, J. B., Liang, J., Tomas, F., Freist, L., Voigt, K., Ventura, B. D., & Öztürk, M. A.
Affiliations
University of Freiburg (DE)
Corresponding author
  • Ventura, Barbara Di
  • Öztürk, Mehmet Ali
Venue
Protein Science
Publisher
openRxiv
Published
2023-09-29
Volume
33
Issue
6
Pages
e4985-e4985
ISSN
0961-8368 (ISSN-L)
OpenAlex
W4396734142
Cited by
9
References
1
Citations by year
2026: 3 · 2025: 4 · 2024: 2
FWCI
1.23
Type
journal article
Language
en
Open access
Licence
cc-by-nc
Locations
  • Protein Science (publishedVersion, cc-by-nc)
  • bioRxiv (Cold Spring Harbor Laboratory) (acceptedVersion, cc-by-nc-nd)
  • PubMed Central (publishedVersion, cc-by-nc)
  • PubMed (publishedVersion)
  • FreiDok plus (Universitätsbibliothek Freiburg) (submittedVersion)
Funders
  • European Commission (HORIZON2020)
  • Deutsche Forschungsgemeinschaft (EXC‐2189, SFB 1425, 422681845, (EXC 294))
  • Horizon 2020 Framework Programme (101002044)
Topics
  • Life Sciences › Biochemistry, Genetics and Molecular Biology › Molecular Biology › Biochemical and Structural Characterization
  • Life Sciences › Biochemistry, Genetics and Molecular Biology › Molecular Biology › Machine Learning in Bioinformatics
  • Life Sciences › Biochemistry, Genetics and Molecular Biology › Molecular Biology › Protein Structure and Dynamics
Keywords
intein, split intein, protein splicing, protein-protein interaction, logistic regression, web server, protein structural properties, sequence conservation, synthetic biology
MeSH terms
Machine Learning, Software, Protein Splicing, Catalytic Domain, Internet, Inteins

About these checks

Registry, retraction, Cites and statistics results are computed, not judged, with one exception: a printed reference that no index lists is read once by a model before it counts as a citation error. Claims are extracted by a model and kept only when their quote appears verbatim in the text; each cited source is then checked, with a model’s help, for whether it says what the claim relies on. Those verdicts can be wrong — read the claim’s quote and the cited source before relying on one.

Statistics and arithmetic are recomputed, not judged.

Confidence bands are shown only for fields calibrated on our annotated test set. None is calibrated yet, so no band is shown.

What counts as a claim ›How we measure confidence ›How we check this ›

Are you an author, or do you see a problem with this page? Request a review

How to cite

Cite CoChat for the checks on this page, and the paper for its own findings.

This page
CoChat. (2026). Citation check: Int&in: a machine learning-based web server for split site identification in inteins. https://app.cochat.ai/papers/10.1101/2023.09.27.559783
The paper
Schmitz, M., Ballestin, J. B., Liang, J., Tomas, F., Freist, L., Voigt, K., Ventura, B. D., & Öztürk, M. A. (2023). Int&in: a machine learning-based web server for split site identification in inteins. Protein Science. https://doi.org/10.1101/2023.09.27.559783

Data sources

Bibliographic data: Semantic Scholar, OpenAlex, Crossref.

Contains information from the Semantic Scholar Academic Graph Datasets, made available under the ODC Attribution License (ODC-BY 1.0).

Semantic Scholar’s data is described in: Kinney, R., et al. (2023). The Semantic Scholar Open Data Platform. arXiv:2301.10140.