PreprintCited by 13Gene Regulatory Network AnalysisRNA and protein synthesis mechanismsBacterial Genetics and Biotechnology

The DOI matches its Crossref record; 2 of the 2 references it cites were found in a registry or an index.

Noise robustness and metabolic load determine the principles of central dogma regulation

Open access

Preprint — published as 10.1126/sciadv.ado3095 · Paper page

Abstract

The processes of gene expression are inherently stochastic, even for essential genes required for growth. How does the cell maximize fitness in light of noise? To answer this question, we build a mathematical model to explore the trade-off between metabolic load and growth robustness. The model predicts novel principles of central dogma regulation: Optimal protein expression levels for many genes are in vast overabundance. Essential genes are transcribed above a lower limit of one message per cell cycle. Gene expression is achieved by load balancing between transcription and translation. We present evidence that each of these novel regulatory principles is observed. These results reveal that robustness and metabolic load determine the global regulatory principles that govern gene expression processes, and these principles have broad implications for cellular function. One-sentence summary: Fitness maximization predicts protein overabundance, a transcriptional floor, and the balancing of transcription and translation.

Overview

The claims and statistics of this paper haven’t been checked yet.

Run the check — free, no account needed. It reads the open-access text and checks the sources it cites.

A few free checks a day · papers already verified open instantly · results are public

Integrity signals

Registry

Crossref · 10.1101/2023.10.20.563172

Cites

2 of 2 references verified0 citation errors · 0 not checkable

Statistics

Figures

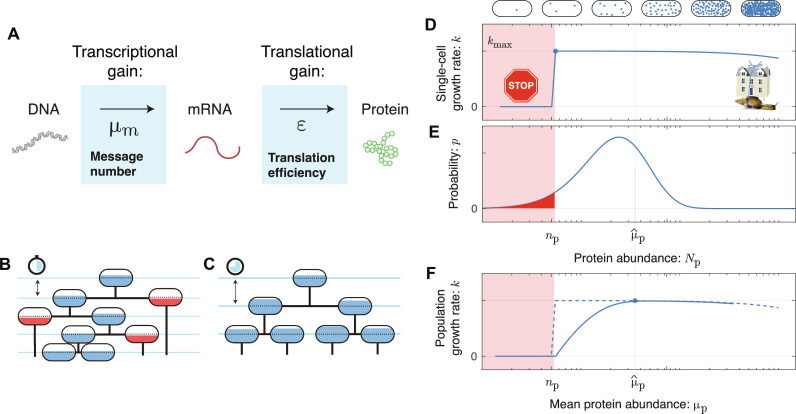
Fig. 1. The RLTO model. (A) Gene expression is stochastic. The central dogma describes a two-stage stochastic process where genes are first transcribed and then translated. The transcription process transcribes an average of μm messages per cell cycle. The translation process translates an average of ε proteins per message. (B and C) Schematic cell lineage tree during exponential growth. For a specific protein i, the cell fill represents protein number Np relative to its threshold number np required for cell growth. (B) Reducing the mean expression level reduces doubling time; however, stochasticity in expression results in below-threshold cells (red fill), which grow slowly. (C) Increasing protein expression increases the doubling time; however, all cells are above threshold (blue fill). (D) Fitness landscape as a function of protein number. Growth arrests for protein number Np smaller than the threshold level np (red) due to the failure of essential processes. High expression levels are penalized due to the metabolic cost of protein expression. This trade-off leads to a highly asymmetric fitness landscape: The relative metabolic cost of overabundance is small relative to the cost of growth arrest due to the large size of the total metabolic load N0. (E) The gene expression process is stochastic. There is substantial cell-to-cell variation in protein abundance (Np) around the mean level (μp). Because of this noise, some cells fall below threshold (red). The distribution in protein number is modeled using a gamma distribution (9). (F) The robustness load trade-off determines the optimal expression level. The population growth rate depends on the distribution of the protein number. The asymmetry of the fitness landscape drives the optimal expression level far above the threshold level due to the high fitness cost of low protein abundance.
Fig. 1. The RLTO model. (A) Gene expression is stochastic. The central dogma describes a two-stage stochastic process where genes are first transcribed and then translated. The transcription process transcribes an average of μm messages per cell cycle. The translation process translates an average of ε proteins per message. (B and C) Schematic cell lineage tree during exponential growth. For a specific protein i, the cell fill represents protein number Np relative to its threshold number np required for cell growth. (B) Reducing the mean expression level reduces doubling time; however, stochasticity in expression results in below-threshold cells (red fill), which grow slowly. (C) Increasing protein expression increases the doubling time; however, all cells are above threshold (blue fill). (D) Fitness landscape as a function of protein number. Growth arrests for protein number Np smaller than the threshold level np (red) due to the failure of essential processes. High expression levels are penalized due to the metabolic cost of protein expression. This trade-off leads to a highly asymmetric fitness landscape: The relative metabolic cost of overabundance is small relative to the cost of growth arrest due to the large size of the total metabolic load N0. (E) The gene expression process is stochastic. There is substantial cell-to-cell variation in protein abundance (Np) around the mean level (μp). Because of this noise, some cells fall below threshold (red). The distribution in protein number is modeled using a gamma distribution (9). (F) The robustness load trade-off determines the optimal expression level. The population growth rate depends on the distribution of the protein number. The asymmetry of the fitness landscape drives the optimal expression level far above the threshold level due to the high fitness cost of low protein abundance.CC BY-NC · PubMed Central
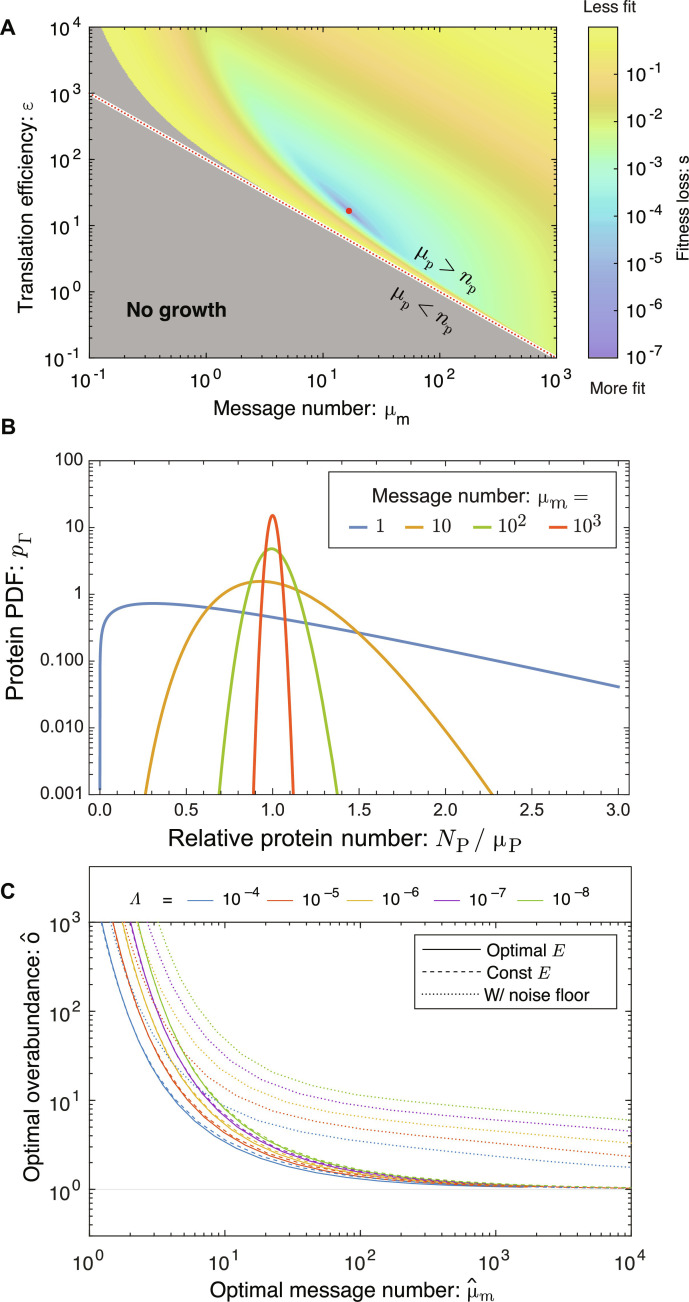
Fig. 2. The RLTO model predicts that overabundance is optimal. (A) Fitness landscape determines optimal message number and translation efficiency. The fitness loss (s ≡ ln kmax/k) is shown as a function of message number (μm) and translation efficiency (ε). The red dotted curve represents programs where the mean protein number is equal to the threshold (μp = np), and the red dot represents the optimal regulatory program ( μ^m , ε^ ). (B) Gene expression noise. Because of the stochasticity of gene expression processes at equilibrium, the protein number Np is gamma-distributed (9). For high-expression genes, expression has low noise and the protein number is tightly distributed around its mean; however, for low-expression genes, expression is noisy and the distribution is extremely wide. (C) Overabundance is optimal for all genes. For high-expression genes, low overabundance is optimal (μp ≈ np); however, for low-expression genes, vast overabundance is optimal (μp ≫ np). From a quantitative perspective, overabundance depends on the relative load Λ; however, the qualitative dependence is invariant to over an order-of-magnitude range of values.
Fig. 2. The RLTO model predicts that overabundance is optimal. (A) Fitness landscape determines optimal message number and translation efficiency. The fitness loss (s ≡ ln kmax/k) is shown as a function of message number (μm) and translation efficiency (ε). The red dotted curve represents programs where the mean protein number is equal to the threshold (μp = np), and the red dot represents the optimal regulatory program ( μ^m , ε^ ). (B) Gene expression noise. Because of the stochasticity of gene expression processes at equilibrium, the protein number Np is gamma-distributed (9). For high-expression genes, expression has low noise and the protein number is tightly distributed around its mean; however, for low-expression genes, expression is noisy and the distribution is extremely wide. (C) Overabundance is optimal for all genes. For high-expression genes, low overabundance is optimal (μp ≈ np); however, for low-expression genes, vast overabundance is optimal (μp ≫ np). From a quantitative perspective, overabundance depends on the relative load Λ; however, the qualitative dependence is invariant to over an order-of-magnitude range of values.CC BY-NC · PubMed Central
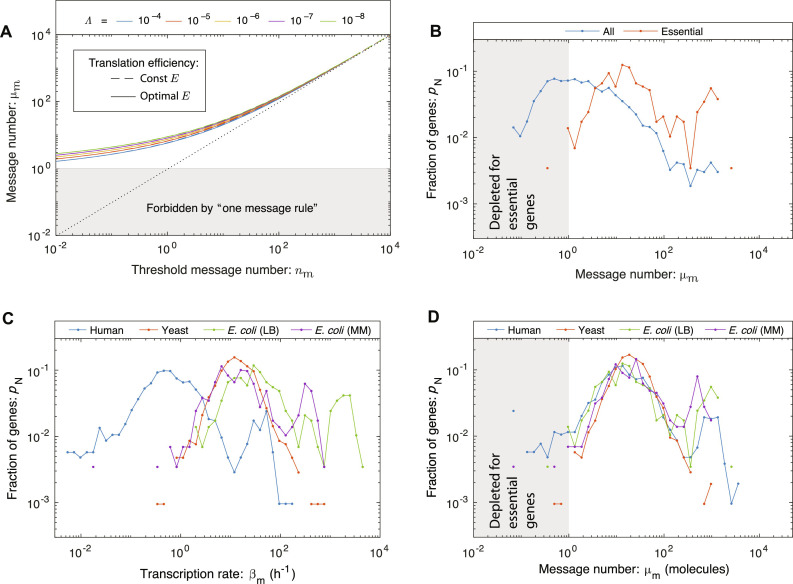
Fig. 3. A lower threshold for transcription: The one-message rule. (A) RLTO predicts the one-message rule. For high-expression genes, overabundance is low and the message number μm is predicted to be comparable to the threshold level nm (dotted line); however, for low-expression genes, there is a lower threshold (μm ≥ 1) below which expression is too noisy for robust growth. The threshold is weakly dependent on relative load Λ. (B) A one-message threshold is observed in E. coli for essential genes. A histogram shows the distribution of gene message numbers for all genes (blue) versus essential genes (orange). As predicted by the RLTO model, virtually all essential genes are expressed above the one-message-per-cell-cycle threshold. (C) Distribution of transcription rates for essential genes. No alignment is observed between the distributions of transcription rates in three evolutionarily divergent organisms. For instance, the per gene transcription rate is substantially lower in human cells relative to E. coli. (D) Distribution of message numbers for essential genes in three evolutionarily divergent organisms. The alignment of distributions of message number per gene between human, yeast, and E. coli (under two distinct growth conditions) reveals a nontrivial commonality between central dogma regulatory programs. We propose that the rationale for this alignment is the one-message rule that predicts that all essential genes must be expressed above one message per cell cycle. Both yeast and E. coli come very close to satisfying this proposed threshold; however, a greater proportion of genes in human break the one-message threshold. We speculate that this is due in part to the ad hoc nature of the essential gene classification in the context of complex multicellular organisms.
Fig. 3. A lower threshold for transcription: The one-message rule. (A) RLTO predicts the one-message rule. For high-expression genes, overabundance is low and the message number μm is predicted to be comparable to the threshold level nm (dotted line); however, for low-expression genes, there is a lower threshold (μm ≥ 1) below which expression is too noisy for robust growth. The threshold is weakly dependent on relative load Λ. (B) A one-message threshold is observed in E. coli for essential genes. A histogram shows the distribution of gene message numbers for all genes (blue) versus essential genes (orange). As predicted by the RLTO model, virtually all essential genes are expressed above the one-message-per-cell-cycle threshold. (C) Distribution of transcription rates for essential genes. No alignment is observed between the distributions of transcription rates in three evolutionarily divergent organisms. For instance, the per gene transcription rate is substantially lower in human cells relative to E. coli. (D) Distribution of message numbers for essential genes in three evolutionarily divergent organisms. The alignment of distributions of message number per gene between human, yeast, and E. coli (under two distinct growth conditions) reveals a nontrivial commonality between central dogma regulatory programs. We propose that the rationale for this alignment is the one-message rule that predicts that all essential genes must be expressed above one message per cell cycle. Both yeast and E. coli come very close to satisfying this proposed threshold; however, a greater proportion of genes in human break the one-message threshold. We speculate that this is due in part to the ad hoc nature of the essential gene classification in the context of complex multicellular organisms.CC BY-NC · PubMed Central
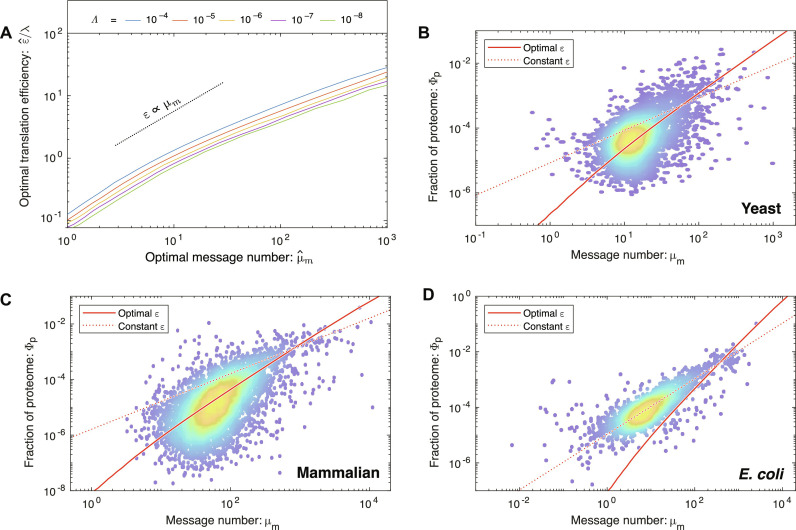
Fig. 4. How are transcription and translation balanced? (A) The RLTO model predicts load balancing. The ratio of the optimal translation efficiency (ε^ ) to the message cost (λ) is roughly independent of the relative load (Λ). The translation efficiency ε is predicted to be roughly proportional message number μm. (B) RLTO predicts the protein-message abundance relation in yeast. The observed proteome fraction is compared to two models: the RLTO optimal model (solid red line) and constant translation efficiency model (dotted red line). Both models make parameter-free predictions. The RLTO optimum predicts the global trend [data from (22)]. (C) Mammalian proteome fraction. The RLTO prediction (solid) is superior to the constant translation efficiency prediction (dashed). (D) E. coli proteome fraction. In contrast, the constant translation efficiency prediction (dashed) is superior to RLTO prediction (solid).
Fig. 4. How are transcription and translation balanced? (A) The RLTO model predicts load balancing. The ratio of the optimal translation efficiency (ε^ ) to the message cost (λ) is roughly independent of the relative load (Λ). The translation efficiency ε is predicted to be roughly proportional message number μm. (B) RLTO predicts the protein-message abundance relation in yeast. The observed proteome fraction is compared to two models: the RLTO optimal model (solid red line) and constant translation efficiency model (dotted red line). Both models make parameter-free predictions. The RLTO optimum predicts the global trend [data from (22)]. (C) Mammalian proteome fraction. The RLTO prediction (solid) is superior to the constant translation efficiency prediction (dashed). (D) E. coli proteome fraction. In contrast, the constant translation efficiency prediction (dashed) is superior to RLTO prediction (solid).CC BY-NC · PubMed Central
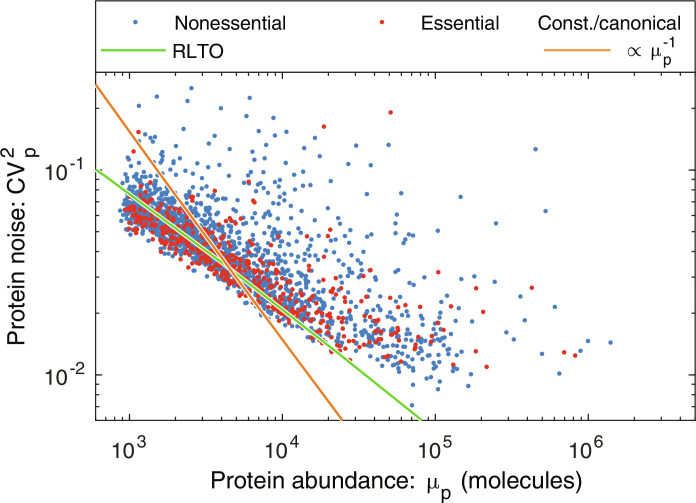
Fig. 5. RLTO predicts the magnitude of noise in yeast. The observed gene expression noise in yeast is shown for essential and nonessential genes. Two protein-message abundance models are compared to the data: the RLTO model (green) versus the constant translation efficiency (canonical model, orange). The RLTO model predicts both the magnitude of the noise and its scaling with protein abundance. The reduced slope of the RLTO model is the consequence of load balancing, which reduces the noise for the noisiest, low-expression genes [data from (8)].
Fig. 5. RLTO predicts the magnitude of noise in yeast. The observed gene expression noise in yeast is shown for essential and nonessential genes. Two protein-message abundance models are compared to the data: the RLTO model (green) versus the constant translation efficiency (canonical model, orange). The RLTO model predicts both the magnitude of the noise and its scaling with protein abundance. The reduced slope of the RLTO model is the consequence of load balancing, which reduces the noise for the noisiest, low-expression genes [data from (8)].CC BY-NC · PubMed Central
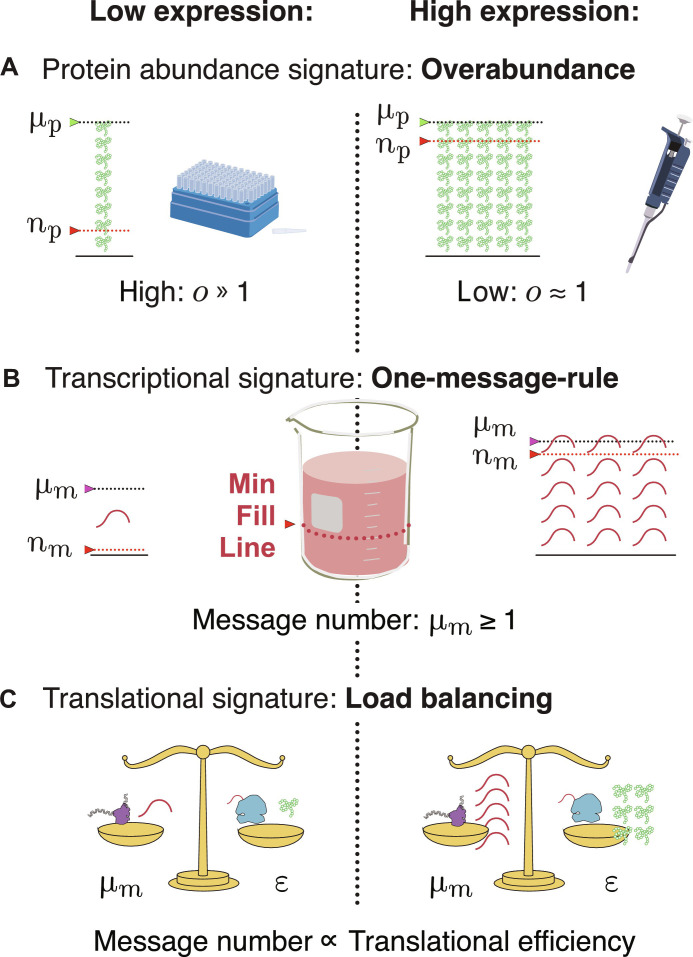
Fig. 6. Central dogma regulatory principles. (A) Overabundance. Low-expression essential genes are expressed with high overabundance, whereas high-expression essential genes are expressed with low overabundance. Laboratory supply analogy: Low-cost items that are used stochastically (e.g., pipette tips) are purchased in great excess, while the higher cost items that are less stochastic (e.g., pipette) are purchased as needed. (B) One-message rule. Robust expression of essential genes requires them to be transcribed above a threshold of one message per cell cycle. (C) Load balancing. In eukaryotic cells, optimal fitness is achieved by balancing transcription and translation: The optimal message number is proportional to the optimal translation efficiency. High (low) expression levels are achieved by high (low) levels of transcription followed by high (low) levels of translation per message.
Fig. 6. Central dogma regulatory principles. (A) Overabundance. Low-expression essential genes are expressed with high overabundance, whereas high-expression essential genes are expressed with low overabundance. Laboratory supply analogy: Low-cost items that are used stochastically (e.g., pipette tips) are purchased in great excess, while the higher cost items that are less stochastic (e.g., pipette) are purchased as needed. (B) One-message rule. Robust expression of essential genes requires them to be transcribed above a threshold of one message per cell cycle. (C) Load balancing. In eukaryotic cells, optimal fitness is achieved by balancing transcription and translation: The optimal message number is proportional to the optimal translation efficiency. High (low) expression levels are achieved by high (low) levels of transcription followed by high (low) levels of translation per message.CC BY-NC · PubMed Central

Verification

Claims the paper makes

The claims and statistics of this paper haven’t been checked yet.

Run the check — free, no account needed. It reads the open-access text and checks the sources it cites.

A few free checks a day · papers already verified open instantly · results are public

Self-check

Percentages, sums and reported differences re-computed from the paper’s own numbers.

The self-check needs the paper’s full text.

Citations

Cites

Research works printed but not linked: 67

  1. 10.1038/nature03842 · DOI · Paper page
  2. 10.1016/j.cell.2016.07.024 · DOI
  3. 10.1016/j.cell.2016.05.003 · DOI
  4. 10.1073/pnas.2001507117 · DOI
  5. J. W. Lengeler , G. Drews , H. G. Schlegel , eds., Biology of the Prokaryotes (Georg Thieme Verlag, Rüdigerstrasse 14, D-70469 Stuttgart, Germany, 1998). · DOI
  6. 2021, Cell Syst, 12, 924, 10.1016/j.cels.2021.06.002 · DOI
  7. 10.1126/science.1105891 · DOI
  8. 10.1038/nature04785 · DOI · Paper page
  9. 10.1126/science.1188308 · DOI · Paper page
  10. 10.1038/s41467-018-07391-8 · DOI · Paper page
  11. 10.1038/227561a0 · DOI · Paper page
  12. 10.1103/PhysRevLett.84.5447 · DOI
  13. 10.1103/PhysRevLett.97.168302 · DOI · Paper page
  14. 10.1126/science.1192588 · DOI · Paper page
  15. 10.1103/PhysRevLett.107.218101 · DOI
  16. 10.1128/mBio.02561-21 · DOI
  17. 2021, Cell Syst, 12, 56, 10.1016/j.cels.2020.10.011 · DOI
  18. 10.15252/msb.20209828 · DOI
  19. 10.1126/science.aac7041 · DOI · Paper page
  20. 10.1038/nature02046 · DOI · Paper page
  21. 10.1126/science.abk2066 · DOI
  22. 10.1371/journal.pbio.3001416 · DOI
  23. 10.1038/s41467-017-01242-8 · DOI
  24. 10.1371/journal.pgen.1004556 · DOI
  25. 1952, Biochim Biophys Acta, 9, 648, 10.1016/0006-3002(52)90227-8 · DOI
  26. 10.1016/J.CELL.2021.06.033 · DOI · Paper page
  27. 2022, Phys Rev E, 105, 014420
  28. 10.1096/fasebj.3.12.2676679 · DOI
  29. 10.1016/S0021-9258(18)65958-7 · DOI · Paper page
  30. 2017, Cell Syst, 5, 283, 10.1016/j.cels.2017.08.008 · DOI · Paper page
  31. 10.1016/0378-4371(92)90283-V · DOI
  32. 10.1021/j100540a008 · DOI
  33. 10.1073/pnas.112318199 · DOI
  34. 10.15252/msb.20159000 · DOI
  35. R. Phillips , J. Kondev , J. Theriot , N. Orme , Physical Biology of the Cell (Garland Science, 2013). · DOI
  36. M. Kafri , E. Metzl-Raz , F. Jonas , N. Barkai , FEMS Yeast Res 16 (2016). · DOI · Paper page
  37. 2023, Nat Commun, 14, 1762, 10.1038/s41467-023-37456-2 · DOI
  38. 2021, Reports on Progress in Physics, 84, 116601
  39. 10.1099/00221287-15-3-492 · DOI
  40. 2016, Cell Rep, 14, 22, 10.1016/j.celrep.2015.12.015 · DOI
  41. 10.1534/g3.120.401303 · DOI
  42. G. Arfken , Mathematical Methods for Physicists (Academic Press, Inc., San Diego, 1985), third edn.
  43. 10.1007/BF00337788 · DOI
  44. 10.1371/journal.pone.0015442 · DOI
  45. 10.1128/MCB.19.11.7357 · DOI · Paper page
  46. G. M. Cooper , The Cell: A Molecular Approach. 2nd edition (Sinauer Associates 2000, 2000).
  47. 10.1101/gr.1272403 · DOI
  48. 10.1093/nar/gkp889 · DOI · Paper page
  49. 10.1007/978-1-59745-321-9_12 · DOI
  50. 2019, Sci Rep, 9, 11005, 10.1038/s41598-019-47424-w · DOI
  51. 10.1016/0092-8674(77)90032-0 · DOI
  52. 10.1186/1752-0509-2-87 · DOI
  53. 10.1038/nsmb.1514 · DOI · Paper page
  54. 10.1186/1471-2164-9-574 · DOI · Paper page
  55. 10.1038/nature07341 · DOI · Paper page
  56. 10.1126/science.1260419 · DOI · Paper page
  57. 10.1038/70487 · DOI
  58. 10.1128/JB.185.19.5673-5684.2003 · DOI
  59. E. C. A. Goodall , et al., mBio 9 (2018). · DOI
  60. 10.1186/1471-2180-4-4 · DOI
  61. 10.1038/ng1807 · DOI · Paper page
  62. 10.1126/science.1070919 · DOI · Paper page
  63. 10.1073/pnas.162041399 · DOI · Paper page
  64. 1945, Bulletin of Calcutta Mathematical Society, 37, 81
  65. H. Cramer , Mathematical methods of statistics. (Princeton University Press., 1946).
  66. 2017, Cell Syst, 4, 495, 10.1016/j.cels.2017.03.003 · DOI · Paper page
  67. 2014, Scandinavian Journal of Statistics, 41, 1051, 10.1111/sjos.12083 · DOI

Metadata

Authors
Lo, T. W., Choi, H. J., Huang, D., & Wiggins, P. A.
Affiliations
University of Washington (US)
Corresponding author
Wiggins, Paul A.
Venue
Science Advances
Publisher
openRxiv
Published
2023-10-23
Volume
10
Issue
34
Pages
eado3095-eado3095
ISSN
2375-2548 (ISSN-L)
OpenAlex
W4401806214
Cited by
13
References
2
Citations by year
2026: 6 · 2025: 4 · 2024: 3
FWCI
1.77
Type
journal article
Language
en
Open access
Locations
  • Science Advances (publishedVersion, cc-by-nc)
  • bioRxiv (Cold Spring Harbor Laboratory) (acceptedVersion, cc-by-nc-nd)
  • PubMed Central (publishedVersion, cc-by-nc)
  • PubMed (publishedVersion)
  • arXiv (Cornell University) (submittedVersion, cc-by)
  • PubMed Central (submittedVersion, cc-by)
  • PubMed Central (submittedVersion, cc-by-nc-nd)
  • arXiv (Cornell University) (cc-by)
Funders
  • National Institutes of Health (5r01gm128191-03, R01-GM128191)
  • National Institute of General Medical Sciences (R01-GM128191)
Topics
  • Life Sciences › Biochemistry, Genetics and Molecular Biology › Molecular Biology › Gene Regulatory Network Analysis
  • Life Sciences › Biochemistry, Genetics and Molecular Biology › Molecular Biology › RNA and protein synthesis mechanisms
  • Life Sciences › Biochemistry, Genetics and Molecular Biology › Genetics › Bacterial Genetics and Biotechnology
Keywords
stochastic gene expression, metabolic burden, essential genes, protein abundance, mathematical model of gene regulation, fitness maximization

About these checks

Registry, retraction, Cites and statistics results are computed, not judged, with one exception: a printed reference that no index lists is read once by a model before it counts as a citation error. Claims are extracted by a model and kept only when their quote appears verbatim in the text; each cited source is then checked, with a model’s help, for whether it says what the claim relies on. Those verdicts can be wrong — read the claim’s quote and the cited source before relying on one.

Statistics and arithmetic are recomputed, not judged.

Confidence bands are shown only for fields calibrated on our annotated test set. None is calibrated yet, so no band is shown.

What counts as a claim ›How we measure confidence ›How we check this ›

Are you an author, or do you see a problem with this page? Request a review