PreprintCited by 2RNA Interference and Gene DeliveryProtein Structure and DynamicsEnzyme Structure and Function

The DOI matches its Crossref record; 1 of the 1 references it cites were found in a registry or an index.

Structure of the human systemic RNAi defective transmembrane protein 1 (hSIDT1) reveals the conformational flexibility of its lipid binding domain

Open access

Preprint — published as 10.26508/lsa.202402624

Abstract

In C. elegans , inter-cellular transport of the small non-coding RNA causing systemic RNA interference (RNAi) is mediated by the transmembrane protein SID1, encoded by the sid1 gene in the systemic RNA interference-defective ( sid ) loci. SID1 shares structural and sequence similarity with cholesterol uptake protein 1 (CHUP1) and is classified as a member of the cholesterol uptake family (ChUP). Although systemic RNAi is not an evolutionarily conserved process, the sid gene products are found across the animal kingdom, suggesting the existence of other novel gene regulatory mechanisms mediated by small non-coding RNAs. Human homologs of sid gene products – hSIDT1 and hSIDT2 – mediate contact-dependent lipophilic small non-coding dsRNA transport. Here, we report the structure of recombinant human SIDT1. We find that the extra- cytosolic domain (ECD) of hSIDT1 adopts a double jelly roll fold, and the transmembrane domain (TMD) exists as two modules – a flexible lipid binding domain (LBD) and a rigid TMD core. Our structural analyses provide insights into the inherent conformational dynamics within the lipid binding domain in cholesterol uptake (ChUP) family members.

Overview

The claims and statistics of this paper haven’t been checked yet.

Run the check — free, no account needed. It reads the open-access text and checks the sources it cites.

A few free checks a day · papers already verified open instantly · results are public

Integrity signals

Registry

Crossref · 10.1101/2023.12.21.572875

Cites

1 of 1 references verified0 citation errors · 0 not checkable

Statistics

Figures

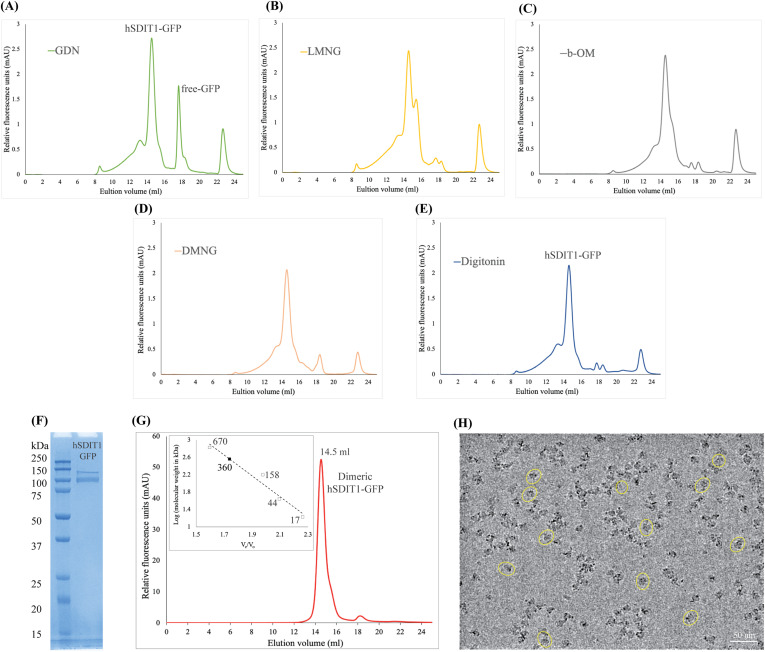
Figure S1. hSIDT1 purification and cryo-EM sample preparation. (A, B, C, D, E) Comparison of the relative solubility and homogeneity in 1% of GDN, LMNG, β-OM, DMNG, and digitonin, respectively. All the detergents were prepared in 25 mM Tris–HCl, pH 7.5, 200 mM NaCl, 1 mM PMSF, 0.8 μM aprotinin, 2 μg/ml leupeptin, and 2 μM pepstatin A. (F) SDS–PAGE (12%) showing the purity of hSIDT1-GFP. Although the estimated monomeric molecular weight of the fusion protein is ∼ 124 kD, like other eukaryotic membrane proteins, hSIDT1 displays anomalous electrophoretic mobility. (G) Intrinsic tryptophan fluorescence of purified hSIDT1-GFP was monitored in a size-exclusion chromatography experiment on a Superose 6 Increase 10/300 GL column at 0.5 ml/min flow rate. A black square on the standard plot (log of protein molecular weight (kD) versus ratio of the elution volume to the void volume (Ve/Vo)) indicates that recombinant hSIDT1-GFP fusion, which elutes at 14.5 ml corresponding to a dimer molecular weight of ∼360 kD (hSIDT1-GFP dimer + digitonin micelle). (H) Representative micrograph showing vitrified hSIDT1-GFP (yellow circles) at 1 mg/ml on UltrAuFoil holey-gold 300-mesh 1.2/1.3-μm grids, imaged using a Titan Krios G4i transmission electron microscope. The protein distribution on the grids, SDS–PAGE, and size-exclusion chromatogram indicate a monodisperse sample preparation. Scale bar is 50 nm. Source data are available for this figure.
Figure S1. hSIDT1 purification and cryo-EM sample preparation. (A, B, C, D, E) Comparison of the relative solubility and homogeneity in 1% of GDN, LMNG, β-OM, DMNG, and digitonin, respectively. All the detergents were prepared in 25 mM Tris–HCl, pH 7.5, 200 mM NaCl, 1 mM PMSF, 0.8 μM aprotinin, 2 μg/ml leupeptin, and 2 μM pepstatin A. (F) SDS–PAGE (12%) showing the purity of hSIDT1-GFP. Although the estimated monomeric molecular weight of the fusion protein is ∼ 124 kD, like other eukaryotic membrane proteins, hSIDT1 displays anomalous electrophoretic mobility. (G) Intrinsic tryptophan fluorescence of purified hSIDT1-GFP was monitored in a size-exclusion chromatography experiment on a Superose 6 Increase 10/300 GL column at 0.5 ml/min flow rate. A black square on the standard plot (log of protein molecular weight (kD) versus ratio of the elution volume to the void volume (Ve/Vo)) indicates that recombinant hSIDT1-GFP fusion, which elutes at 14.5 ml corresponding to a dimer molecular weight of ∼360 kD (hSIDT1-GFP dimer + digitonin micelle). (H) Representative micrograph showing vitrified hSIDT1-GFP (yellow circles) at 1 mg/ml on UltrAuFoil holey-gold 300-mesh 1.2/1.3-μm grids, imaged using a Titan Krios G4i transmission electron microscope. The protein distribution on the grids, SDS–PAGE, and size-exclusion chromatogram indicate a monodisperse sample preparation. Scale bar is 50 nm. Source data are available for this figure.CC BY · PubMed Central
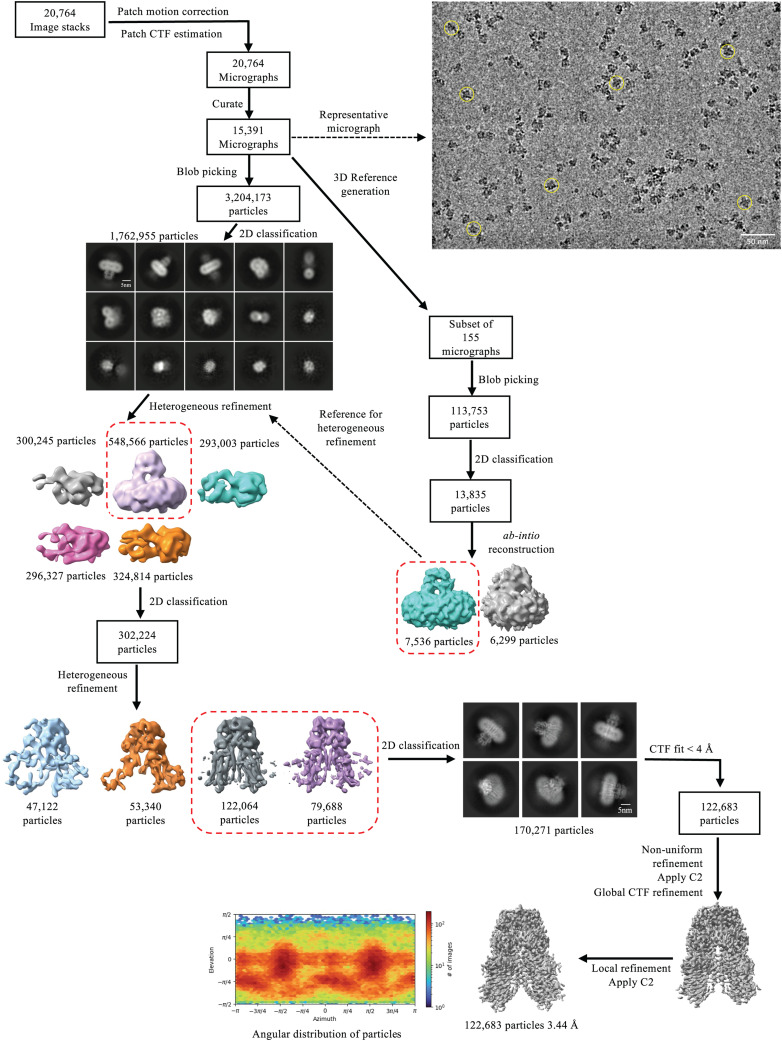
Figure S2. Data processing workflow of hSIDT1-GFP cryo-EM data. The data were processed using CryoSPARC (v 4.2.1) (41). On the top right, a representative motion-corrected micrograph with hSIDT1-GFP particles (yellow circles) is highlighted. A subset of 155 motion-corrected micrographs was selected, and particles were picked by the blob picker and cleaned by iterative 2D classification to generate a low-resolution ab initio reconstruction to be used as a reference input for heterogeneous refinement of the entire dataset (dashed box and arrow). Briefly, ∼3.2 million particles were picked by the blob picker, cleaned by 2D classification, and sorted further by heterogeneous refinement. ∼548,000 particles from the best class (dashed box) in this heterogeneous refinement were further cleaned up by iterative 2D classification. ∼302,000 particles were re-extracted, unbinned in a 360 px box, and sorted further by iterative heterogeneous refinement and 2D classification jobs. The resultant set of 170,000 clean particles was re-extracted from micrographs with a CTF fit <4 Å to yield a final stack of about 122,000 particles. C2 symmetry was applied at this stage, and non-uniform and CTF refinements were performed to obtain a final map at 3.44 Å (42). Sharpened and unsharpened maps from this job were used for model building and analyzing the structure of hSIDT1-GFP. The final 3D model was validated using the sharpened map for deposition.
Figure S2. Data processing workflow of hSIDT1-GFP cryo-EM data. The data were processed using CryoSPARC (v 4.2.1) (41). On the top right, a representative motion-corrected micrograph with hSIDT1-GFP particles (yellow circles) is highlighted. A subset of 155 motion-corrected micrographs was selected, and particles were picked by the blob picker and cleaned by iterative 2D classification to generate a low-resolution ab initio reconstruction to be used as a reference input for heterogeneous refinement of the entire dataset (dashed box and arrow). Briefly, ∼3.2 million particles were picked by the blob picker, cleaned by 2D classification, and sorted further by heterogeneous refinement. ∼548,000 particles from the best class (dashed box) in this heterogeneous refinement were further cleaned up by iterative 2D classification. ∼302,000 particles were re-extracted, unbinned in a 360 px box, and sorted further by iterative heterogeneous refinement and 2D classification jobs. The resultant set of 170,000 clean particles was re-extracted from micrographs with a CTF fit <4 Å to yield a final stack of about 122,000 particles. C2 symmetry was applied at this stage, and non-uniform and CTF refinements were performed to obtain a final map at 3.44 Å (42). Sharpened and unsharpened maps from this job were used for model building and analyzing the structure of hSIDT1-GFP. The final 3D model was validated using the sharpened map for deposition.CC BY · PubMed Central
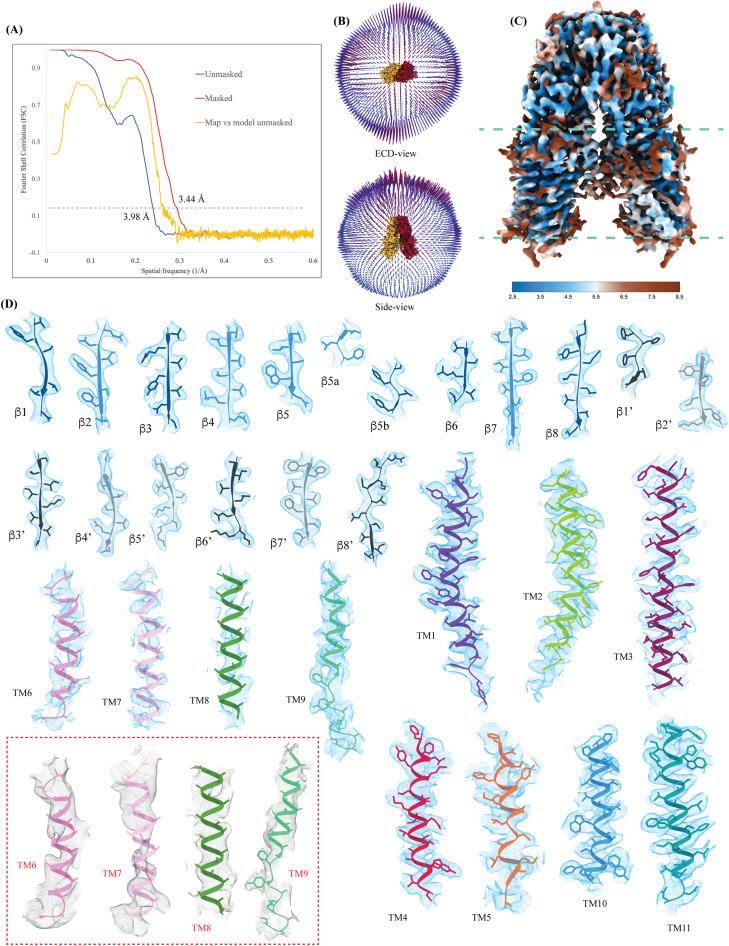
Figure S3. Cryo-EM map quality and model building. (A) Cross-validation Fourier shell correlation (FSC) curves for the final masked hSIDT1-GFP (red) and unmasked (blue) refinement maps and the model versus final unmasked map (yellow). The gray dashed line indicates the FSC0.143 threshold. FSC curves were calculated using Phenix’s Mtriage (43). (B) Angular distribution of the particles used in the final reconstruction in the ECD and side view. (C) Estimated local resolution of the final C2 refined map (isosurface threshold level of 0.14 in ChimeraX). (D) Cryo-EM density of all the secondary structure elements is shown in light blue at an isosurface threshold level of 0.25 for the ECD region and 0.1 for the TMD region in ChimeraX (44). Side chains for almost all the elements could be modeled unambiguously into the density except for TMs6–8 and the extra-cytosolic half of TM9. In these regions, the Cα traces were placed using an unsharpened map (red dashed box), and the side chains were trimmed to Cβ. The ECD was modeled into the density using ModelAngelo (45). The AlphaFold model of hSIDT1 (UniProt ID: Q9NXL6) was used to build the TMD core, and TMs5–9 were manually built using Coot (46, 47).
Figure S3. Cryo-EM map quality and model building. (A) Cross-validation Fourier shell correlation (FSC) curves for the final masked hSIDT1-GFP (red) and unmasked (blue) refinement maps and the model versus final unmasked map (yellow). The gray dashed line indicates the FSC0.143 threshold. FSC curves were calculated using Phenix’s Mtriage (43). (B) Angular distribution of the particles used in the final reconstruction in the ECD and side view. (C) Estimated local resolution of the final C2 refined map (isosurface threshold level of 0.14 in ChimeraX). (D) Cryo-EM density of all the secondary structure elements is shown in light blue at an isosurface threshold level of 0.25 for the ECD region and 0.1 for the TMD region in ChimeraX (44). Side chains for almost all the elements could be modeled unambiguously into the density except for TMs6–8 and the extra-cytosolic half of TM9. In these regions, the Cα traces were placed using an unsharpened map (red dashed box), and the side chains were trimmed to Cβ. The ECD was modeled into the density using ModelAngelo (45). The AlphaFold model of hSIDT1 (UniProt ID: Q9NXL6) was used to build the TMD core, and TMs5–9 were manually built using Coot (46, 47).CC BY · PubMed Central
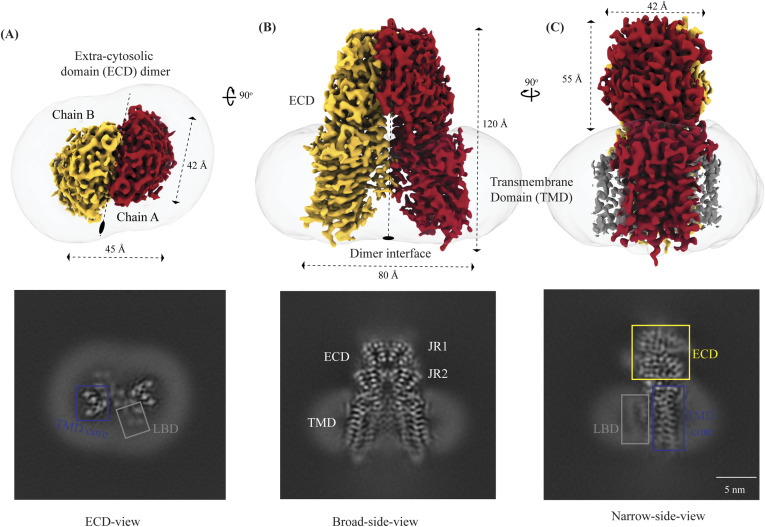
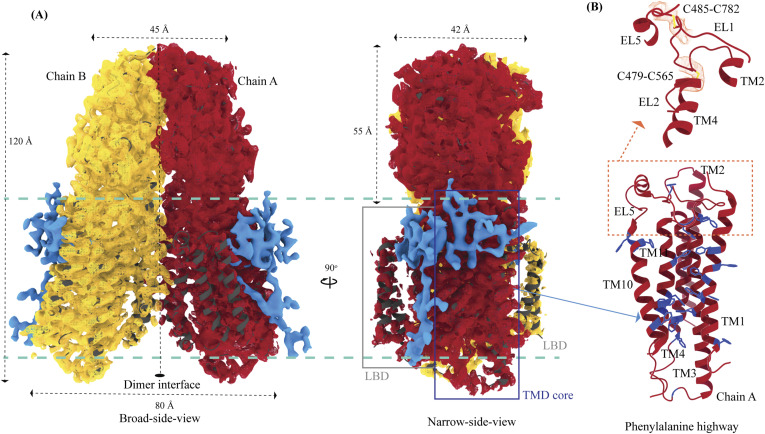
Figure 1. Cryo-EM structure of the hSIDT1 dimer. (A, B, C) show the extra-cytosolic domain view, broad side view, and narrow side view, respectively, of the ∼3.4 Å cryo-EM map of the hSIDT1 dimer. Chains A and B are displayed in red and yellow, respectively, at an isosurface threshold level of 0.14 in ChimeraX (44). The non-contiguous density of lipid binding domain (LBD) is highlighted as a gray mesh in panel (C). Micelle is shown in transparent gray. The bottom half of panels A-C shows cross-sections of the final 3D map from CryoSPARC, in three views, displayed using IMOD, indicating the poor resolution of the lipid binding domain (gray box) compared with the transmembrane domain core (blue box) or ECD (41, 48).
Figure 1. Cryo-EM structure of the hSIDT1 dimer. (A, B, C) show the extra-cytosolic domain view, broad side view, and narrow side view, respectively, of the ∼3.4 Å cryo-EM map of the hSIDT1 dimer. Chains A and B are displayed in red and yellow, respectively, at an isosurface threshold level of 0.14 in ChimeraX (44). The non-contiguous density of lipid binding domain (LBD) is highlighted as a gray mesh in panel (C). Micelle is shown in transparent gray. The bottom half of panels A-C shows cross-sections of the final 3D map from CryoSPARC, in three views, displayed using IMOD, indicating the poor resolution of the lipid binding domain (gray box) compared with the transmembrane domain core (blue box) or ECD (41, 48).CC BY · PubMed Central
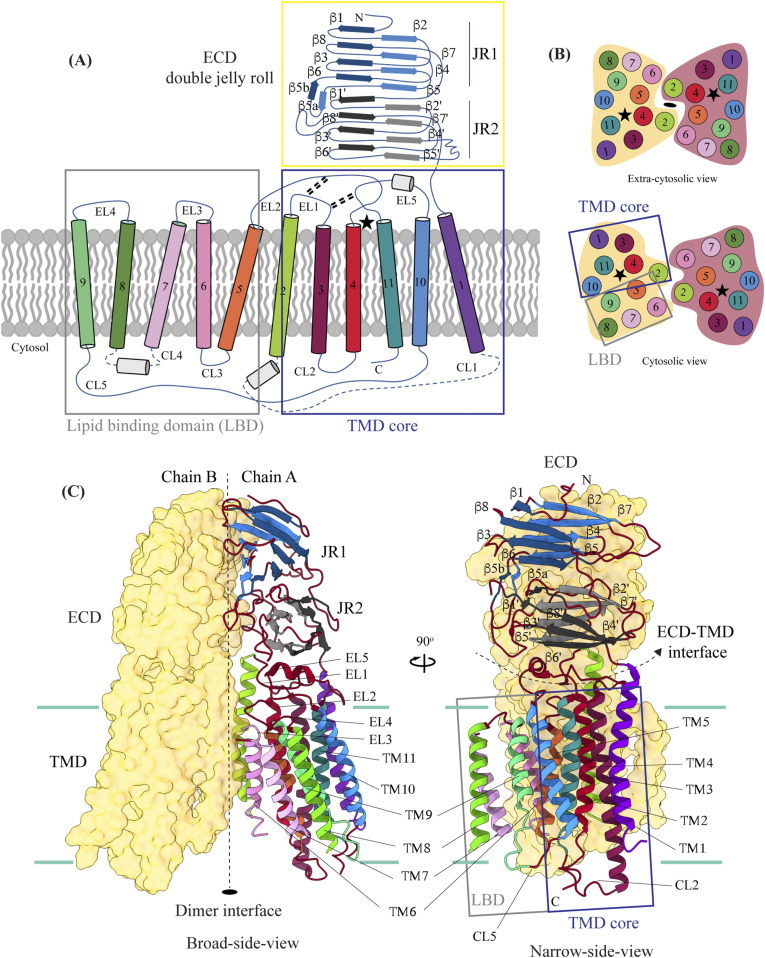
Figure 2. Topology and architecture of hSIDT1. (A) 2D topology of the ChUP family of proteins. Transmembrane helices (TMs) that form the LBD are highlighted in a gray box, the TMs that form the TMD core in a blue box, and the ECD in a yellow box. The ECD forms a double jelly roll where each jelly roll (JR1 and JR2) is a β-sandwich made of two 4-stranded antiparallel β-sheets. The cytosolic loops (CLs) and the extra-cytosolic loops (ELs) are numbered based on the primary structure. (B) TMD dimer is depicted as a cartoon, showing the TM arrangement as seen from extra-cytosolic side and the cytosol. The star indicates the metal ion binding site. (C) Two side views of hSIDT1 highlight the dimer interface and ECD-TMD interface. Chain B is displayed as a surface, and chain A is shown as a cartoon with β-strands and TMs colored as they are in the topology diagram. The twofold rotation axis is displayed as a dashed line with an ellipsoid.
Figure 2. Topology and architecture of hSIDT1. (A) 2D topology of the ChUP family of proteins. Transmembrane helices (TMs) that form the LBD are highlighted in a gray box, the TMs that form the TMD core in a blue box, and the ECD in a yellow box. The ECD forms a double jelly roll where each jelly roll (JR1 and JR2) is a β-sandwich made of two 4-stranded antiparallel β-sheets. The cytosolic loops (CLs) and the extra-cytosolic loops (ELs) are numbered based on the primary structure. (B) TMD dimer is depicted as a cartoon, showing the TM arrangement as seen from extra-cytosolic side and the cytosol. The star indicates the metal ion binding site. (C) Two side views of hSIDT1 highlight the dimer interface and ECD-TMD interface. Chain B is displayed as a surface, and chain A is shown as a cartoon with β-strands and TMs colored as they are in the topology diagram. The twofold rotation axis is displayed as a dashed line with an ellipsoid.CC BY · PubMed Central
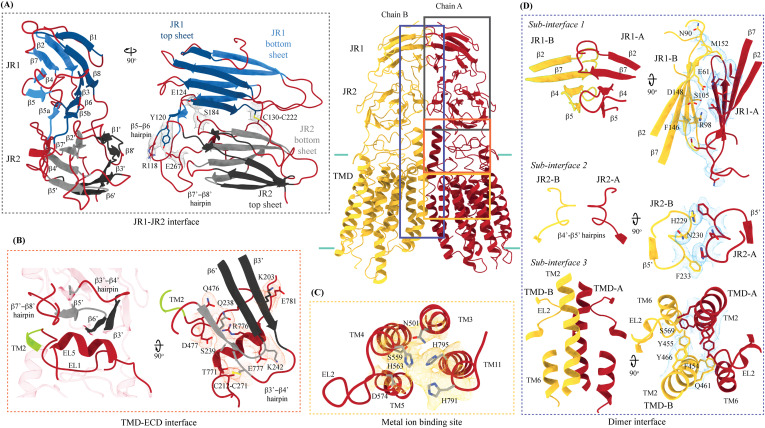
Figure 3. Inter-chain and intra-chain interactions of hSIDT1. Chains A and B are displayed in red and yellow, respectively, at the center. The lipid bilayer is highlighted as cyan bars. (A, B, C, D) Regions highlighted in the panels (A, B, C, D) have been indicated on the overall structure with boxes—gray for the JR1-JR2 interface, yellow for the metal ion binding site, orange for the ECD-TMD interface, and blue for the dimer interface. The densities for interactions have been displayed in colors that match their inset highlights (isosurface threshold level of 0.25 for the ECD region and 0.1 for the TMD region in ChimeraX). (A) Double jelly roll arrangement of the ECD and the interactions that stabilize JR1 atop JR2. (B) Interaction of JR2 with the ECD face of the TMD core allows the ECD to seclude the TMD core from the extra-cytosolic space. (C) Ensconced within the TMD core is the evolutionarily conserved metal ion binding site, which is highlighted in yellow. Side chains of amino acids that carve the metal coordination site have been highlighted. (D) Three sub-interfaces of the dimer interface, each made by JR1, JR2, and TMD, respectively, have been highlighted in the blue inset.
Figure 3. Inter-chain and intra-chain interactions of hSIDT1. Chains A and B are displayed in red and yellow, respectively, at the center. The lipid bilayer is highlighted as cyan bars. (A, B, C, D) Regions highlighted in the panels (A, B, C, D) have been indicated on the overall structure with boxes—gray for the JR1-JR2 interface, yellow for the metal ion binding site, orange for the ECD-TMD interface, and blue for the dimer interface. The densities for interactions have been displayed in colors that match their inset highlights (isosurface threshold level of 0.25 for the ECD region and 0.1 for the TMD region in ChimeraX). (A) Double jelly roll arrangement of the ECD and the interactions that stabilize JR1 atop JR2. (B) Interaction of JR2 with the ECD face of the TMD core allows the ECD to seclude the TMD core from the extra-cytosolic space. (C) Ensconced within the TMD core is the evolutionarily conserved metal ion binding site, which is highlighted in yellow. Side chains of amino acids that carve the metal coordination site have been highlighted. (D) Three sub-interfaces of the dimer interface, each made by JR1, JR2, and TMD, respectively, have been highlighted in the blue inset.CC BY · PubMed Central
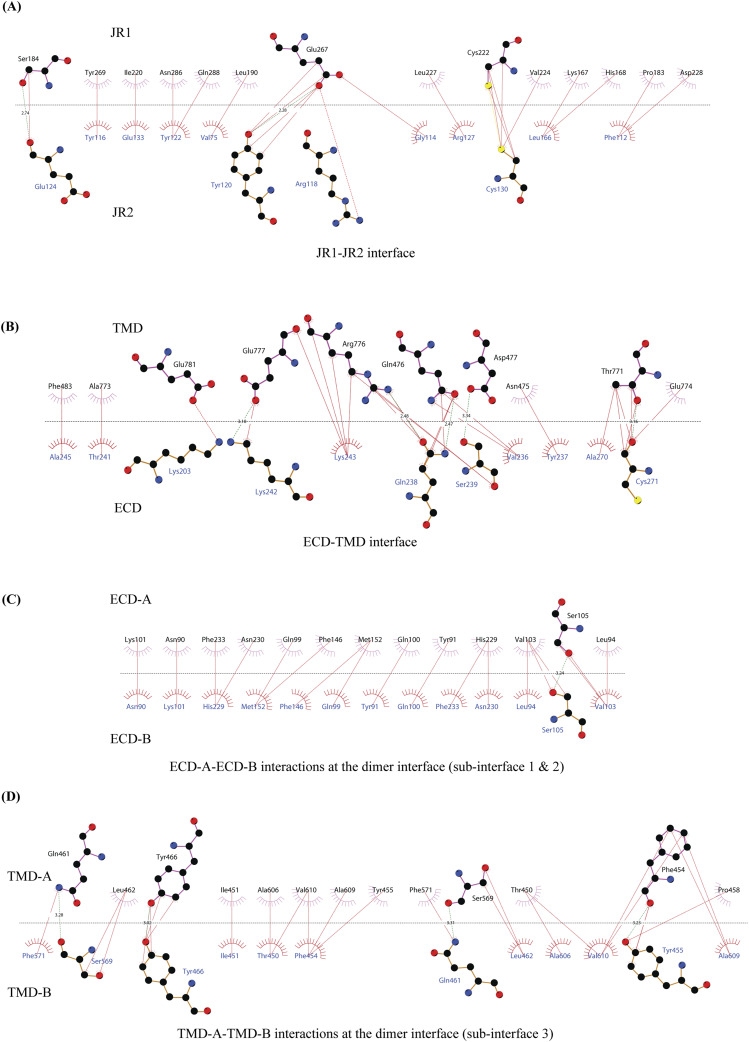
Figure S4. 2D plots of the critical inter-chain and intra-chain interactions. (A, B, C, D) LigPlot+ was used to generate the 2D depictions of the interactions (<4.5 Å) at the (A) JR1-JR2 interface, (B) ECD-TMD interface, and (C, D) dimer interface (49). Hydrogen bonds are depicted by dashed lines, critical residues are shown as ball-and-stick models, and amino acids involved in the non-bonded interactions are indicated as eyelashes. The sulfurs of disulfides are highlighted in yellow.
Figure S4. 2D plots of the critical inter-chain and intra-chain interactions. (A, B, C, D) LigPlot+ was used to generate the 2D depictions of the interactions (<4.5 Å) at the (A) JR1-JR2 interface, (B) ECD-TMD interface, and (C, D) dimer interface (49). Hydrogen bonds are depicted by dashed lines, critical residues are shown as ball-and-stick models, and amino acids involved in the non-bonded interactions are indicated as eyelashes. The sulfurs of disulfides are highlighted in yellow.CC BY · PubMed Central
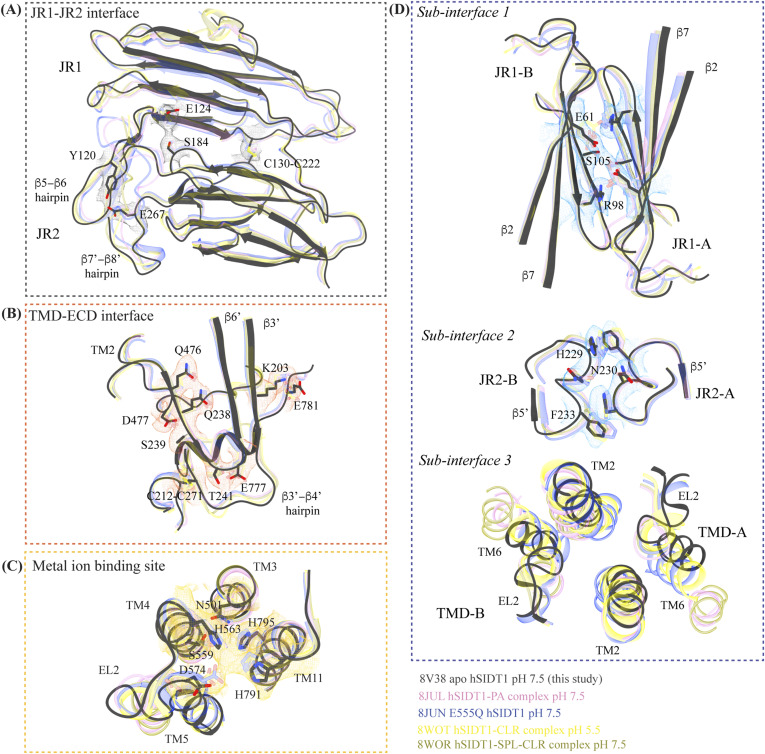
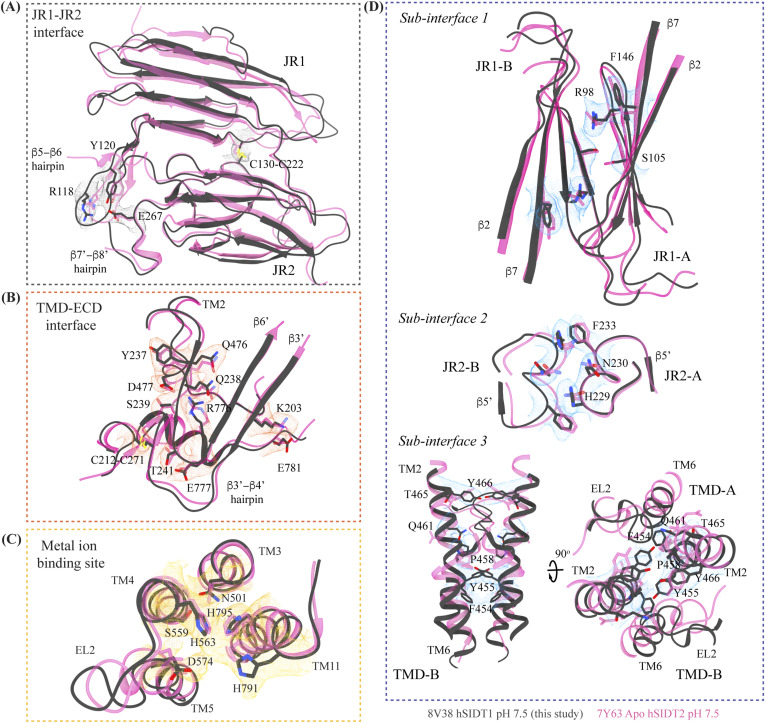
Figure S5. Comparison of inter-chain and intra-chain interactions between different hSIDT1 structures. (A, B, C, D) Here, we compared (A) JR1-JR2 interface (gray box), (B) TMD-ECD interface (orange box), (C) metal ion binding site (yellow box), and (D) dimer interface (blue box) of the hSIDT1 structure obtained in different conditions—8V38 (apo-hSIDT1 at pH 7.5; gray), 8JUL (hSIDT1-PA complex at pH 7.5; pink), 8JUN (E555Q-hSIDT1 at pH 7.5; blue), 8WOT (hSIDT1-CLR at pH 5.5; yellow), 8WOR (hSIDT1-SPL-CLR at pH 7.5; green). The amino acids involved in hydrogen bonding and ring stacking interactions at the interfaces are highlighted. The densities for these amino acids in 8V38 have been displayed in colors that match their insets (isosurface threshold level of 0.25 for the ECD region and 0.1 for the TMD region in ChimeraX). We notice that the differences in the elements that form these interfaces lie primarily within the TMD at sub-interface 3.
Figure S5. Comparison of inter-chain and intra-chain interactions between different hSIDT1 structures. (A, B, C, D) Here, we compared (A) JR1-JR2 interface (gray box), (B) TMD-ECD interface (orange box), (C) metal ion binding site (yellow box), and (D) dimer interface (blue box) of the hSIDT1 structure obtained in different conditions—8V38 (apo-hSIDT1 at pH 7.5; gray), 8JUL (hSIDT1-PA complex at pH 7.5; pink), 8JUN (E555Q-hSIDT1 at pH 7.5; blue), 8WOT (hSIDT1-CLR at pH 5.5; yellow), 8WOR (hSIDT1-SPL-CLR at pH 7.5; green). The amino acids involved in hydrogen bonding and ring stacking interactions at the interfaces are highlighted. The densities for these amino acids in 8V38 have been displayed in colors that match their insets (isosurface threshold level of 0.25 for the ECD region and 0.1 for the TMD region in ChimeraX). We notice that the differences in the elements that form these interfaces lie primarily within the TMD at sub-interface 3.CC BY · PubMed Central
Figure S6. Comparison of inter-chain and intra-chain interactions between hSIDT1 and hSIDT2. (A, B, C, D) Here, we compared (A) JR1-JR2 interface (gray box), (B) TMD-ECD interface (orange box), (C) metal ion binding site (yellow box), and (D) dimer interface (blue box) of hSIDT1 (8V38; gray) and hSIDT2 (7Y63; dark pink). The densities for 8V38 at these interfaces have been displayed in colors that match their insets (isosurface threshold level of 0.25 for the ECD region and 0.1 for the TMD region in ChimeraX). We notice that the residues involved in hydrogen bonding and ring stacking interactions at these interfaces are conserved between hSIDT1 and hSIDT2, and their positions change only in the TMD at sub-interface 3.
Figure S6. Comparison of inter-chain and intra-chain interactions between hSIDT1 and hSIDT2. (A, B, C, D) Here, we compared (A) JR1-JR2 interface (gray box), (B) TMD-ECD interface (orange box), (C) metal ion binding site (yellow box), and (D) dimer interface (blue box) of hSIDT1 (8V38; gray) and hSIDT2 (7Y63; dark pink). The densities for 8V38 at these interfaces have been displayed in colors that match their insets (isosurface threshold level of 0.25 for the ECD region and 0.1 for the TMD region in ChimeraX). We notice that the residues involved in hydrogen bonding and ring stacking interactions at these interfaces are conserved between hSIDT1 and hSIDT2, and their positions change only in the TMD at sub-interface 3.CC BY · PubMed Central
Figure 4. Potential lipid binding sites. (A) Ordered lipid or detergent density observed in the final cryo-EM map is displayed in blue, and density for chains A and B is shown in red and yellow, respectively (isosurface threshold level of 0.12 of the C2 refine map as mesh in ChimeraX). We have not modeled either lipid or digitonin in the blue density because we observe relatively poor local resolution for LBD and the LBD-TMD core interface. (B) TMD core harbors the phenylalanine highway and metal ion binding site. Highlighted in blue are the phenylalanine residues, primarily from TM11 and TM1, that indicate the presence of phenylalanine highway motif in hSIDT1, as observed in other cholesterol transporters such as ABCG1, NPC1, and PTCH1. The dashed orange inset highlights the disulfides that stabilize EL1, EL2, and EL5 of the TMD core toward the ECD-TMD interface.
Figure 4. Potential lipid binding sites. (A) Ordered lipid or detergent density observed in the final cryo-EM map is displayed in blue, and density for chains A and B is shown in red and yellow, respectively (isosurface threshold level of 0.12 of the C2 refine map as mesh in ChimeraX). We have not modeled either lipid or digitonin in the blue density because we observe relatively poor local resolution for LBD and the LBD-TMD core interface. (B) TMD core harbors the phenylalanine highway and metal ion binding site. Highlighted in blue are the phenylalanine residues, primarily from TM11 and TM1, that indicate the presence of phenylalanine highway motif in hSIDT1, as observed in other cholesterol transporters such as ABCG1, NPC1, and PTCH1. The dashed orange inset highlights the disulfides that stabilize EL1, EL2, and EL5 of the TMD core toward the ECD-TMD interface.CC BY · PubMed Central
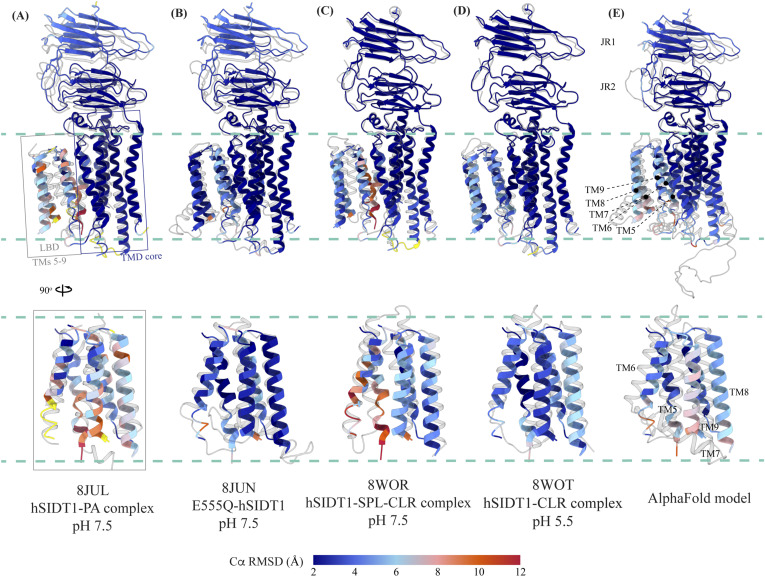
Figure 5. Comparison of intra-chain dynamics in various hSIDT1 structures. We used sequence-based pairwise alignment in ChimeraX to color hSIDT1 structure in this study using the Cα RMSD obtained upon aligning it with various structures (Table S2). The TMD core of chain A from all the structures was used for alignments. The color key denotes the range of Cα RMSD of the pairwise alignments, with blue for the lowest RMSD, red for the highest, and yellow for regions missing from the alignment. (A, B, C, D) Each of the panels shows chain A of apo-hSIDT1 (8V38) colored based on the RMSDs of alignments with the (A) hSIDT1-PA complex at pH 7.5 (8JUL), (B) E555Q-hSIDT1 at pH 7.5 (8JUN), (C) hSIDT1-SPL-CLR complex at pH 7.5 (8WOR), and (D) hSIDT1-CLR complex at pH 5.5 (8WOT). (E) shows superposition with the AlphaFold model of hSIDT1 (33, 34). All the structures used for superposition with apo-hSIDT1 (8V38) have been displayed in gray with their respective PDB IDs indicated below each panel. Based on the alignments, the LBD dynamics do not appear to be determined by CLR binding or change in pH.
Figure 5. Comparison of intra-chain dynamics in various hSIDT1 structures. We used sequence-based pairwise alignment in ChimeraX to color hSIDT1 structure in this study using the Cα RMSD obtained upon aligning it with various structures (Table S2). The TMD core of chain A from all the structures was used for alignments. The color key denotes the range of Cα RMSD of the pairwise alignments, with blue for the lowest RMSD, red for the highest, and yellow for regions missing from the alignment. (A, B, C, D) Each of the panels shows chain A of apo-hSIDT1 (8V38) colored based on the RMSDs of alignments with the (A) hSIDT1-PA complex at pH 7.5 (8JUL), (B) E555Q-hSIDT1 at pH 7.5 (8JUN), (C) hSIDT1-SPL-CLR complex at pH 7.5 (8WOR), and (D) hSIDT1-CLR complex at pH 5.5 (8WOT). (E) shows superposition with the AlphaFold model of hSIDT1 (33, 34). All the structures used for superposition with apo-hSIDT1 (8V38) have been displayed in gray with their respective PDB IDs indicated below each panel. Based on the alignments, the LBD dynamics do not appear to be determined by CLR binding or change in pH.CC BY · PubMed Central
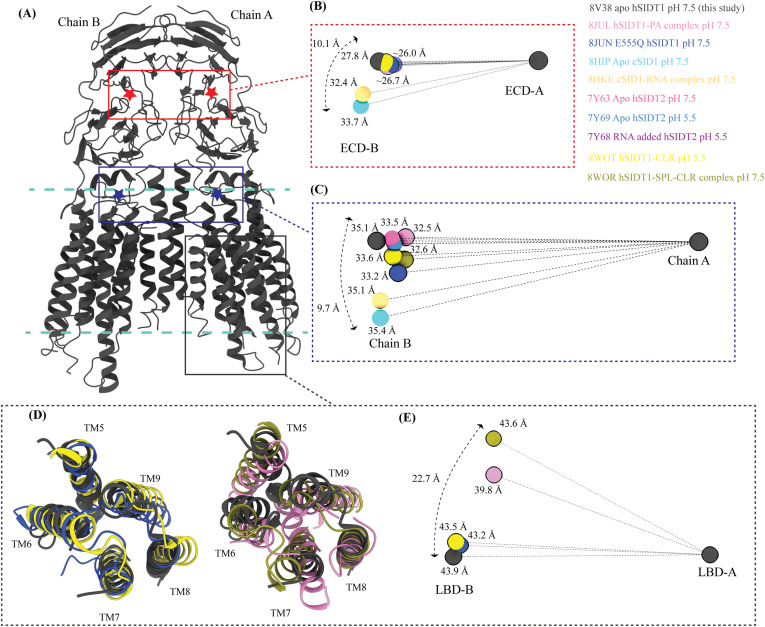
Figure 6. Inter-chain dynamics in hSIDT1. (A) hSIDT1 dimer (gray) with ECD (red star) center of masses (COMs) and full chain COMs (blue star) highlighted by red and blue boxes. (B, C, E) Distances on the spheres in panels (B, C, E) denote the distances of COMs of the regions being compared in chain B (ECD-B and LBD-B) from COMs of that region in superposed chain A (ECD-A and LBD-A). The spheres representing all SIDT1 structures have been highlighted with a black border. The double-ended arrow denotes the distance chain B COM of that region has moved relative to 8V38 (gray sphere) chain B COM, when chain As of the structures were superposed. (B) Relative position of the COMs of chain B ECDs of the homologs compared with hSIDT1 from this study (8V38; gray sphere). The relative positions of these COMs were calculated by superposing the chain A ECDs of all the homologs. (C) Relative position of the COMs of the entire chain B of the homologs compared with COM of chain B of 8V38 was calculated by superposing the chain A of all the homologs. In panels (B, C, E), only 8V38 chain A COM is displayed for clarity. (D, E) are ECD views of LBDs of various hSIDT1 structures. In panel (D), we see superpositions of the LBDs of chain A of various hSIDT1 structures. In panel (E), the center of masses of LBD regions of chain B (LBD-B) of hSIDT1 structures is compared upon superposition of the LBD of chain A (LBD-A). Relative to the LBD-A, the phospholipid-bound hSIDT1 structures, 8JUL and 8WOR, show the highest outward motion from the plane of the dimer.
Figure 6. Inter-chain dynamics in hSIDT1. (A) hSIDT1 dimer (gray) with ECD (red star) center of masses (COMs) and full chain COMs (blue star) highlighted by red and blue boxes. (B, C, E) Distances on the spheres in panels (B, C, E) denote the distances of COMs of the regions being compared in chain B (ECD-B and LBD-B) from COMs of that region in superposed chain A (ECD-A and LBD-A). The spheres representing all SIDT1 structures have been highlighted with a black border. The double-ended arrow denotes the distance chain B COM of that region has moved relative to 8V38 (gray sphere) chain B COM, when chain As of the structures were superposed. (B) Relative position of the COMs of chain B ECDs of the homologs compared with hSIDT1 from this study (8V38; gray sphere). The relative positions of these COMs were calculated by superposing the chain A ECDs of all the homologs. (C) Relative position of the COMs of the entire chain B of the homologs compared with COM of chain B of 8V38 was calculated by superposing the chain A of all the homologs. In panels (B, C, E), only 8V38 chain A COM is displayed for clarity. (D, E) are ECD views of LBDs of various hSIDT1 structures. In panel (D), we see superpositions of the LBDs of chain A of various hSIDT1 structures. In panel (E), the center of masses of LBD regions of chain B (LBD-B) of hSIDT1 structures is compared upon superposition of the LBD of chain A (LBD-A). Relative to the LBD-A, the phospholipid-bound hSIDT1 structures, 8JUL and 8WOR, show the highest outward motion from the plane of the dimer.CC BY · PubMed Central
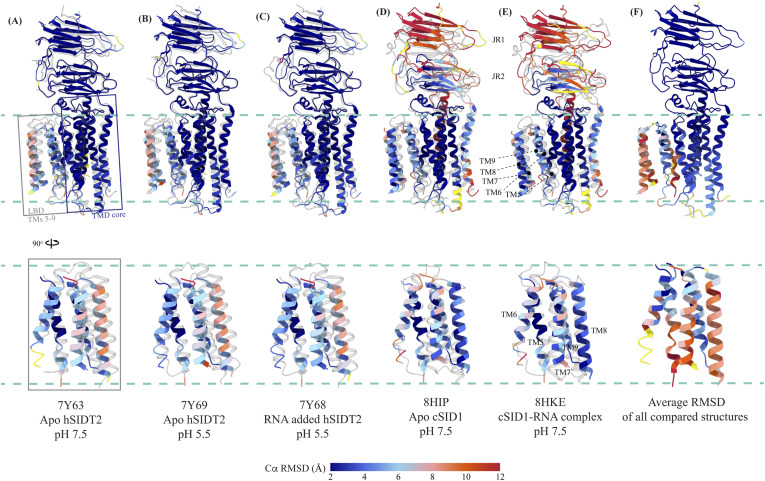
Figure S7. Comparison of intra-chain dynamics of hSIDT1, hSIDT2, and cSID1 cryo-EM structures. The panels (A, B, C, D, E) show chain A of apo-hSIDT1 (8V38) colored by Cα RMSD (blue-to-red) obtained upon alignment with chain A of hSIDT2 or cSID1 structures. Yellow regions represent regions missing from the alignment. The bottom half of each panel shows only the LBD region. The structures compared with hSIDT1 in each panel are displayed in gray, and the respective PDB IDs are indicated below each panel. (F) represents chain A of 8V38 colored by average Cα RMSD obtained upon all-versus-all alignment with chain A of all the hSIDT1, hSIDT2, and cSID1 structures compared in this article. Superpositions were performed using sequence-based pairwise alignment in ChimeraX.
Figure S7. Comparison of intra-chain dynamics of hSIDT1, hSIDT2, and cSID1 cryo-EM structures. The panels (A, B, C, D, E) show chain A of apo-hSIDT1 (8V38) colored by Cα RMSD (blue-to-red) obtained upon alignment with chain A of hSIDT2 or cSID1 structures. Yellow regions represent regions missing from the alignment. The bottom half of each panel shows only the LBD region. The structures compared with hSIDT1 in each panel are displayed in gray, and the respective PDB IDs are indicated below each panel. (F) represents chain A of 8V38 colored by average Cα RMSD obtained upon all-versus-all alignment with chain A of all the hSIDT1, hSIDT2, and cSID1 structures compared in this article. Superpositions were performed using sequence-based pairwise alignment in ChimeraX.CC BY · PubMed Central
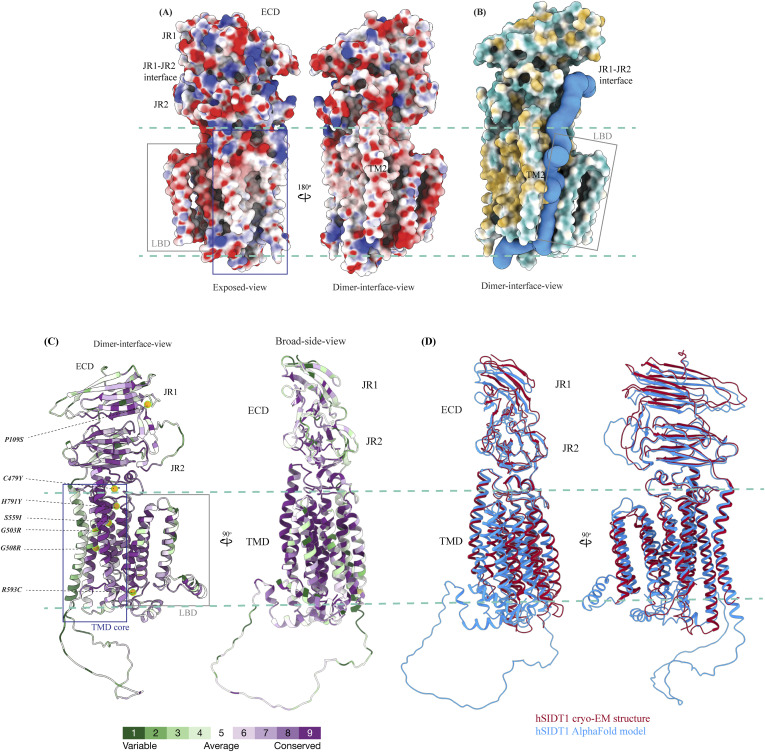
Figure S8. Electrostatic potential, hydrophobicity, and sequence conservation of hSIDT1. (A) Electrostatic potential and surface charge representation of the hSIDT1 protomer. The display is contoured on the potential from −10 kT (red) to +10 kT (blue). The exposed surface of the ECD, especially the JR1-JR2 interface, shows a high density of basic residues conducive to RNA binding. The dimer interface of the TMD is lined with uncharged polar residues. (B) Surface representation of the hSIDT1 protomer colored based on hydrophobic (orange) and hydrophilic (cyan) amino acids. In blue is the channel representing a potential path of RNA transport, which was predicted by the MOLEonline server using a proven radius of 20 Å (50). (C) hSIDT1 AlphaFold model (Q9NXL6) colored according to evolutionary sequence conservation scores generated by ConSurf webserver using homologs identified by PSI-BLAST and aligned by Clustal (51). Equivalent mutations that attenuate systemic RNAi mediated by SID1 in C. elegans are highlighted as orange spheres. All of these mutations occur in the conserved regions of hSIDT1 and lie either in the path of the channel predicted by the MOLEonline server or in the vicinity of the metal ion coordination site. (D) Superposition of the hSIDT1 cryo-EM structure and the AlphaFold model showing that the predicted differences lie primarily in JR1 and LBD regions of the proteins as observed in the comparisons using experimentally determined structures of hSIDT1, hSIDT2, and C. elegans SID1.
Figure S8. Electrostatic potential, hydrophobicity, and sequence conservation of hSIDT1. (A) Electrostatic potential and surface charge representation of the hSIDT1 protomer. The display is contoured on the potential from −10 kT (red) to +10 kT (blue). The exposed surface of the ECD, especially the JR1-JR2 interface, shows a high density of basic residues conducive to RNA binding. The dimer interface of the TMD is lined with uncharged polar residues. (B) Surface representation of the hSIDT1 protomer colored based on hydrophobic (orange) and hydrophilic (cyan) amino acids. In blue is the channel representing a potential path of RNA transport, which was predicted by the MOLEonline server using a proven radius of 20 Å (50). (C) hSIDT1 AlphaFold model (Q9NXL6) colored according to evolutionary sequence conservation scores generated by ConSurf webserver using homologs identified by PSI-BLAST and aligned by Clustal (51). Equivalent mutations that attenuate systemic RNAi mediated by SID1 in C. elegans are highlighted as orange spheres. All of these mutations occur in the conserved regions of hSIDT1 and lie either in the path of the channel predicted by the MOLEonline server or in the vicinity of the metal ion coordination site. (D) Superposition of the hSIDT1 cryo-EM structure and the AlphaFold model showing that the predicted differences lie primarily in JR1 and LBD regions of the proteins as observed in the comparisons using experimentally determined structures of hSIDT1, hSIDT2, and C. elegans SID1.CC BY · PubMed Central

Verification

Claims the paper makes

The claims and statistics of this paper haven’t been checked yet.

Run the check — free, no account needed. It reads the open-access text and checks the sources it cites.

A few free checks a day · papers already verified open instantly · results are public

Self-check

Percentages, sums and reported differences re-computed from the paper’s own numbers.

The self-check needs the paper’s full text.

Citations

Cites

Research works printed but not linked: 64

  1. 10.1038/35888 · DOI · Paper page
  2. 10.1126/science.282.5388.430 · DOI
  3. 10.1038/27579 · DOI
  4. 10.1161/CIRCRESAHA.117.311311 · DOI
  5. 10.3389/fphar.2019.00444 · DOI
  6. 10.1186/s13036-018-0130-7 · DOI
  7. 10.1016/j.trsl.2019.07.002 · DOI
  8. 10.1038/s41580- · DOI
  9. 10.1111/imb.12222 · DOI
  10. 10.1146/annurev.genet.41.110306.130216 · DOI
  11. 10.1126/science.1068836 · DOI
  12. 10.1101/sqb.2006.71.060 · DOI
  13. 10.1038/s41422-020-0389-3 · DOI
  14. 10.1038/s41422-020-0389-3 · DOI
  15. 10.1194/jlr.M073817 · DOI
  16. 10.1371/journal.pone.0066139 · DOI
  17. 2015, Lysosomal integral membrane protein Sidt2 plays a vital role in insulin secretion, Int J Clin Exp Pathol, 8, 15622
  18. 10.4049/jimmunol.1801369 · DOI
  19. 10.1016/j.immuni.2017.08.007 · DOI
  20. 10.1155/2020/4217607 · DOI
  21. 10.1074/jbc.M111.318865 · DOI
  22. 10.1155/2021/2458470 · DOI
  23. 10.1016/j.ebiom.2021.103808 · DOI
  24. 10.1016/j.bbrc.2005.03.199 · DOI
  25. 10.1080/15548627.2016.1145325 · DOI
  26. 10.1002/1873-3468.12528 · DOI
  27. 10.1016/j.isci.2019.09.009 · DOI
  28. 10.1093/nar/gkaa1004 · DOI · Paper page
  29. 10.3389/fphys.2013.00031 · DOI
  30. 10.1038/s41598-017-07077-z · DOI
  31. 10.3390/cells12192353 · DOI
  32. 10.1371/journal.pone.0033607 · DOI
  33. 10.1074/jbc.M115.658864 · DOI
  34. 10.1038/s41467-023-39335-2 · DOI
  35. 10.1038/s41422-023- · DOI
  36. 10.21203/rs.3.rs-3267442/v12023 · DOI
  37. 10.1038/s41422-023-00893-1 · DOI
  38. 10.1038/s41421-024-00647-2 · DOI
  39. 10.1080/15548627.2020.1712109 · DOI
  40. 10.1073/pnas.2120620119 · DOI
  41. 10.1016/j.jmb.2022.167795 · DOI
  42. 10.1038/418244a · DOI
  43. 10.1038/nature02872 · DOI
  44. 10.1080/15548627.2016.1248019 · DOI
  45. 10.1016/j.neuint.2021.105243 · DOI
  46. 10.1530/JME-15-0227 · DOI
  47. 10.1126/science.1087117 · DOI
  48. 10.1534/g3.117.300308 · DOI
  49. 10.1186/1745- · DOI
  50. 10.1038/nbt1339 · DOI · Paper page
  51. 10.1038/nprot.2014.173 · DOI
  52. 10.1016/j.str.2006.01.013 · DOI
  53. 10.1038/nmeth.4169 · DOI · Paper page
  54. 10.1038/s41592-020-00990-8 · DOI
  55. 10.1038/nmeth.2727 · DOI
  56. 10.1101/2023.05.16.541002 · DOI · Paper page
  57. 10.1093/nar/gkab1061 · DOI · Paper page
  58. 10.1107/S0907444910007493 · DOI · Paper page
  59. 10.1107/S2059798319011471 · DOI · Paper page
  60. 10.1002/pro.4792 · DOI
  61. 10.1093/nar/gky309 · DOI
  62. 10.1006/jsbi.1996.0013 · DOI
  63. 10.1021/ci200227u · DOI
  64. 10.1093/nar/gkw408 · DOI · Paper page

Metadata

Authors
Navratna, V., Kumar, A., Rana, J. K., & Mosalaganti, S.
Affiliations
  • University of Michigan (US)
  • Thermo Fisher Scientific (United States) (US)
Corresponding author
  • Navratna, Vikas
  • Mosalaganti, Shyamal
Venue
Life Science Alliance
Publisher
openRxiv
Published
2023-12-23
Volume
7
Issue
9
Pages
e202402624-e202402624
ISSN
2575-1077 (ISSN-L)
OpenAlex
W4400040617
Cited by
2
References
1
Citations by year
2026: 1 · 2024: 1
FWCI
0.27
Type
journal article
Language
en
Open access
Licence
cc-by
Locations
  • Life Science Alliance (publishedVersion, cc-by)
  • bioRxiv (Cold Spring Harbor Laboratory) (acceptedVersion, cc-by)
  • PubMed Central (publishedVersion, cc-by)
  • PubMed (publishedVersion)
  • PubMed Central (submittedVersion, cc-by)
  • DOAJ (DOAJ: Directory of Open Access Journals) (submittedVersion, cc-by-sa)
Funders
  • National Institutes of Health (1dp2gm150019-01)
  • National Institute of General Medical Sciences (DP2GM150019)
Topics
  • Life Sciences › Biochemistry, Genetics and Molecular Biology › Molecular Biology › RNA Interference and Gene Delivery
  • Life Sciences › Biochemistry, Genetics and Molecular Biology › Molecular Biology › Protein Structure and Dynamics
  • Life Sciences › Biochemistry, Genetics and Molecular Biology › Structural Biology › Enzyme Structure and Function
Keywords
systemic RNAi, lipid-binding domain, conformational flexibility, transmembrane domain, protein structure

About these checks

Registry, retraction, Cites and statistics results are computed, not judged, with one exception: a printed reference that no index lists is read once by a model before it counts as a citation error. Claims are extracted by a model and kept only when their quote appears verbatim in the text; each cited source is then checked, with a model’s help, for whether it says what the claim relies on. Those verdicts can be wrong — read the claim’s quote and the cited source before relying on one.

Statistics and arithmetic are recomputed, not judged.

Confidence bands are shown only for fields calibrated on our annotated test set. None is calibrated yet, so no band is shown.

What counts as a claim ›How we measure confidence ›How we check this ›

Are you an author, or do you see a problem with this page? Request a review