

The DOI matches its Crossref record; 1 of the 1 references it cites were found in a registry or an index.
3DCellComposer - A Versatile Pipeline Utilizing 2D Cell Segmentation Methods for 3D Cell Segmentation
Open accessPreprint — published as 10.1016/j.ymeth.2025.07.007
Abstract
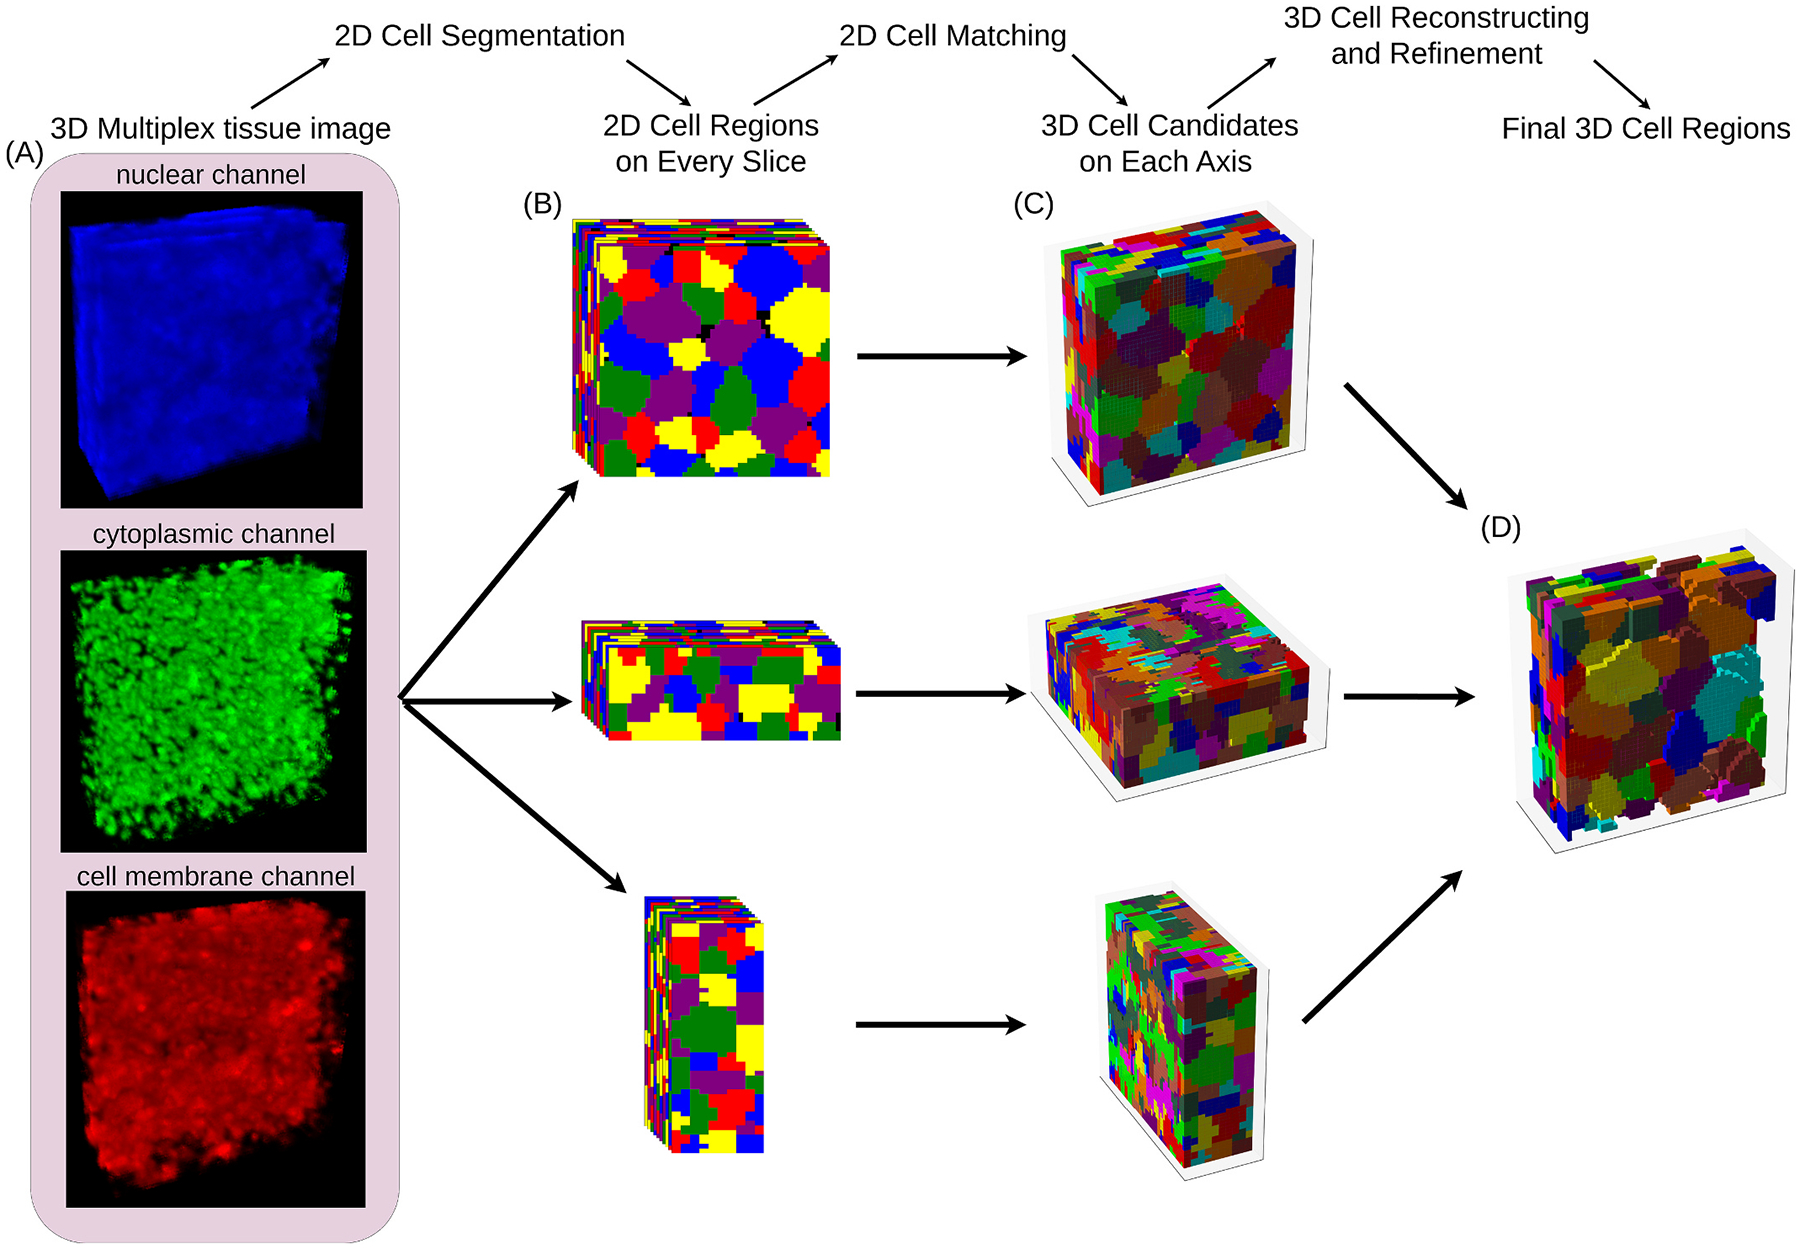
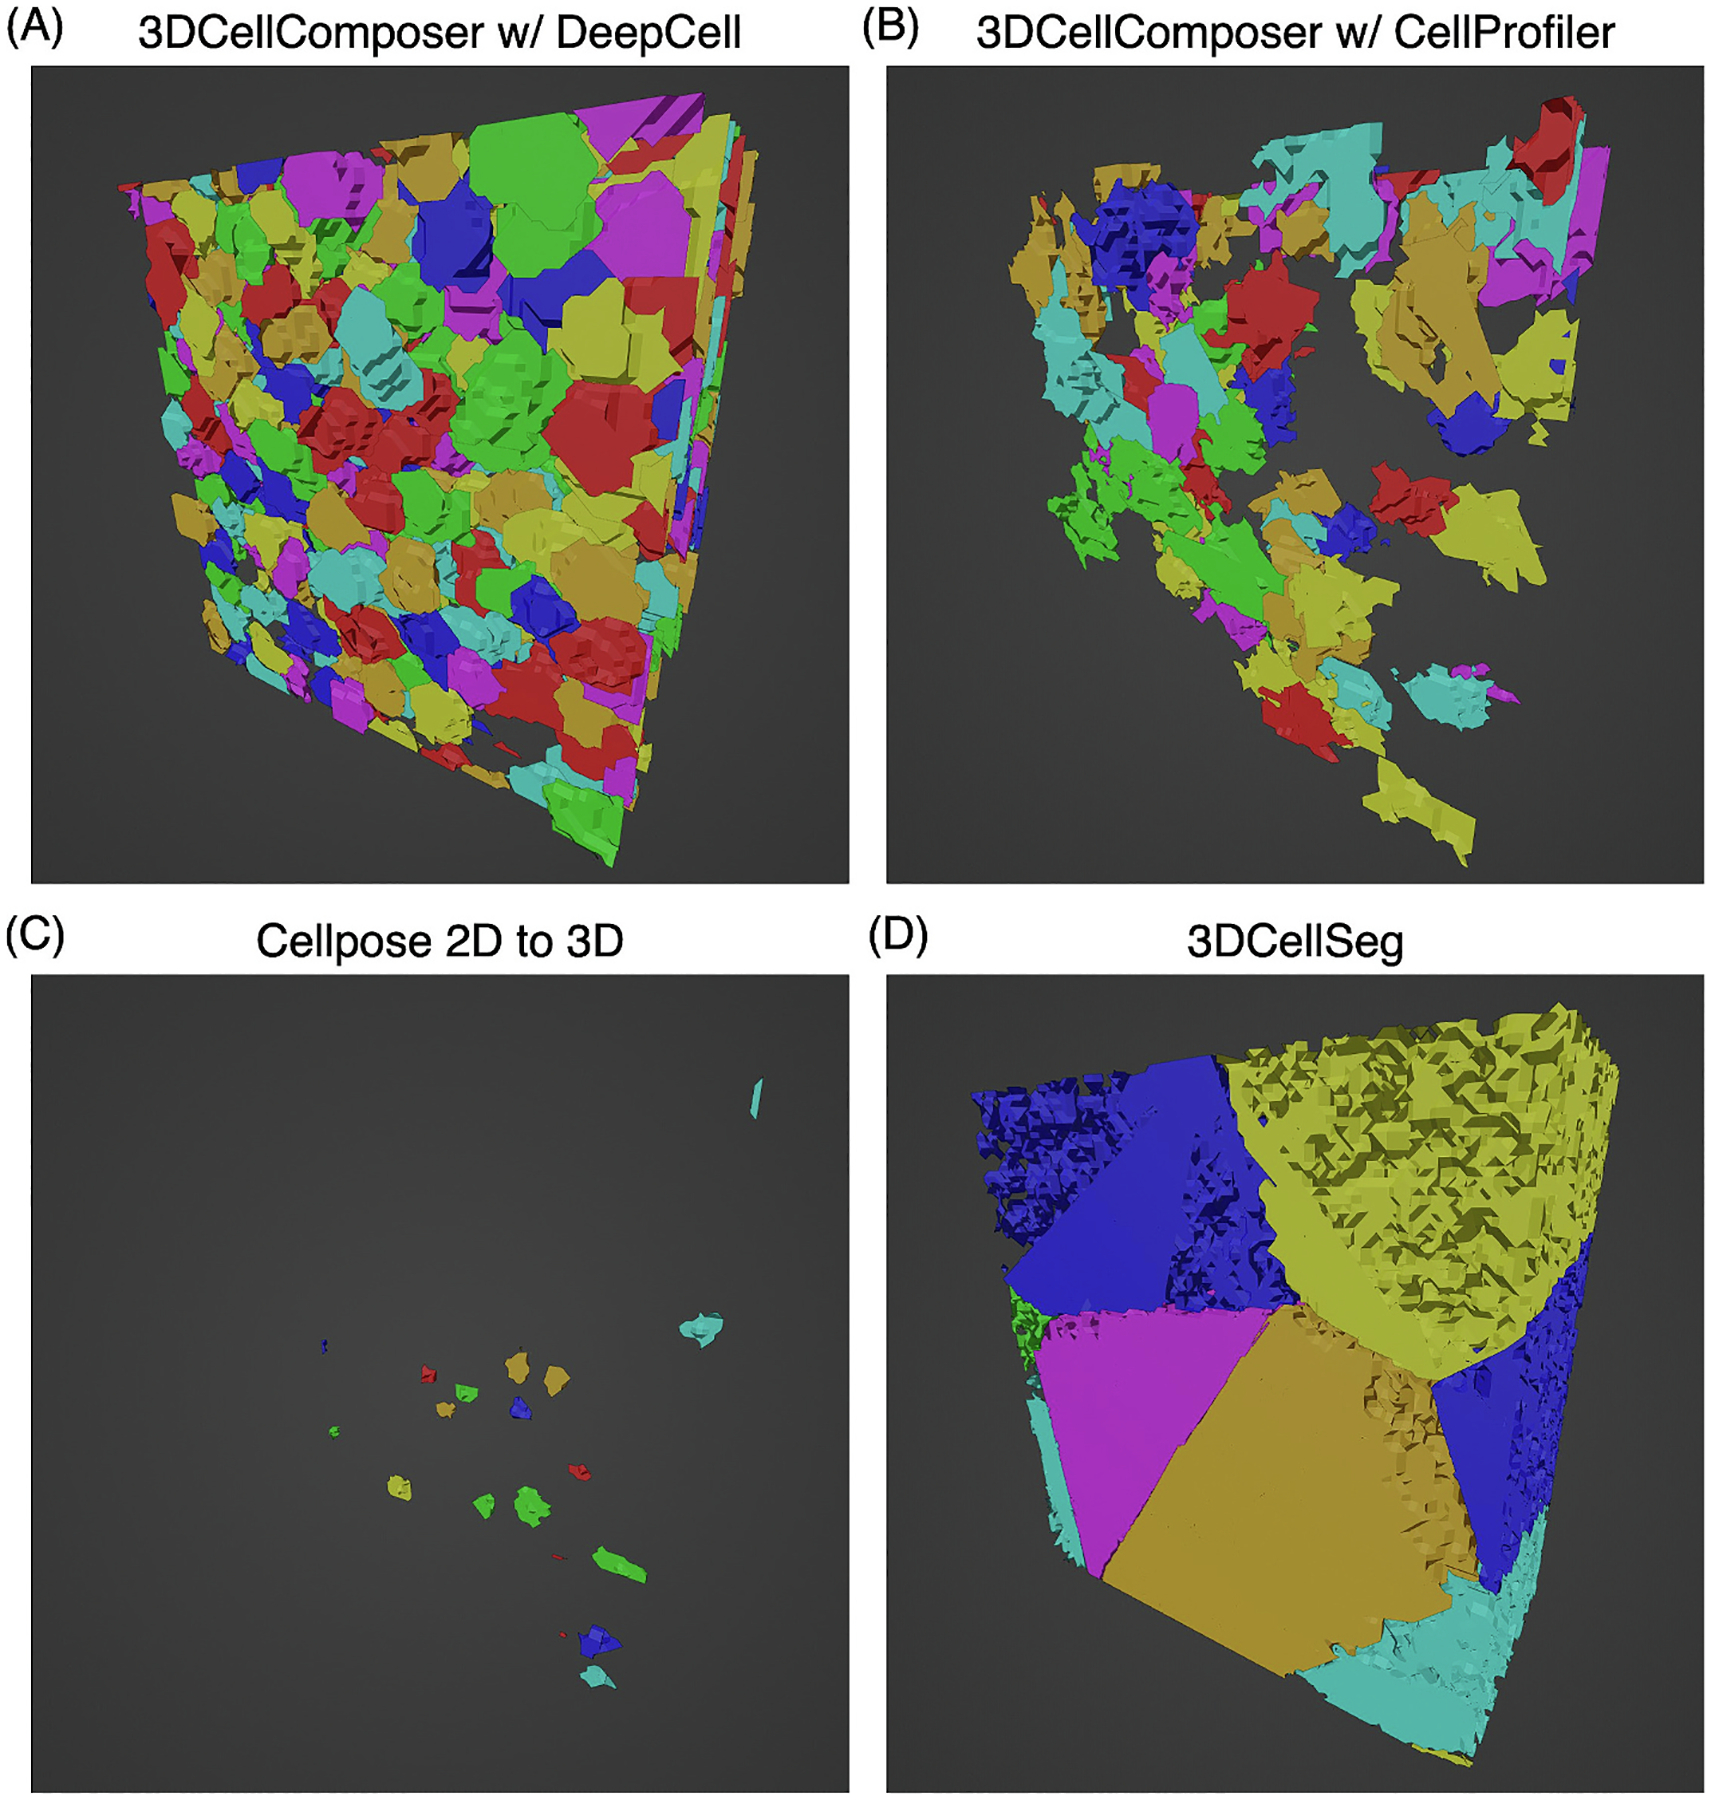
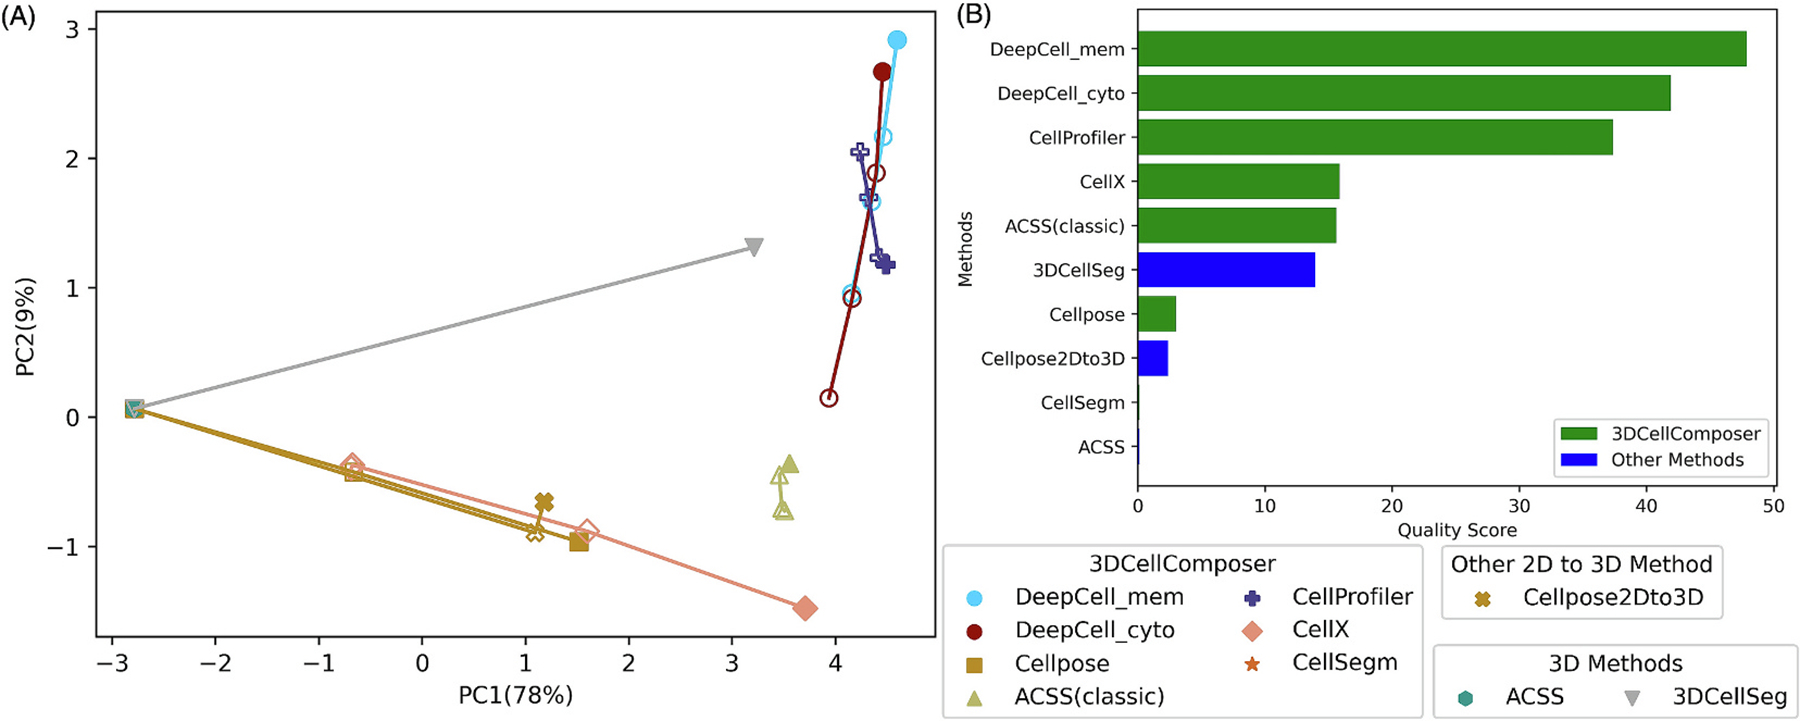
Background: Cell segmentation is crucial in bioimage informatics, as its accuracy directly impacts conclusions drawn from cellular analyses. While many approaches to 2D cell segmentation have been described, 3D cell segmentation has received much less attention. 3D segmentation faces significant challenges, including limited training data availability due to the difficulty of the task for human annotators, and inherent three-dimensional complexity. As a result, existing 3D cell segmentation methods often lack broad applicability across different imaging modalities. Results: To address this, we developed a generalizable approach for using 2D cell segmentation methods to produce accurate 3D cell segmentations. We implemented this approach in 3DCellComposer, a versatile, open-source package that allows users to choose any existing 2D segmentation model appropriate for their tissue or cell type(s) without requiring any additional training. Importantly, we have enhanced our open source CellSegmentationEvaluator quality evaluation tool to support 3D images. It provides metrics that allow selection of the best approach for a given imaging source and modality, without the need for human annotations to assess performance. Using these metrics, we demonstrated that our approach produced high-quality 3D segmentations of tissue images, and that it could outperform an existing 3D segmentation method on the cell culture images with which it was trained. Conclusions: 3DCellComposer, when paired with well-trained 2D segmentation models, provides an important alternative to acquiring human-annotated 3D images for new sample types or imaging modalities and then training 3D segmentation models using them. It is expected to be of significant value for large scale projects such as the Human BioMolecular Atlas Program.
Overview
The claims and statistics of this paper haven’t been checked yet.
Run the check — free, no account needed. It reads the open-access text and checks the sources it cites.
Integrity signals
Registry
Cites
Statistics
Figures
Verification
Claims the paper makes
The claims and statistics of this paper haven’t been checked yet.
Run the check — free, no account needed. It reads the open-access text and checks the sources it cites.
Self-check
Percentages, sums and reported differences re-computed from the paper’s own numbers.
The self-check needs the paper’s full text.
Citations
Cites
Integrated intracellular organization and its variations in human iPS cells
Viana, M. P., Chen, J., Knijnenburg, T. A., Vasan, R., Yan, C., Arakaki, J. E., Bailey, M., Berry, B., Borensztejn, A., Brown, E. M., et al. (2023) · Nature · doi:10.1038/s41586-022-05563-7 · Cited by 132 · cited 2×
“The Allen Cell and Structure Segmenter (referred to below as ACSS) presented a human-in-the-loop deep learning workflow with expert correction of the segmentation results at each iteration [18, 19].”
Research works printed but not linked: 34
- 10.1002/anbr.202100084 · DOI
- 10.1038/s41592-021-01316-y · DOI
- 10.1038/s41551-022-00891-5 · DOI
- 10.1038/s41698-020-0114-1 · DOI
- 2022, Three-dimensional imaging mass cytometry for highly multiplexed molecular and cellular mapping of tissues and the tumor microenvironment, Nature Cancer, 3, 122
- 10.1186/s13041-023-01027-9 · DOI
- 10.1186/s12859-022-04737-4 · DOI
- 10.1038/s41598-021-88966-2 · DOI
- 10.1186/1471-2121-8-1 · DOI
- 2007, A multi-model approach to simultaneous segmentation and classification of heterogeneous populations of cell nuclei in 3D confocal microscope images, Cytometry Part A: The Journal of the International Society for Analytical Cytology, 71, 724
- 10.1038/s41598-019-54244-5 · DOI
- 10.1038/s41540-020-00152-8 · DOI
- 10.7554/eLife.59187 · DOI
- Weigert, M. , et al. Star-convex polyhedra for 3D object detection and segmentation in microscopy. in Proceedings of the IEEE/CVF winter conference on applications of computer vision. 2020. · DOI
- Eschweiler, D. , et al. Spherical harmonics for shape-constrained 3D cell segmentation. in 2021 IEEE 18th International Symposium on Biomedical Imaging (ISBI). 2021. IEEE. · DOI
- 10.7554/eLife.57613 · DOI
- 10.1038/s41598-021-04048-3 · DOI
- Chen, J. , et al., The Allen Cell and Structure Segmenter: a new open source toolkit for segmenting 3D intracellular structures in fluorescence microscopy images. BioRxiv, 2018: p. 491035. · DOI · Paper page
- 10.1038/s41587-021-01094-0 · DOI · Paper page
- 10.1186/s12859-019-2880-8 · DOI
- 10.1186/s12859-016-1452-4 · DOI
- 10.1038/s41587-021-01094-0 · DOI · Paper page
- 10.1038/s41592-021-01249-6 · DOI · Paper page
- 10.1038/s41592-022-01663-4 · DOI · Paper page
- 10.1038/s41592-020-01018-x · DOI · Paper page
- 10.1091/mbc.E22-08-0364 · DOI
- 10.1002/cyto.a.23053 · DOI
- 10.1038/nmeth.2869 · DOI · Paper page
- 10.1038/s41586-019-1629-x · DOI · Paper page
- 10.1080/14786440109462720 · DOI
- Jolliffe, I.T. , Principal component analysis for special types of data. 2002: Springer.
- 2011, Scikit-learn: Machine learning in Python, the Journal of machine Learning research, 12, 2825
- 10.1016/j.cell.2018.07.010 · DOI · Paper page
- 10.1016/j.cell.2022.12.028 · DOI
Metadata
- Authors
- Chen, H., & Murphy, R. F.
- Affiliations
- Carnegie Mellon University (US)
- Corresponding author
- Murphy, Robert F.
- Venue
- Methods
- Publisher
- openRxiv
- Published
- 2024-03-12
- Volume
- 242
- Pages
- 113-122
- ISSN
- 1046-2023 (ISSN-L)
- PMC
- PMC13242829
- OpenAlex
- W4412823348
- Cited by
- 6
- References
- 1
- Citations by year
- 2026: 2 · 2025: 3 · 2024: 1
- FWCI
- 1.88
- Type
- journal article
- Language
- en
- Open access
- hybrid
- doi.org
- Licence
- Locations
- Methods (publishedVersion, cc-by-nc-nd)
- bioRxiv (Cold Spring Harbor Laboratory) (acceptedVersion, cc-by-nc)
- PubMed (publishedVersion)
- PubMed Central (publishedVersion, cc-by-nc-nd)
- PubMed Central (submittedVersion, cc-by-nc)
- Funders
- National Institutes of Health (OT2OD033761, OT2OD026682, EB-009403)
- National Institute of Biomedical Imaging and Bioengineering (T32EB009403)
- Common Fund
- Topics
- Life Sciences › Biochemistry, Genetics and Molecular Biology › Biophysics › Cell Image Analysis Techniques
- Physical Sciences › Computer Science › Computer Vision and Pattern Recognition › Medical Image Segmentation Techniques
- Physical Sciences › Computer Science › Computer Vision and Pattern Recognition › Advanced Neural Network Applications
- Keywords
- 3D cell segmentation, segmentation quality assessment, HuBMAP, limited training data
About these checks
Registry, retraction, Cites and statistics results are computed, not judged, with one exception: a printed reference that no index lists is read once by a model before it counts as a citation error. Claims are extracted by a model and kept only when their quote appears verbatim in the text; each cited source is then checked, with a model’s help, for whether it says what the claim relies on. Those verdicts can be wrong — read the claim’s quote and the cited source before relying on one.
Statistics and arithmetic are recomputed, not judged.
Confidence bands are shown only for fields calibrated on our annotated test set. None is calibrated yet, so no band is shown.
What counts as a claim ›How we measure confidence ›How we check this ›
Are you an author, or do you see a problem with this page? Request a review
