Student or educator? Sign up with your school email and get 6 months of Pro free.
PreprintCited by 9Plant Pathogenic Bacteria StudiesPlant-Microbe Interactions and ImmunityImmune Response and Inflammation

The DOI matches its Crossref record; 1 of the 1 references it cites were found in a registry or an index.

Arabidopsis CNL receptor SUT1 confers immunity in hydathodes against the vascular pathogen Xanthomonas campestris pv. campestris

Open access

Preprint — published as 10.1371/journal.ppat.1013256

Abstract

Bacterial plant pathogens exploit natural openings, such as pores or wounds, to enter the plant interior and cause disease. Plants guard these openings through defense mechanisms. However, bacteria from the genus Xanthomonas have specialized in that they enter their host via a special entry point, the hydathode—an organ at the leaf margin involved in xylem sap guttation. Hydathodes can mount an immune response against bacteria, including non-adapted and adapted pathogens like X. campestris pv. campestris (Xcc) that cause vascular disease. Previously, it was shown that the RKS1/ZAR1 immune complex confers vascular resistance against Xcc by recognizing XopAC activity, a type III effector (T3E). However, in absence of XopAC recognition, Arabidopsis Col-0 hydathodes still display resistance against Xcc. Here we mapped the causal gene using an inoculation method that promotes Xcc hydathode entry. Using a population of Recombinant Inbred Lines (RILs) of a cross between a susceptible (Oy-0) and resistant accession (Col-0), a major QTL for Xcc resistance was found on the right arm of Chromosome 5 in Col-0. Combining this result with a genome-wide association analysis yielded a single candidate gene encoding a coiled-coil nucleotide-binding leucine-rich repeat (CNL-type) immune receptor protein called SUPPRESSOR OF TOPP4 1 (SUT1). Expression of SUT1 was confirmed in hydathodes. We reveal that RKS1/ZAR1 and SUT1 confer different levels of Xcc resistance in different tissue types. Both RKS1/ZAR1 and SUT1 are alone sufficient for Xcc resistance in Col-0 hydathodes. However, RKS1/ZAR1 resistance is also effective in tissue types that represent late infection stages, i.e. xylem and mesophyll. In contrast, SUT1 resistance is not effective in the xylem, while weakly additive to RKS1/ZAR1 in the mesophyll. We thus identify a novel R gene, SUT1 , that confers Xcc resistance primarily early in the infection during hydathode colonization. Author summary: Black rot disease, caused by the bacterial pathogen Xanthomonas campestris pv. campestris (Xcc), is an economically important disease of cabbage crops. Xcc is unique in that it enters the plant interior through specialized organs at the leaf margin. These structures called hydathodes contain water pores and are involved in root pressure regulation. Although we know that hydathodes can mount an immune response against these bacteria, specific immune receptors still need to be discovered. Here we use the model plant Arabidopsis thaliana to map an hydathode-effective resistance gene. By screening two different Arabidopsis populations, we could map a single gene, SUT1, that is involved in this resistance. SUT1 restricts the early hydathode colonization by Xcc thus suppressing disease progression. Interestingly, SUT1 resistance was not effective in the plant vascular system, which the bacteria subsequently colonize. Therefore, this study provides a new insight into the role of hydathodes in anti-bacterial resistance in plants and opens the door for research on tissue- and organ-specific resistance mechanisms.

Overview

The claims and statistics of this paper haven’t been checked yet.

Run the check — free, no account needed. It reads the open-access text and checks the sources it cites.

A few free checks a day · papers already verified open instantly · results are public

Integrity signals

Registry

Crossref · 10.1101/2024.06.20.599835

Cites

1 of 1 references verified0 citation errors · 0 not checkable

Statistics

Figures

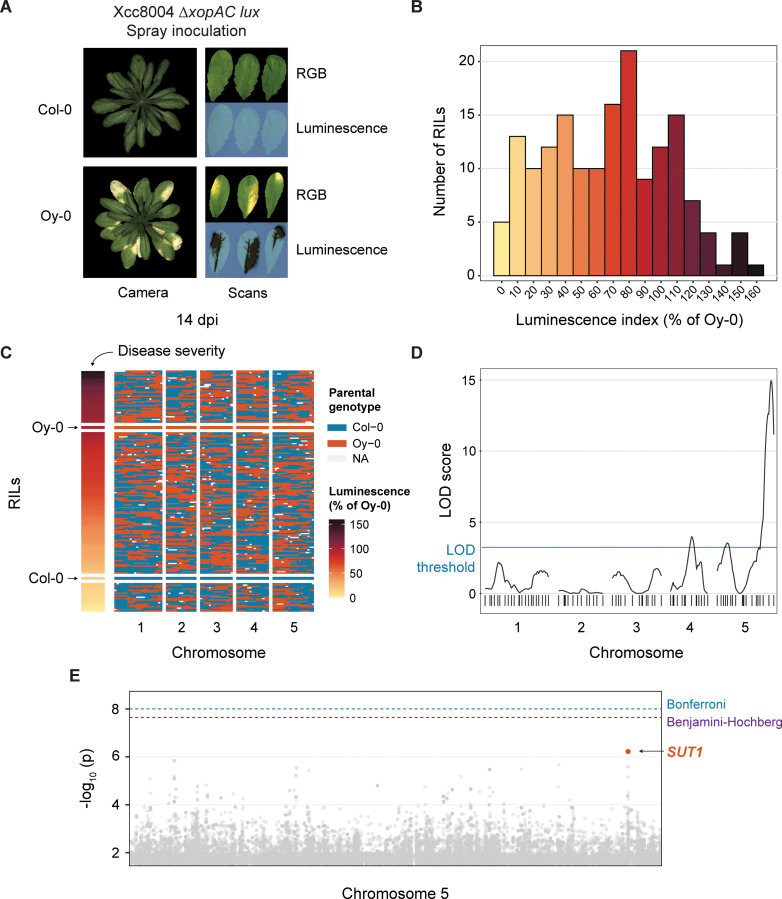
Fig 1 Mapping of SUT1 as a candidate R gene against Xcc8004 ΔxopAC in Arabidopsis Col-0. A) Disease symptoms and bacterial luminescence in the resistant Col-0 and susceptible Oy-0 accessions following spray inoculation with bioluminescent Xcc8004 ΔxopAC. Leaves shown are representative of spray inoculation with either Tn5:lux or Tn7:lux tagged reporter strains. Bacterial spread was visualized using light-sensitive film 14 days post inoculation (dpi). B) Histogram depicting the variation in luminescence index score 14 dpi (normalized to Oy-0) for all 165 Oy-0 × Col-0 Recombinant Inbred Lines (RILs) following spray inoculation with Xcc8004 ΔxopAC Tn5:lux. C) Population structure of 165 RILs in the Oy-0 × Col-0 RIL population, ordered by luminescence index score at 14 dpi (normalized to Oy-0) shown in (B). D) QTL graph showing LOD scores for each of the 85 markers in the RIL population. LOD significance threshold determined by permutation (n = 1000) at 2.49 E) Manhattan plot of Chromosome 5 from a screen of 321 accessions present in the HapMap collection. Highlighted SNPs in orange are located within the coding sequence of SUT1. False Discovery Rate (FDR) thresholds set at -log10 (p) = 8 (Bonferroni) and -log10 (p) = 7.29 (Benjamini-Hochberg). See also S1 Fig for the full Manhattan plot.
Fig 1 Mapping of SUT1 as a candidate R gene against Xcc8004 ΔxopAC in Arabidopsis Col-0. A) Disease symptoms and bacterial luminescence in the resistant Col-0 and susceptible Oy-0 accessions following spray inoculation with bioluminescent Xcc8004 ΔxopAC. Leaves shown are representative of spray inoculation with either Tn5:lux or Tn7:lux tagged reporter strains. Bacterial spread was visualized using light-sensitive film 14 days post inoculation (dpi). B) Histogram depicting the variation in luminescence index score 14 dpi (normalized to Oy-0) for all 165 Oy-0 × Col-0 Recombinant Inbred Lines (RILs) following spray inoculation with Xcc8004 ΔxopAC Tn5:lux. C) Population structure of 165 RILs in the Oy-0 × Col-0 RIL population, ordered by luminescence index score at 14 dpi (normalized to Oy-0) shown in (B). D) QTL graph showing LOD scores for each of the 85 markers in the RIL population. LOD significance threshold determined by permutation (n = 1000) at 2.49 E) Manhattan plot of Chromosome 5 from a screen of 321 accessions present in the HapMap collection. Highlighted SNPs in orange are located within the coding sequence of SUT1. False Discovery Rate (FDR) thresholds set at -log10 (p) = 8 (Bonferroni) and -log10 (p) = 7.29 (Benjamini-Hochberg). See also S1 Fig for the full Manhattan plot.CC BY · PubMed Central
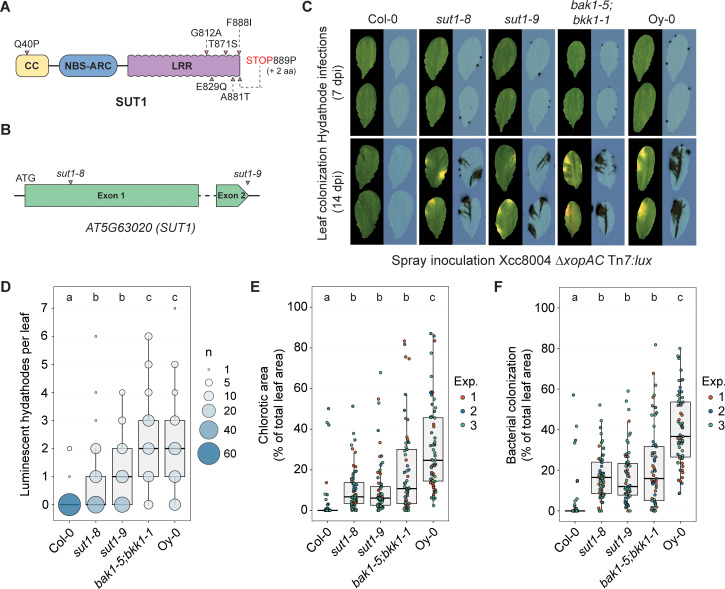
Fig 2 SUT1 contributes to hydathode resistance against Xcc8004 ΔxopAC. A) Predicted SUT1 protein model. Arrows depict predicted amino acid differences between Oy-0 vs. Col-0. B) SUT1 gene model depicting the Col-0 allele and approximate integration site of the sut1-8 and sut1-9 T-DNA insertions. C) Spray inoculation of sut1-8 and sut1-9 with Xcc8004 ΔxopAC Tn7:lux. Wildtype background (Col-0), bak1-5;bkk1-1 (Col-0) and the accession Oy-0 were included as controls. Top, visualization of high density hydathode colonization using light sensitive films (7 dpi); bottom, visualization of the systemic spread of Xcc and disease symptom development (14 dpi). D,E,F) Number of infected hydathodes 7 dpi (D), chlorotic area 14 dpi (E) and bacterial colonization 14 dpi (F) per leaf for each line shown in panel C following spray inoculation with Xcc8004 ΔxopAC Tn7:lux (n = 21 leaves per experiment). In panel D, the circle size depicts the number (#) of leaves with a certain score (y-axis) from three independent repetitions. Significance letters from non-parametric Kruskal-Wallis test with Dunn’s Post-Hoc test, p-value threshold = 0.05.
Fig 2 SUT1 contributes to hydathode resistance against Xcc8004 ΔxopAC. A) Predicted SUT1 protein model. Arrows depict predicted amino acid differences between Oy-0 vs. Col-0. B) SUT1 gene model depicting the Col-0 allele and approximate integration site of the sut1-8 and sut1-9 T-DNA insertions. C) Spray inoculation of sut1-8 and sut1-9 with Xcc8004 ΔxopAC Tn7:lux. Wildtype background (Col-0), bak1-5;bkk1-1 (Col-0) and the accession Oy-0 were included as controls. Top, visualization of high density hydathode colonization using light sensitive films (7 dpi); bottom, visualization of the systemic spread of Xcc and disease symptom development (14 dpi). D,E,F) Number of infected hydathodes 7 dpi (D), chlorotic area 14 dpi (E) and bacterial colonization 14 dpi (F) per leaf for each line shown in panel C following spray inoculation with Xcc8004 ΔxopAC Tn7:lux (n = 21 leaves per experiment). In panel D, the circle size depicts the number (#) of leaves with a certain score (y-axis) from three independent repetitions. Significance letters from non-parametric Kruskal-Wallis test with Dunn’s Post-Hoc test, p-value threshold = 0.05.CC BY · PubMed Central
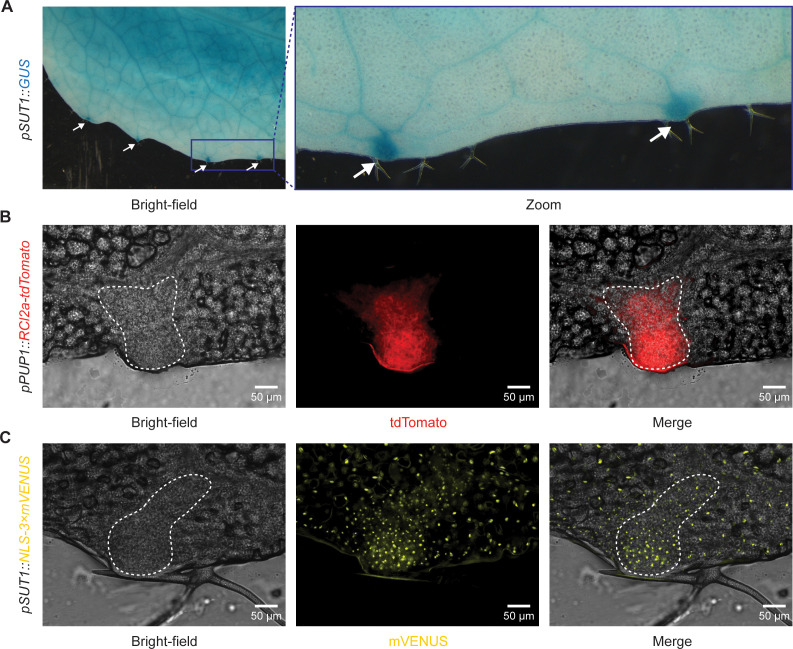
Fig 3 SUT1 is expressed in epithem cells within hydathodes. A) Arabidopsis pSUT1::GUS lines stained with X-Gluc show SUT1 expression over the entire leaf (4-week-old plants). GUS staining is stronger in the hydathodes along the leaf margin (white arrows). B) Arabidopsis epithem marker line pPUP1::RCl2a-tdTomato shows tdTomato localization in epithem cell membrane within hydathodes. Epithem tissue can be distinguished from the mesophyll cells in the bright-field image (white dashed line). C) Arabidopsis pSUT1::NLS3 × mVENUS T2 line shows mVENUS accumulation in nuclei of mesophyll and epithem cells. Epithem cells can be distinguished from mesophyll cells in the bright-field image as a region with dense small cells on the leaf margin (white dashed line). Images were taken of epidermal peels and are representative of three independent lines (S5 Fig).
Fig 3 SUT1 is expressed in epithem cells within hydathodes. A) Arabidopsis pSUT1::GUS lines stained with X-Gluc show SUT1 expression over the entire leaf (4-week-old plants). GUS staining is stronger in the hydathodes along the leaf margin (white arrows). B) Arabidopsis epithem marker line pPUP1::RCl2a-tdTomato shows tdTomato localization in epithem cell membrane within hydathodes. Epithem tissue can be distinguished from the mesophyll cells in the bright-field image (white dashed line). C) Arabidopsis pSUT1::NLS3 × mVENUS T2 line shows mVENUS accumulation in nuclei of mesophyll and epithem cells. Epithem cells can be distinguished from mesophyll cells in the bright-field image as a region with dense small cells on the leaf margin (white dashed line). Images were taken of epidermal peels and are representative of three independent lines (S5 Fig).CC BY · PubMed Central
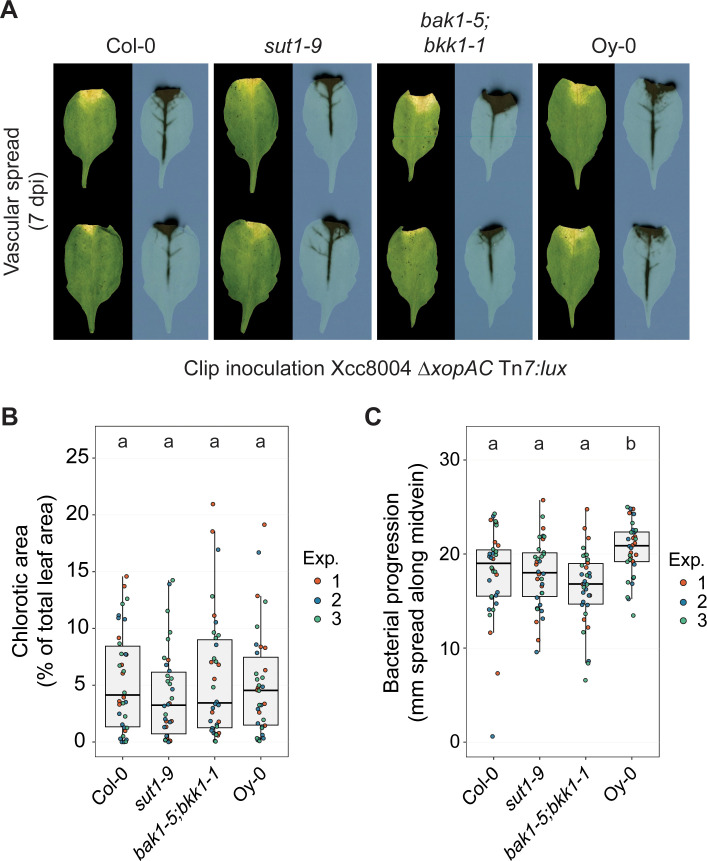
Fig 4 SUT1 resistance is compromised when the Xcc inoculation bypasses hydathode colonization. A) Disease symptoms and bacterial spread in Col-0, sut1-9, bak1-1;bkk1-5 and Oy-0 leaves at 7 dpi following clip inoculation with Xcc8004 ΔxopAC Tn7:lux. Bacterial progression is quantified as the spread of the luminescence signal along the midvein. B,C) Chlorotic leaf area (B) and bacterial spread along the midvein (C) 7 dpi following clip inoculation with Xcc8004 ΔxopAC Tn7:lux. SUT1 resistance against Xcc is apparently ineffective in the vasculature of Col-0 when the hydathodes are bypassed and the bacteria are introduced using leaf clipping. Significance letters from a two-way ANOVA with Tukey Post-Hoc test, p-value threshold = 0.05 (n = 12 leaves per experiment).
Fig 4 SUT1 resistance is compromised when the Xcc inoculation bypasses hydathode colonization. A) Disease symptoms and bacterial spread in Col-0, sut1-9, bak1-1;bkk1-5 and Oy-0 leaves at 7 dpi following clip inoculation with Xcc8004 ΔxopAC Tn7:lux. Bacterial progression is quantified as the spread of the luminescence signal along the midvein. B,C) Chlorotic leaf area (B) and bacterial spread along the midvein (C) 7 dpi following clip inoculation with Xcc8004 ΔxopAC Tn7:lux. SUT1 resistance against Xcc is apparently ineffective in the vasculature of Col-0 when the hydathodes are bypassed and the bacteria are introduced using leaf clipping. Significance letters from a two-way ANOVA with Tukey Post-Hoc test, p-value threshold = 0.05 (n = 12 leaves per experiment).CC BY · PubMed Central
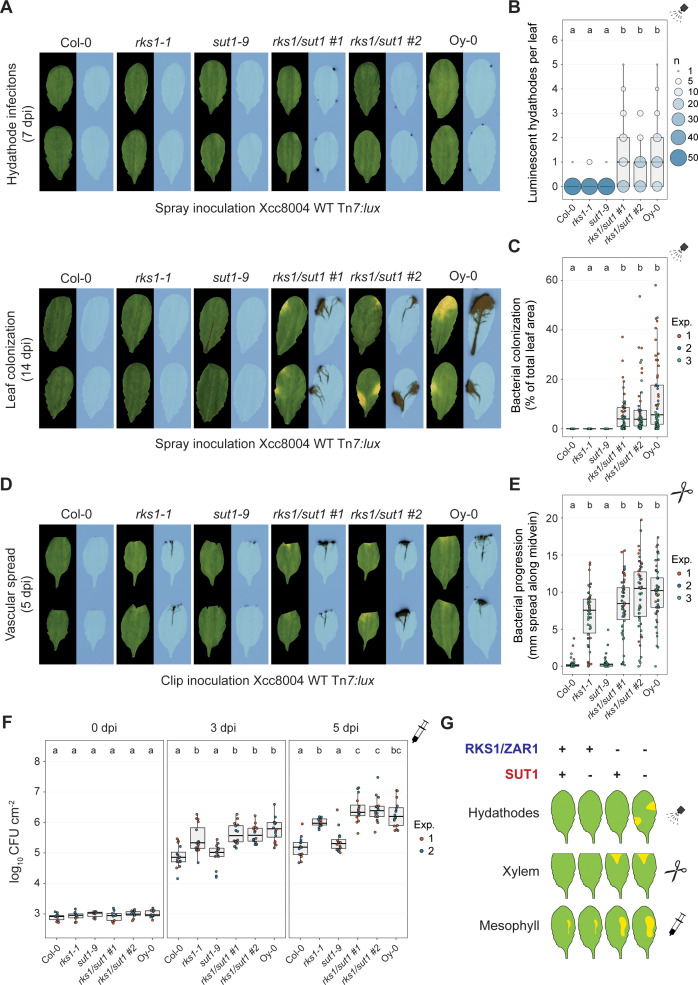
Fig 5 RKS1/ZAR1 and SUT1 confer resistance to Xcc in different stages of infection. A) Spray inoculation with Xcc8004 Tn7:lux on rks1-1 and sut1-9 single mutants and two independent rks1/sut1 CRISPR knockout lines with wildtype background Col-0 and accession Oy-0 as controls. Top, visualization of Xcc hydathode colonization using light sensitive films (7 dpi); bottom, visualization of the systemic spread of Xcc and disease symptom development (14 dpi). B,C) Quantification of panel A as number of infected hydathodes per leaf at 7 dpi (B) and bacterial colonization (C) at 14 dpi (n = 18 leaves per experiment). D) Clip inoculation with Xcc8004 Tn7:lux on the same plant lines used in panel A. E) Quantification of bacterial progression along the midvein of panel D at 5 dpi (n = 18 leaves per experiment). F) Colony forming units at 0, 3 and 5 days post syringe inoculation of Xcc8004 WT Tn7:lux in the apoplast of the plant lines used in panel A (n = 8 samples per experiment. G) Schematic model indicating the contribution to resistance by RKS1/ZAR1 and SUT1 in different leaf tissues.
Fig 5 RKS1/ZAR1 and SUT1 confer resistance to Xcc in different stages of infection. A) Spray inoculation with Xcc8004 Tn7:lux on rks1-1 and sut1-9 single mutants and two independent rks1/sut1 CRISPR knockout lines with wildtype background Col-0 and accession Oy-0 as controls. Top, visualization of Xcc hydathode colonization using light sensitive films (7 dpi); bottom, visualization of the systemic spread of Xcc and disease symptom development (14 dpi). B,C) Quantification of panel A as number of infected hydathodes per leaf at 7 dpi (B) and bacterial colonization (C) at 14 dpi (n = 18 leaves per experiment). D) Clip inoculation with Xcc8004 Tn7:lux on the same plant lines used in panel A. E) Quantification of bacterial progression along the midvein of panel D at 5 dpi (n = 18 leaves per experiment). F) Colony forming units at 0, 3 and 5 days post syringe inoculation of Xcc8004 WT Tn7:lux in the apoplast of the plant lines used in panel A (n = 8 samples per experiment. G) Schematic model indicating the contribution to resistance by RKS1/ZAR1 and SUT1 in different leaf tissues.CC BY · PubMed Central

Verification

Claims the paper makes

The claims and statistics of this paper haven’t been checked yet.

Run the check — free, no account needed. It reads the open-access text and checks the sources it cites.

A few free checks a day · papers already verified open instantly · results are public

Self-check

Percentages, sums and reported differences re-computed from the paper’s own numbers.

The self-check needs the paper’s full text.

Citations

Cites

Research works printed but not linked: 71

  1. 10.1104/pp.16.01853 · DOI · Paper page
  2. 10.1016/j.molp.2020.09.007 · DOI
  3. 10.1038/nature02485 · DOI · Paper page
  4. 10.1073/pnas.0705147104 · DOI · Paper page
  5. 10.1038/s41586-022-04684-3 · DOI
  6. 10.1016/j.cell.2006.06.054 · DOI · Paper page
  7. 10.1038/s41586-020-2702-1 · DOI · Paper page
  8. 10.1104/pp.16.01852 · DOI
  9. 10.1126/sciadv.abc4516 · DOI
  10. 10.1094/MPMI.1998.11.6.537 · DOI
  11. 10.1146/annurev-phyto-082718-100228 · DOI
  12. 10.1371/journal.pone.0232566 · doi:10.1371/journal.pone.0232566
  13. 10.1111/tpj.17014 · doi:10.1111/tpj.17014
  14. 10.1016/j.cub.2022.06.014 · doi:10.1016/j.cub.2022.06.014
  15. 10.1038/s44319-023-00023-3 · DOI
  16. 10.1016/j.cub.2023.01.013 · doi:10.1016/j.cub.2023.01.013
  17. 10.1093/plcell/koac041 · DOI · Paper page
  18. 10.1016/j.tplants.2021.08.012 · DOI · Paper page
  19. 10.1093/femsre/fuw026 · DOI · Paper page
  20. 10.15252/embr.202357495 · DOI
  21. 10.1126/science.aav5870 · DOI · Paper page
  22. 10.1038/nrmicro.2018.17 · DOI · Paper page
  23. 10.1126/sciadv.abg8723 · doi:10.1126/sciadv.abg8723
  24. 10.1016/j.chom.2015.08.004 · DOI · Paper page
  25. 10.1371/journal.pone.0073469 · doi:10.1371/journal.pone.0073469
  26. 10.1534/genetics.107.083899 · DOI
  27. 10.1007/978-1-4939-9458-8_16 · doi:10.1007/978-1-4939-9458-8_16
  28. 10.1093/bioinformatics/btg112 · DOI · Paper page
  29. 10.1186/gb-2009-10-1-r1 · DOI · Paper page
  30. 10.1007/978-1-4939-7747-5_22 · DOI
  31. 10.1111/tpj.14447 · DOI
  32. 10.1038/s41588-024-01715-9 · DOI
  33. 10.1111/j.1462-5822.2008.01260.x · DOI
  34. 10.1126/science.abd9993 · DOI · Paper page
  35. 10.1385/0-89603-321-X:125 · doi:10.1385/0-89603-321-x:125
  36. 10.1016/j.cell.2020.01.013 · DOI · Paper page
  37. 10.1016/j.chom.2023.08.019 · DOI
  38. 10.1093/plcell/koaa060 · DOI · Paper page
  39. 10.1371/journal.pgen.1003766 · DOI
  40. 10.1111/tpj.15197 · DOI
  41. 10.1073/pnas.1315520110 · DOI · Paper page
  42. 10.1186/s12864-024-10684-6 · DOI
  43. 10.1093/plphys/kiad478 · DOI
  44. 10.1016/j.cell.2019.07.038 · DOI · Paper page
  45. 10.1146/annurev-phyto-010820-012733 · doi:10.1146/annurev-phyto-010820-012733
  46. 10.1016/j.chom.2012.01.015 · DOI · Paper page
  47. 10.1101/2024.11.24.625045 · DOI
  48. 10.1371/journal.pgen.1005835 · DOI
  49. 10.1104/pp.20.01018 · DOI
  50. 10.1016/j.chom.2022.02.002 · doi:10.1016/j.chom.2022.02.002
  51. 10.1016/j.chom.2022.02.006 · DOI
  52. 10.1038/nature20166 · DOI · Paper page
  53. 10.1111/mpp.12237 · DOI
  54. 10.1038/s41586-023-06531-5 · DOI
  55. 10.1016/j.molp.2015.12.011 · DOI
  56. 10.1007/s12033-019-00213-2 · DOI
  57. 10.1038/s41467-021-23738-0 · DOI
  58. 10.1007/s11248-011-9510-1 · DOI
  59. 10.1186/s13007-024-01213-3 · doi:10.1186/s13007-024-01213-3
  60. 10.1111/mpp.70055 · doi:10.1111/mpp.70055
  61. 10.1371/journal.pone.0083043 · DOI · Paper page
  62. 10.1046/j.1365-313x.1998.00343.x · DOI · Paper page
  63. 10.1038/nprot.2006.24 · DOI · Paper page
  64. 10.1111/1462-2920.15296 · DOI
  65. 10.1016/0378-1119(91)90604-A · DOI · Paper page
  66. 10.1073/pnas.76.4.1648 · DOI · Paper page
  67. 10.1094/Phyto-60-969 · DOI · Paper page
  68. 10.1038/nature08800 · DOI · Paper page
  69. 10.1038/ng.546 · DOI · Paper page
  70. 10.1093/plphys/kiad326 · DOI
  71. 10.1186/1746-4811-5-16 · DOI · Paper page

Metadata

Authors
Taks, N. W., van Hulten, M., van Splunter-Berg, J. A., Chatterjee, S., Stevens, F. D., Paauw, M., Pfeilmeier, S., & van den Burg, H. A.
Affiliations
  • University of Amsterdam (NL)
  • Rijk Zwaan (Netherlands) (NL)
Corresponding author
van den Burg, Harrold A.
Venue
PLoS Pathogens
Publisher
openRxiv
Published
2024-06-24
Volume
21
Issue
6
Pages
e1013256-e1013256
ISSN
1553-7366 (ISSN-L)
OpenAlex
W4411798641
Cited by
9
References
1
Citations by year
2026: 4 · 2025: 3 · 2024: 2
FWCI
3.78
Type
journal article
Language
en
Open access
Locations
  • PLoS Pathogens (publishedVersion, cc-by)
  • bioRxiv (Cold Spring Harbor Laboratory) (acceptedVersion, cc-by)
  • PubMed Central (publishedVersion, cc-by)
  • PubMed (publishedVersion)
  • UvA-DARE (University of Amsterdam) (submittedVersion, cc-by)
  • DOAJ (DOAJ: Directory of Open Access Journals) (submittedVersion, cc-by-sa)
Funders
Nederlandse Organisatie voor Wetenschappelijk Onderzoek (OCENW.XS24.1.155)
Topics
  • Life Sciences › Agricultural and Biological Sciences › Plant Science › Plant Pathogenic Bacteria Studies
  • Life Sciences › Agricultural and Biological Sciences › Plant Science › Plant-Microbe Interactions and Immunity
  • Life Sciences › Immunology and Microbiology › Immunology › Immune Response and Inflammation
Keywords
SUT1, Xanthomonas campestris pv. campestris, hydathodes, vascular resistance, plant immunity, type III effectors, Arabidopsis thaliana, resistance genes, xylem, mesophyll, QTL mapping, genome-wide association study
MeSH terms
Plant Diseases, Xanthomonas campestris, Arabidopsis, Arabidopsis Proteins, Xylem, Plant Immunity, Disease Resistance

About these checks

Registry, retraction, Cites and statistics results are computed, not judged, with one exception: a printed reference that no index lists is read once by a model before it counts as a citation error. Claims are extracted by a model and kept only when their quote appears verbatim in the text; each cited source is then checked, with a model’s help, for whether it says what the claim relies on. Those verdicts can be wrong — read the claim’s quote and the cited source before relying on one.

Statistics and arithmetic are recomputed, not judged.

Confidence bands are shown only for fields calibrated on our annotated test set. None is calibrated yet, so no band is shown.

What counts as a claim ›How we measure confidence ›How we check this ›

Are you an author, or do you see a problem with this page? Request a review

Data sources

Bibliographic data: Semantic Scholar, OpenAlex, Crossref.

Contains information from the Semantic Scholar Academic Graph Datasets, made available under the ODC Attribution License (ODC-BY 1.0).

Semantic Scholar’s data is described in: Kinney, R., et al. (2023). The Semantic Scholar Open Data Platform. arXiv:2301.10140.