

The DOI matches its Crossref record; 18 of the 20 references it cites were found in a registry or an index.
Structural basis for the transport and regulation mechanism of the Multidrug resistance-associated protein 2
Open accessPreprint — published as 10.1038/s41467-024-55810-w · Paper page
Abstract
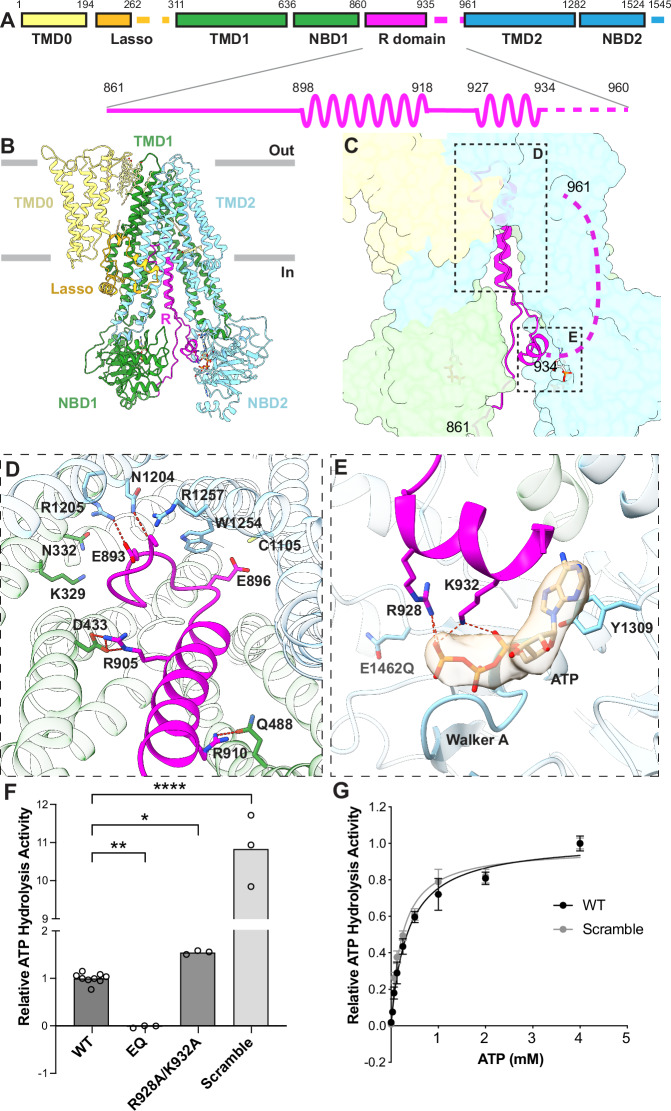
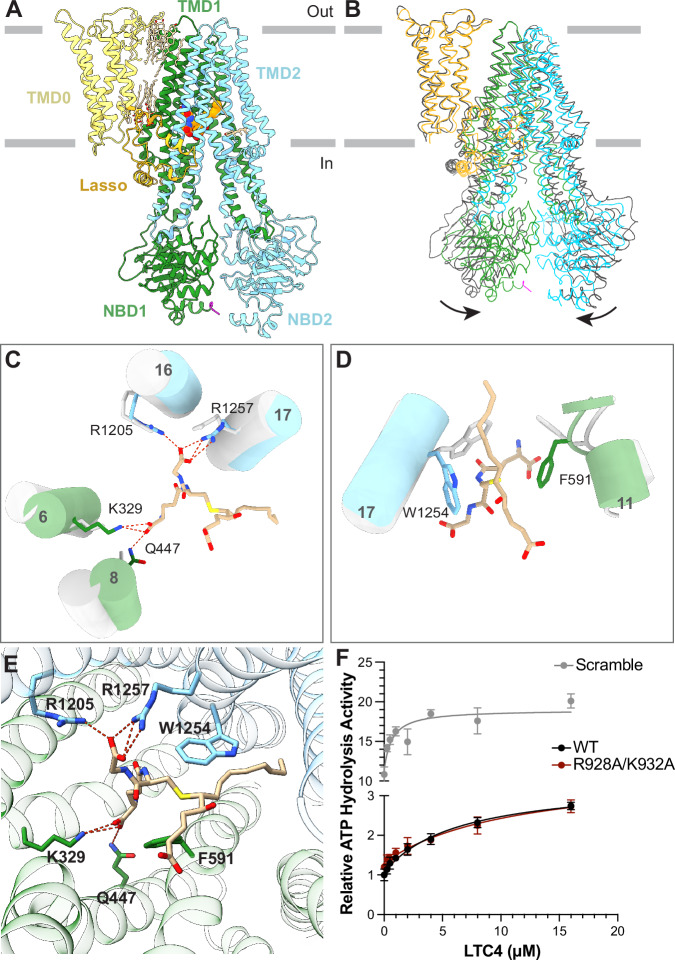
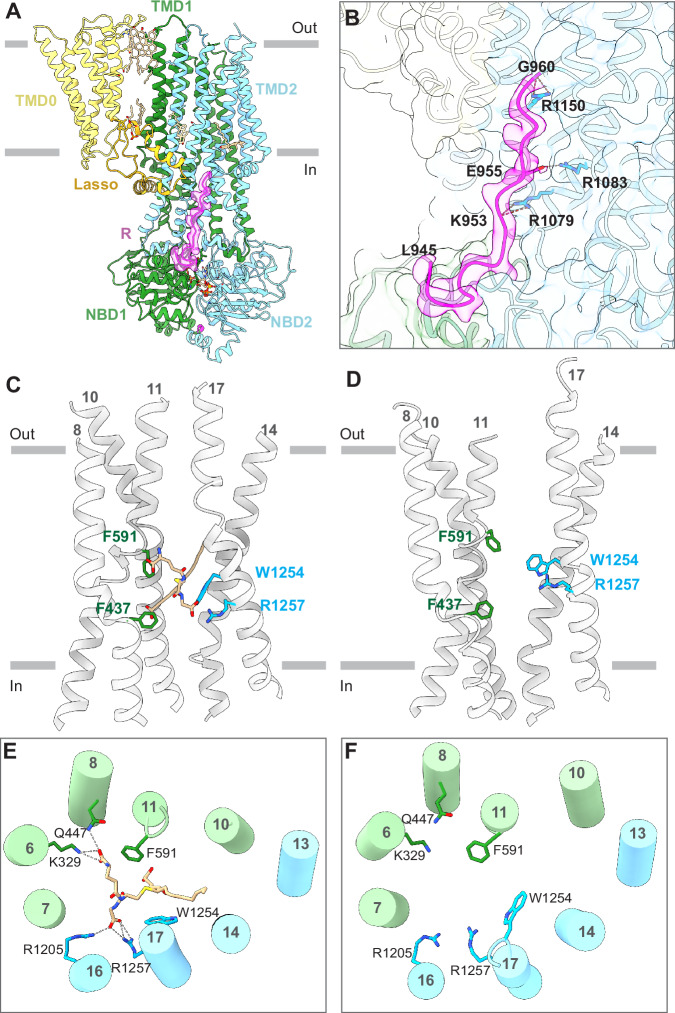
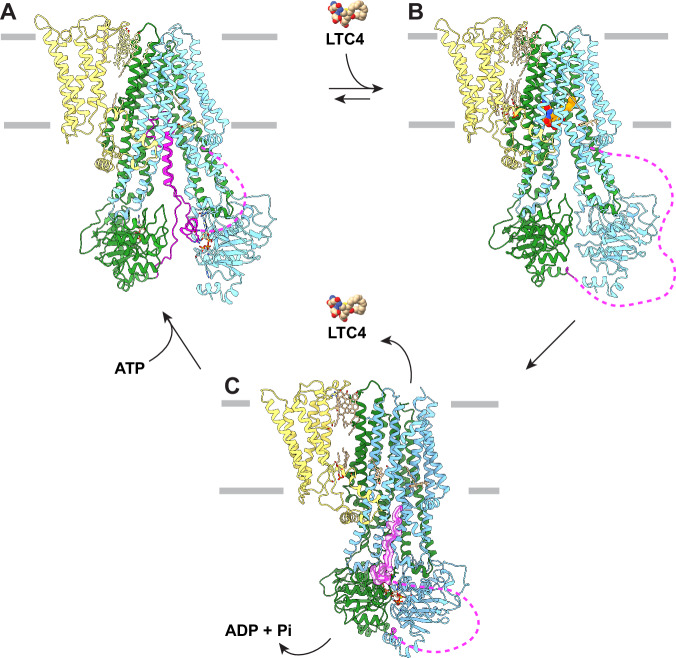
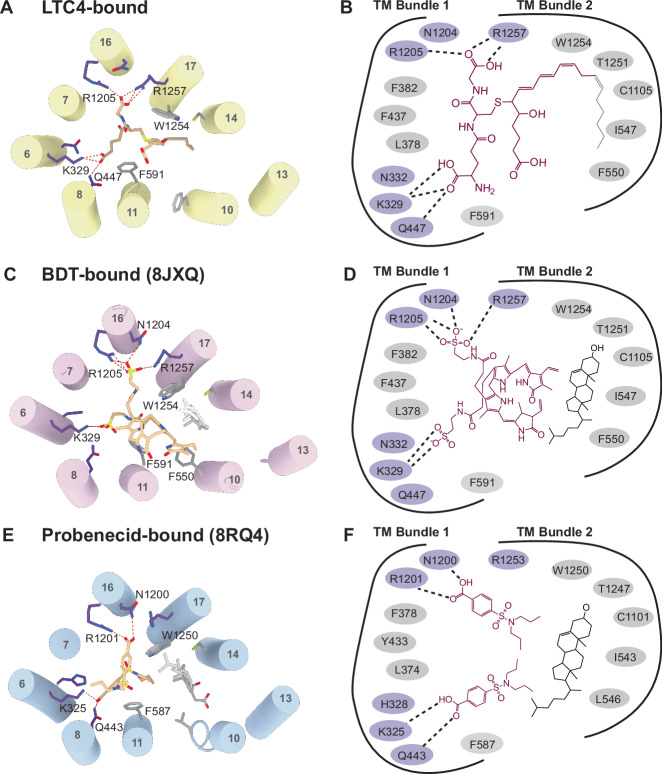
Multidrug resistance-associated protein 2 (MRP2) is an ATP-powered exporter important for maintaining liver homeostasis and a potential contributor to chemotherapeutic resistance. Deficiencies in MRP2 function are associated with Dubin-Johnson Syndrome and increased vulnerability to liver injury from cytotoxic drugs. Using cryogenic electron microscopy (cryo-EM), we determined the structures of human MRP2 in three conformational states: an autoinhibited state, a substrate-bound pre-translocation state, and an ATP-bound post-translocation state. These structures show that MRP2 functions through the classic alternating access model, driven by ATP binding and hydrolysis. Its cytosolic regulatory (R) domain serves as a selectivity gauge, wherein only sufficiently high concentrations of substrates can effectively compete with and disengage the R domain to initiate transport. Comparative structural analyses of MRP2 in complex with different substrates reveal how the transporter recognizes a diverse array of compounds, highlighting the transporter’s role in multidrug resistance.
Overview
The claims and statistics of this paper haven’t been checked yet.
Run the check — free, no account needed. It reads the open-access text and checks the sources it cites.
Integrity signals
Registry
Cites
Statistics
Figures
Verification
Claims the paper makes
The claims and statistics of this paper haven’t been checked yet.
Run the check — free, no account needed. It reads the open-access text and checks the sources it cites.
Self-check
Percentages, sums and reported differences re-computed from the paper’s own numbers.
The self-check needs the paper’s full text.
Citations
Cites
Highly accurate protein structure prediction with AlphaFold
Jumper, J., Evans, R., Pritzel, A., Green, T., Figurnov, M., Ronneberger, O., Tunyasuvunakool, K., Bates, R., Žídek, A., Potapenko, A., et al. (2021) · Nature · doi:10.1038/s41586-021-03819-2 · Cited by 43,764
MolProbity : all-atom structure validation for macromolecular crystallography
Chen, V. B., Arendall, W. B., Headd, J. J., Keedy, D. A., Immormino, R. M., Kapral, G. J., Murray, L. W., Richardson, J. S., & Richardson, D. C. (2010) · Acta Crystallographica Section D Biological Crystallography · doi:10.1107/s0907444909042073 · Cited by 14,115
MotionCor2: anisotropic correction of beam-induced motion for improved cryo-electron microscopy
Zheng, S. Q., Palovcak, E., Armache, J.-P., Verba, K. A., Cheng, Y., & Agard, D. A. (2017) · Nature Methods · doi:10.1038/nmeth.4193 · Cited by 7,777
CTFFIND4: Fast and accurate defocus estimation from electron micrographs
Rohou, A., & Grigorieff, N. (2015) · bioRxiv · doi:10.1101/020917 · Cited by 5,007
Varadi, M., Bertoni, D., Magana, P., Paramval, U., Pidruchna, I., Radhakrishnan, M., Tsenkov, M., Nair, S., Mirdita, M., Yeo, J., et al. (2024) · Nucleic Acids Research · doi:10.1093/nar/gkad1011 · Cited by 2,052
Paulusma, C. C., Kool, M., Bosma, P. J., Scheffer, G. L., ter Borg, F., Scheper, R. J., Tytgat, G. N., Borst, P., Baas, F., & Elferink, R. O. (1997) · Hepatology · doi:10.1002/hep.510250635 · Cited by 552 · cited 1×
“Patients deficient in MRP2 function develop Dubin-Johnson Syndrome, a disease caused by an excess of the bile pigment bilirubin in the liver cells 3 – 5 .”
Structural insight into substrate and inhibitor discrimination by human P-glycoprotein
Alam, A., Kowal, J., Broude, E., Roninson, I., & Locher, K. P. (2019) · Science · doi:10.1126/science.aav7102 · Cited by 469 · cited 1×
“For example, P-gp and ABCG2 both contain a central hydrophobic cavity that many small-molecules, including substrates and inhibitors, can bind largely through van der Waals interactions 12 – 17 .”
Structural Basis of Substrate Recognition by the Multidrug Resistance Protein MRP1
Johnson, Z. L., & Chen, J. (2017) · Cell · doi:10.1016/j.cell.2017.01.041 · Cited by 375 · cited 4×
“Studies deleting TMD0 in MRP1, a homolog of MRP2, showed no functional effects on ATP hydrolysis and substrate transport 9,10 .”
InfluentialSelf-citationStructural basis of small-molecule inhibition of human multidrug transporter ABCG2
Jackson, S. M., Manolaridis, I., Kowal, J., Zechner, M., Taylor, N. M. I., Bause, M., Bauer, S., Bartholomaeus, R., Bernhardt, G., Koenig, B., et al. (2018) · Nature Structural & Molecular Biology · doi:10.1038/s41594-018-0049-1 · Cited by 321
Cryo-EM structures reveal distinct mechanisms of inhibition of the human multidrug transporter ABCB1
Nosol, K., Romane, K., Irobalieva, R. N., Alam, A., Kowal, J., Fujita, N., & Locher, K. P. (2020) · Proceedings of the National Academy of Sciences · doi:10.1073/pnas.2010264117 · Cited by 256
Gerk, P. M., & Vore, M. E. (2002) · Journal of Pharmacology and Experimental Therapeutics · doi:10.1124/jpet.102.035014 · Cited by 249
Cryo-EM structures of a human ABCG2 mutant trapped in ATP-bound and substrate-bound states
Manolaridis, I., Jackson, S. M., Taylor, N. M. I., Kowal, J., Stahlberg, H., & Locher, K. P. (2018) · Nature · doi:10.1038/s41586-018-0680-3 · Cited by 228
Structure and Mechanism of Human ABC Transporters
Alam, A., & Locher, K. P. (2023) · Annual Review of Biophysics · doi:10.1146/annurev-biophys-111622-091232 · Cited by 223 · cited 1×
“The significance of this interaction is underscored by the Y440F variant of MRP1, which leads to reduced ATPase activity upon LTC4-and GSH-stimulation 23 .”
ATP Binding Enables Substrate Release from Multidrug Resistance Protein 1
Johnson, Z. L., & Chen, J. (2017) · Cell · doi:10.1016/j.cell.2017.12.005 · Cited by 178 · cited 1×
“Previous studies of MRP1 have shown that LTC4 induces a similar conformational change and accelerates the transition of MRP1 from an NBD-separated, inward-facing conformation to an NBD-dimerized, outward-facing conformation 20,21 .”
Self-citationCarcinogen and Anticancer Drug Transport by Mrp2 in Vivo: Studies Using Mrp2 (Abcc2) Knockout Mice
Vlaming, M., Mohrmann, K., Wagenaar, E., de Waart, D. D., Elferink, R. O. O., Lagas, J. S., van Tellingen, O., Vainchtein, L., Rosing, H., Beijnen, J., et al. (2006) · Journal of Pharmacology and Experimental Therapeutics · doi:10.1124/jpet.106.101774 · Cited by 174 · cited 1×
“MRP2 knockout mice exhibit hyperbilirubinemia, reduced bile flow, reduced biliary glutathione excretion, and an increase in liver size 7 .”
MRP2 haplotypes confer differential susceptibility to toxic liver injury
Choi, J. H., Ahn, B. M., Yi, J., Lee, J. H., Lee, J. H., Nam, S. W., Chon, C. Y., Han, K., Ahn, S. H., Jang, I., et al. (2007) · Pharmacogenetics and Genomics · doi:10.1097/01.fpc.0000236337.41799.b3 · Cited by 141 · cited 2×
“The inward-swing of the NBDs originates at the substrate-binding site, where TM helix 6, 8, 16, and 17 move towards each other and the side chains of F591 and W1254 reposition to contact LTC 4 (Fig.”
Yamasaki, M., Makino, T., Masuzawa, T., Kurokawa, Y., Miyata, H., Takiguchi, S., Nakajima, K., Fujiwara, Y., Matsuura, N., Mori, M., et al. (2011) · British Journal of Cancer · doi:10.1038/sj.bjc.6606071 · Cited by 140 · cited 3×
“Upon NBD-dimerization, TM helices 6, 8, and 16 move away from each other, pulling apart residues that interacts with LTC4.”
Structure of the transporter associated with antigen processing trapped by herpes simplex virus
Oldham, M. L., Grigorieff, N., & Chen, J. (2016) · eLife · doi:10.7554/elife.21829 · Cited by 101 · cited 1×
“…is reminiscent of the inhibited structure of the peptide transporter TAP, in which a viral inhibitor ICP47 forms a helical hairpin inserting into the intracellular openings of the transporter to preclude substrate binding and conformational change necessary for transport function 18,19 .”
Self-citation
Research works printed but not linked: 20
- 10.1002/(SICI)1521-1878(199811)20:11<931::AID-BIES8>3.0.CO;2-J · DOI
- 10.1152/ajpgi.00362.2002 · DOI
- 2006, Neonatal Dubin-Johnson Syndrome: Long-Term Follow-up and MRP2 Mutations Study, Pediatr. Res, 59, 584, 10.1203/01.pdr.0000203093.10908.bb · DOI
- 10.1074/jbc.273.48.32167 · DOI · Paper page
- 10.1038/s41467-020-16155-2 · DOI · Paper page
- 10.1016/j.jmb.2021.166980 · DOI
- 10.1038/nature16506 · DOI
- Wang, L. et al. Characterization of the kinetic cycle of an ABC transporter by single-molecule and cryo-EM analyses. eLife 9, e56451. · DOI
- 1999, Drug Resistance and ATP-Dependent Conjugate Transport Mediated by the Apical Multidrug Resistance Protein, MRP2, Permanently Expressed in Human and Canine Cells, Mol. Pharmacol., 55, 929
- 10.1124/dmd.108.022491 · DOI
- 2024, Transport mechanism of human bilirubin transporter ABCC2 tuned by the inter-module regulatory domain, Nat. Commun, 15, 1061, 10.1038/s41467-024-45337-5 · DOI
- 2024, Structural basis for the modulation of MRP2 activity by phosphorylation and drugs, Nat. Commun, 15, 1983, 10.1038/s41467-024-46392-8 · DOI
- 10.1124/mol.57.4.760 · DOI · Paper page
- 2023, A macrocyclic peptide inhibitor traps MRP1 in a catalytically incompetent conformation, Proc. Natl. Acad. Sci, 120, e2220012120, 10.1073/pnas.2220012120 · DOI
- 1979, Validation of a recording spectrophotometric method for measurement of membrane-associated Mg- and NaK-ATPase activity, J. Lab. Clin. Med, 93, 790
- 10.1016/j.jsb.2005.07.007 · DOI
- 10.1016/j.jsb.2015.08.008 · DOI · Paper page
- 10.7554/eLife.42166 · DOI · Paper page
- 2018, ISOLDE: a physically realistic environment for model building into low-resolution electron-density maps, Acta Crystallogr. Sect. Struct. Biol, 74, 519, 10.1107/S2059798318002425 · DOI · Paper page
- 2019, Macromolecular structure determination using X-rays, neutrons and electrons: recent developments in Phenix, Acta Crystallogr. Sect. Struct. Biol, 75, 861, 10.1107/S2059798319011471 · DOI · Paper page
Metadata
- Authors
- Koide, E., Pietz, H. L., Beltran, J., & Chen, J.
- Affiliations
- Rockefeller University (US)
- Davidson College (US)
- Howard Hughes Medical Institute (US)
- Corresponding author
- Chen, Jue
- Venue
- Nature Communications
- Publisher
- openRxiv
- Published
- 2024-06-25
- Volume
- 16
- Issue
- 1
- Pages
- 484-484
- ISSN
- 2041-1723 (ISSN-L)
- PMC
- PMC11711199
- OpenAlex
- W4406152854
- Cited by
- 17
- References
- 20
- Citations by year
- 2026: 11 · 2025: 5 · 2024: 1
- FWCI
- 6.59
- Type
- journal article
- Language
- en
- Open access
- gold
- doi.org
- Licence
- cc-by
- Locations
- Nature Communications (publishedVersion, cc-by)
- bioRxiv (Cold Spring Harbor Laboratory) (acceptedVersion, cc-by)
- PubMed Central (publishedVersion, cc-by)
- PubMed (publishedVersion)
- PubMed Central (submittedVersion)
- RePEc: Research Papers in Economics (submittedVersion)
- DOAJ (DOAJ: Directory of Open Access Journals) (submittedVersion, cc-by-sa)
- Funders
- Howard Hughes Medical Institute
- Weill Cornell Medical College (T32GM007739)
- National Cancer Institute (F30CA257282)
- National Institute of General Medical Sciences (T32GM007739)
- Topics
- Health Sciences › Medicine › Oncology › Drug Transport and Resistance Mechanisms
- Health Sciences › Medicine › Microbiology (medical) › Antibiotic Resistance in Bacteria
- Life Sciences › Biochemistry, Genetics and Molecular Biology › Molecular Biology › ATP Synthase and ATPases Research
- Keywords
- MRP2, ABC transporters, ATP-binding cassette, substrate specificity, regulatory domain, autoinhibition, conformational change, nucleotide-binding domain, substrate binding, multidrug resistance, chemoresistance, liver homeostasis, drug efflux
About these checks
Registry, retraction, Cites and statistics results are computed, not judged, with one exception: a printed reference that no index lists is read once by a model before it counts as a citation error. Claims are extracted by a model and kept only when their quote appears verbatim in the text; each cited source is then checked, with a model’s help, for whether it says what the claim relies on. Those verdicts can be wrong — read the claim’s quote and the cited source before relying on one.
Statistics and arithmetic are recomputed, not judged.
Confidence bands are shown only for fields calibrated on our annotated test set. None is calibrated yet, so no band is shown.
What counts as a claim ›How we measure confidence ›How we check this ›
Are you an author, or do you see a problem with this page? Request a review
Data sources
Bibliographic data: Semantic Scholar, OpenAlex, Crossref.
Contains information from the Semantic Scholar Academic Graph Datasets, made available under the ODC Attribution License (ODC-BY 1.0).
Semantic Scholar’s data is described in: Kinney, R., et al. (2023). The Semantic Scholar Open Data Platform. arXiv:2301.10140.
