PreprintCited by 5Lipid Membrane Structure and BehaviorPhagocytosis and Immune RegulationCell death mechanisms and regulation

The DOI matches its Crossref record; 1 of the 1 references it cites were found in a registry or an index.

Structure and function of the human apoptotic scramblase Xkr4

Open access

Preprint — published as 10.1038/s41467-025-62739-1 · Paper page

Abstract

Phosphatidylserine externalization on the surface of dying cells is a key signal for their recognition and clearance by macrophages and is mediated by members of the X-Kell related (Xkr) protein family. Defective Xkr-mediated scrambling impairs clearance, leading to inflammation. It was proposed that activation of the Xkr4 apoptotic scramblase requires caspase cleavage, followed by dimerization and ligand binding. Here, using a combination of biochemical approaches we show that purified monomeric, full-length human Xkr4 (hXkr4) scrambles lipids. CryoEM imaging shows that hXkr4 adopts a novel conformation, where three conserved acidic residues create an electronegative surface embedded in the membrane. Molecular dynamics simulations show this conformation induces membrane thinning, which could promote scrambling. Thinning is ablated or reduced in conditions where scrambling is abolished or reduced. Our work provides insights into the molecular mechanisms of hXkr4 scrambling and suggests the ability to thin membranes might be a general property of active scramblases.

Overview

The claims and statistics of this paper haven’t been checked yet.

Run the check — free, no account needed. It reads the open-access text and checks the sources it cites.

A few free checks a day · papers already verified open instantly · results are public

Integrity signals

Registry

Crossref · 10.1101/2024.08.07.607004

Cites

1 of 1 references verified0 citation errors · 0 not checkable

Statistics

Figures

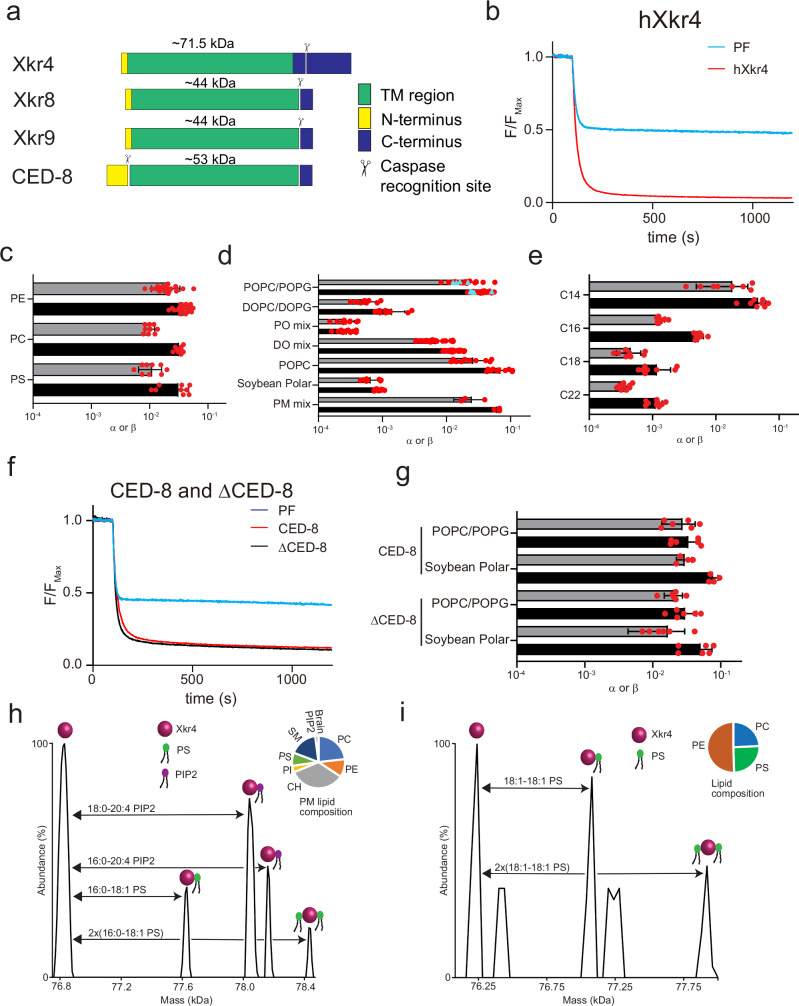
Fig. 1 Characterization of hXkr4 and CED-8 in proteoliposomes. a Domain organization of Xkr4, Xkr8, Xkr9 and CED-8. b Representative traces of the dithionite induced fluorescence decay in the scrambling assay for protein free liposomes (cyan) and hXkr4 (red) reconstituted in 7:3 POPC:POPG mixed membranes. c–e Forward (α) and reverse (β) scrambling rate constants of hXk4 reconstituted in 7:3 POPC:POPG mixed membranes doped with NBD-labeled PE (n = 19), PC (n = 9), or PS (n = 9) lipids (c), reconstituted in membranes formed from 7:3 POPC:POPG (n = 23), 7:3 DOPC:DOPG (n = 8), PO-mix (n = 10), DO-mix (n = 24), POPC (n = 10), Soybean (n = 10), PM mix (n = 3) (d), or with fixed 7 PC: 3 PG headgroup and acyl chain length C14 (n = 8), C16 (n = 9), C18 (n = 8), C22 (n = 9) (e). f Representative traces of the dithionite induced fluorescence decay in the scrambling assay for protein free liposomes (cyan), CED-8 (red), and ΔCED-8 (black) reconstituted in 7:3 POPC:POPG mixed membranes. g Forward (α) and reverse (β) scrambling rate constants of CED-8 and ΔCED-8 in liposomes formed from 7:3 POPC:POPG (n = 6 for CED-8 and n = 6 for ΔCED-8) or Soybean Polar lipids (n = 4 for CED-8 and n = 6 for ΔCED-8). Bars in panels (c, d, e, g) are averages for α (black) and β (gray) (N ≥ 3), error bars are S. Dev., and red circles are values from individual repeats whose values are reported in the Source Data Files. h, i Deconvoluted mass plot obtained from nMS analysis of hXkr4 from PM-mimicking liposomes (h) or from 2:1:1 DOPE:DOPC:DOPS (DO mix) liposomes (i). The relative lipid composition is given in the pie charts (insets) and in Supplementary Table 1.
Fig. 1 Characterization of hXkr4 and CED-8 in proteoliposomes. a Domain organization of Xkr4, Xkr8, Xkr9 and CED-8. b Representative traces of the dithionite induced fluorescence decay in the scrambling assay for protein free liposomes (cyan) and hXkr4 (red) reconstituted in 7:3 POPC:POPG mixed membranes. c–e Forward (α) and reverse (β) scrambling rate constants of hXk4 reconstituted in 7:3 POPC:POPG mixed membranes doped with NBD-labeled PE (n = 19), PC (n = 9), or PS (n = 9) lipids (c), reconstituted in membranes formed from 7:3 POPC:POPG (n = 23), 7:3 DOPC:DOPG (n = 8), PO-mix (n = 10), DO-mix (n = 24), POPC (n = 10), Soybean (n = 10), PM mix (n = 3) (d), or with fixed 7 PC: 3 PG headgroup and acyl chain length C14 (n = 8), C16 (n = 9), C18 (n = 8), C22 (n = 9) (e). f Representative traces of the dithionite induced fluorescence decay in the scrambling assay for protein free liposomes (cyan), CED-8 (red), and ΔCED-8 (black) reconstituted in 7:3 POPC:POPG mixed membranes. g Forward (α) and reverse (β) scrambling rate constants of CED-8 and ΔCED-8 in liposomes formed from 7:3 POPC:POPG (n = 6 for CED-8 and n = 6 for ΔCED-8) or Soybean Polar lipids (n = 4 for CED-8 and n = 6 for ΔCED-8). Bars in panels (c, d, e, g) are averages for α (black) and β (gray) (N ≥ 3), error bars are S. Dev., and red circles are values from individual repeats whose values are reported in the Source Data Files. h, i Deconvoluted mass plot obtained from nMS analysis of hXkr4 from PM-mimicking liposomes (h) or from 2:1:1 DOPE:DOPC:DOPS (DO mix) liposomes (i). The relative lipid composition is given in the pie charts (insets) and in Supplementary Table 1.CC BY-NC-ND · PubMed Central
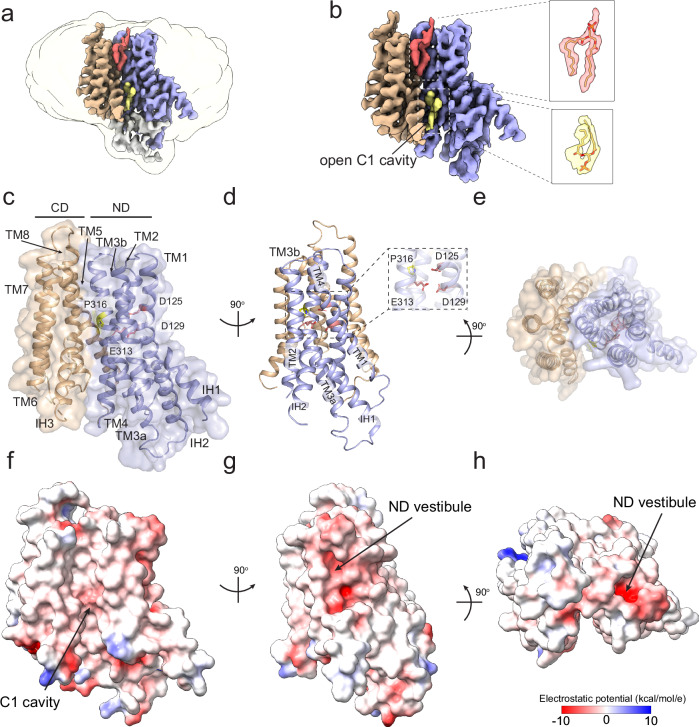
Fig. 2 Structure of hXkr4. a, b CryoEM density of hXkr4 in LMNG-CHS detergent micelles. The ND repeat is colored in pale blue, the CD repeat in wheat. Associated lipid-like densities are shown in yellow (inner leaflet) and red (outer leaflet). Insets show close-up views of the two lipid-like densities in the C1 cavity. c–e The structure of hXkr4 viewed from the plane of the membrane (c), from the side of the ND repeat (d), and from the extracellular solution (e). The protein is shown in ribbon representation with the ND repeat in pale blue, the CD repeat in wheat, the charged stairway residues (D125, D129, and E313 in pink) and P316 (in yellow) are shown in stick representation. The transparent surface representation of the protein is shown in (c) and (e). f–h Electrostatic potential plotted on the surface of hXkr4 from the same views as in (c–e).
Fig. 2 Structure of hXkr4. a, b CryoEM density of hXkr4 in LMNG-CHS detergent micelles. The ND repeat is colored in pale blue, the CD repeat in wheat. Associated lipid-like densities are shown in yellow (inner leaflet) and red (outer leaflet). Insets show close-up views of the two lipid-like densities in the C1 cavity. c–e The structure of hXkr4 viewed from the plane of the membrane (c), from the side of the ND repeat (d), and from the extracellular solution (e). The protein is shown in ribbon representation with the ND repeat in pale blue, the CD repeat in wheat, the charged stairway residues (D125, D129, and E313 in pink) and P316 (in yellow) are shown in stick representation. The transparent surface representation of the protein is shown in (c) and (e). f–h Electrostatic potential plotted on the surface of hXkr4 from the same views as in (c–e).CC BY-NC-ND · PubMed Central
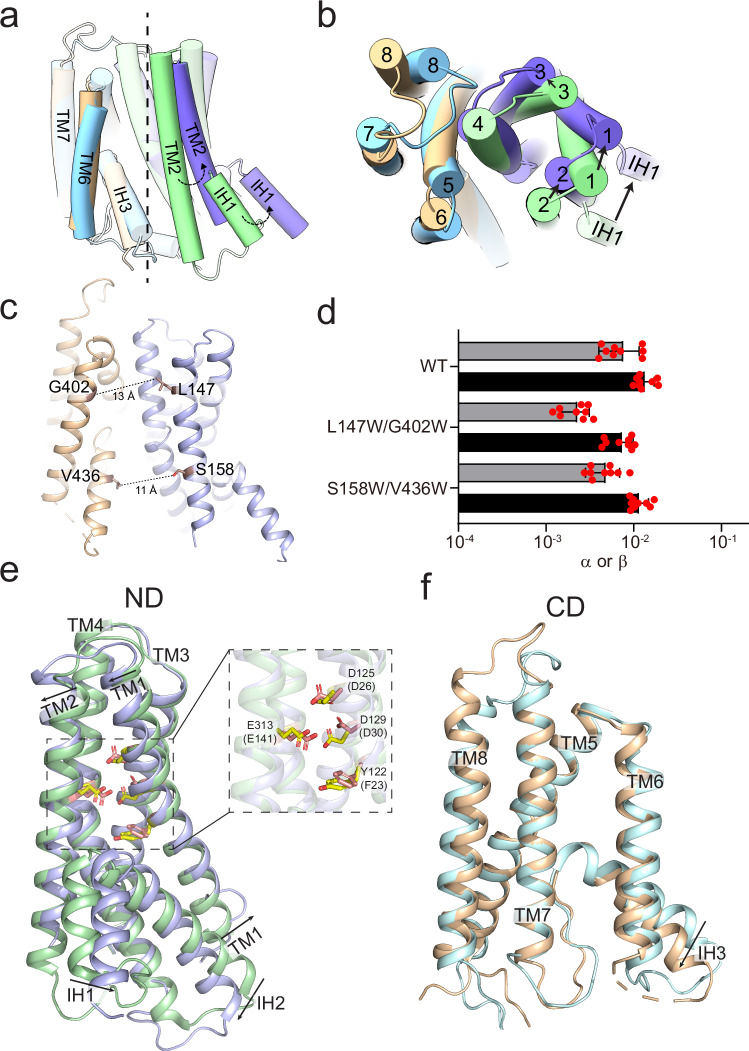
Fig. 3 Structural changes in Xkr4. a, b The cryoEM structures of hXkr4 and hXkr8 (PDBID: 8XEJ), shown in cylindrical cartoon representations, are aligned on their respective CD domains (wheat for hXkr4 and cyan for hXkr8). The pseudo-symmetry axis (dashed vertical line, panel a) and angle of rotation of the ND of hXkr4 (pale blue) relative to the ND of hXkr8 (pale green) is viewed from the plane of the membrane (a) or from the extracellular solution (b). The C-terminal helix of hXkr8 is colored in pink. c The distance between the Cα atoms (maroon spheres) of L147 and S158 on TM2 and of G402W on TM6 and V436 on IH3 is shown (dashed lines). d Forward (α) and reverse (β) scrambling rate constants of WT (n = 9), L147W/G402W (n = 9), S158W/V436W (n = 9) hXkr4 reconstituted in DO-mix liposomes. Bars are averages for α (black) and β (gray) (N ≥ 3), error bars are S. Dev., and red circles are values from individual repeats whose values are reported in the Source Data Files. Alignment of the ND (e) and CD (f) repeats of hXkr4. Colors as in (a, b). Arrows denote direction of movement of the helices from hXkr8 to hXkr4. The charged residues in the ND of hXkr4 (hXkr8), D125 (D26), D129 (D30), E313 (E141), and Y122 (F23) are shown in stick representation and colored in yellow CPK (hXkr4) or pink CPK (hXkr8). Inset of (e) shows a close-up view of these residues.
Fig. 3 Structural changes in Xkr4. a, b The cryoEM structures of hXkr4 and hXkr8 (PDBID: 8XEJ), shown in cylindrical cartoon representations, are aligned on their respective CD domains (wheat for hXkr4 and cyan for hXkr8). The pseudo-symmetry axis (dashed vertical line, panel a) and angle of rotation of the ND of hXkr4 (pale blue) relative to the ND of hXkr8 (pale green) is viewed from the plane of the membrane (a) or from the extracellular solution (b). The C-terminal helix of hXkr8 is colored in pink. c The distance between the Cα atoms (maroon spheres) of L147 and S158 on TM2 and of G402W on TM6 and V436 on IH3 is shown (dashed lines). d Forward (α) and reverse (β) scrambling rate constants of WT (n = 9), L147W/G402W (n = 9), S158W/V436W (n = 9) hXkr4 reconstituted in DO-mix liposomes. Bars are averages for α (black) and β (gray) (N ≥ 3), error bars are S. Dev., and red circles are values from individual repeats whose values are reported in the Source Data Files. Alignment of the ND (e) and CD (f) repeats of hXkr4. Colors as in (a, b). Arrows denote direction of movement of the helices from hXkr8 to hXkr4. The charged residues in the ND of hXkr4 (hXkr8), D125 (D26), D129 (D30), E313 (E141), and Y122 (F23) are shown in stick representation and colored in yellow CPK (hXkr4) or pink CPK (hXkr8). Inset of (e) shows a close-up view of these residues.CC BY-NC-ND · PubMed Central
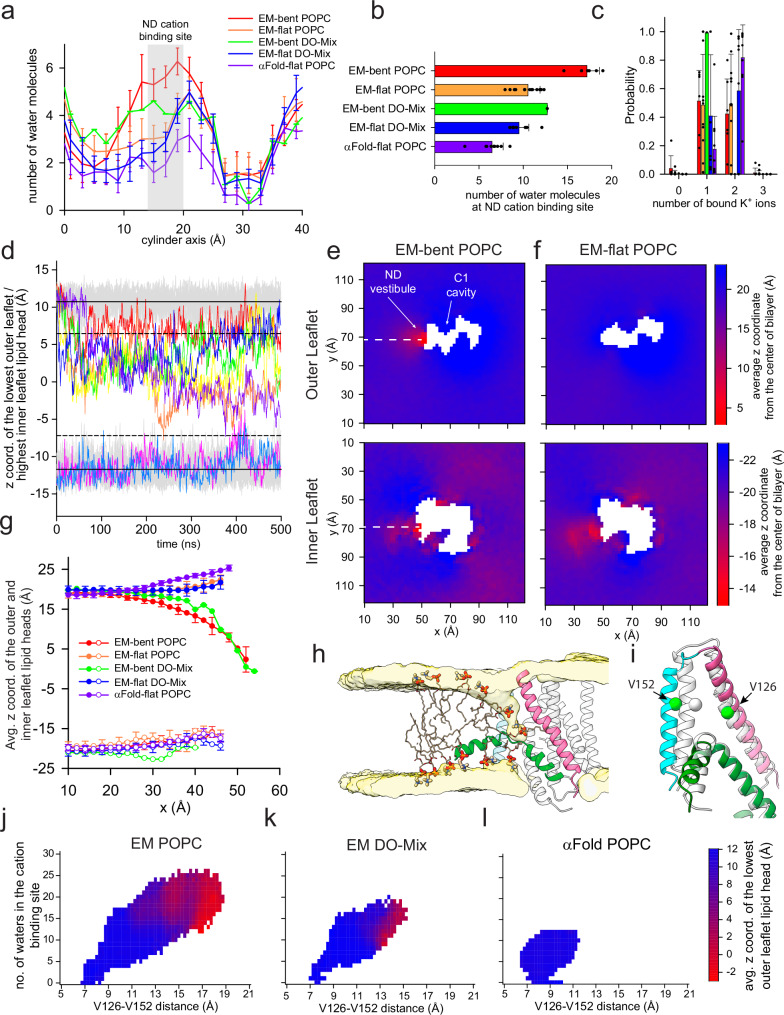
Fig. 4 Hydration, ion binding and membrane thinning by hXkr4. a The average number of water molecules along the cylindrical axis along the ND vestibule (Fig. 4 Supplementary Fig. 1a) for trajectories of cryoEM hXkr4 where the membrane bends (EM-bent) or where it remains flat (EM-flat), in POPC lipids (EM-bent POPC, red, n = 6; EM-flat POPC, orange, n = 14), or in DO-Mix membranes (EM-bent DO-Mix, green, n = 1; EM-flat DO-Mix, blue, n = 9), and of αFold model hXkr4 in POPC (αFold-flat POPC, purple, n = 10). See Methods for details. The region of the cation site in the ND vestibule (near D125, D129, and E313, 16 Å<h < 20 Å) is colored in gray. b, c The average total number of water molecules in the ND cation site (b) and the probability distribution of the number of K+ ions in the ND cation site (c) for the same trajectory groups as in (a). Filled black circles in (b, c) represent values from individual trajectories. Error bars in (a–c) are the St.Dev. of the values from individual trajectories. For EM-bent DO-Mix n = 1, as we observe membrane bending only in 1 trajectory, so no error is reported. d Time evolution of the z coordinate of the phosphorous atom in the lowest/highest outer/inner leaflet lipid headgroup of individual trajectories of EM-flat POPC (gray) and EM-bent POPC (colored). Solid and dotted lines represent the Avg. and Avg.+ or - 3xSt.Dev of the z coordinate for IL and OL, respectively. e, f Two-dimensional (2D) plot of the average z coordinate of the phosphorous atoms in the outer (top panel) and inner (bottom panel) leaflet lipid headgroups on the x-y plane of the simulation box, calculated from EM-bent POPC (e) or EM-flat POPC (f) trajectories. Individual pixels are colored from red to blue by the average z coordinate displacement. g Cross-section of the 2D plot calculated along the white dotted lines in (e, f) for the outer (filled circles) and inner (empty circles) leaflets. Data is Mean± St.Dev. n as in (a). h Representative snapshot from an EM-bent POPC trajectory. hXkr4 is shown in cartoon representation with TM1 (pink), TM2 (cyan), and IH1 (green), TM3-8 are in light gray. The average lipid head density of the outer and inner leaflets is shown in surface representation (light yellow). Representative lipid molecules are shown in stick, headgroup atoms in thicker sticks. i Superposition of the TM1, TM2, and IH1 from the cryoEM (light gray) and representative MD frame (colored as in h), where the Cα distances between V126 in TM1 and V152 in TM2, shown as spheres (green), are ~7.5 (cryoEM) and ~15 Å (MD). j–l The average z coordinate of the phosphorous atom of the headgroups from the lowest outer leaflet lipid (colored from is plotted as a function of the V126-V152 Cα distance (x axis) and of the number of water molecules in the cation site in the ND vestibule (y axis) for trajectories for cryoEM hXkr4 in POPC (j) or DO-Mix membranes (k) or for αFold hXkr4 POPC (l).
Fig. 4 Hydration, ion binding and membrane thinning by hXkr4. a The average number of water molecules along the cylindrical axis along the ND vestibule (Fig. 4 Supplementary Fig. 1a) for trajectories of cryoEM hXkr4 where the membrane bends (EM-bent) or where it remains flat (EM-flat), in POPC lipids (EM-bent POPC, red, n = 6; EM-flat POPC, orange, n = 14), or in DO-Mix membranes (EM-bent DO-Mix, green, n = 1; EM-flat DO-Mix, blue, n = 9), and of αFold model hXkr4 in POPC (αFold-flat POPC, purple, n = 10). See Methods for details. The region of the cation site in the ND vestibule (near D125, D129, and E313, 16 Å<h < 20 Å) is colored in gray. b, c The average total number of water molecules in the ND cation site (b) and the probability distribution of the number of K+ ions in the ND cation site (c) for the same trajectory groups as in (a). Filled black circles in (b, c) represent values from individual trajectories. Error bars in (a–c) are the St.Dev. of the values from individual trajectories. For EM-bent DO-Mix n = 1, as we observe membrane bending only in 1 trajectory, so no error is reported. d Time evolution of the z coordinate of the phosphorous atom in the lowest/highest outer/inner leaflet lipid headgroup of individual trajectories of EM-flat POPC (gray) and EM-bent POPC (colored). Solid and dotted lines represent the Avg. and Avg.+ or - 3xSt.Dev of the z coordinate for IL and OL, respectively. e, f Two-dimensional (2D) plot of the average z coordinate of the phosphorous atoms in the outer (top panel) and inner (bottom panel) leaflet lipid headgroups on the x-y plane of the simulation box, calculated from EM-bent POPC (e) or EM-flat POPC (f) trajectories. Individual pixels are colored from red to blue by the average z coordinate displacement. g Cross-section of the 2D plot calculated along the white dotted lines in (e, f) for the outer (filled circles) and inner (empty circles) leaflets. Data is Mean± St.Dev. n as in (a). h Representative snapshot from an EM-bent POPC trajectory. hXkr4 is shown in cartoon representation with TM1 (pink), TM2 (cyan), and IH1 (green), TM3-8 are in light gray. The average lipid head density of the outer and inner leaflets is shown in surface representation (light yellow). Representative lipid molecules are shown in stick, headgroup atoms in thicker sticks. i Superposition of the TM1, TM2, and IH1 from the cryoEM (light gray) and representative MD frame (colored as in h), where the Cα distances between V126 in TM1 and V152 in TM2, shown as spheres (green), are ~7.5 (cryoEM) and ~15 Å (MD). j–l The average z coordinate of the phosphorous atom of the headgroups from the lowest outer leaflet lipid (colored from is plotted as a function of the V126-V152 Cα distance (x axis) and of the number of water molecules in the cation site in the ND vestibule (y axis) for trajectories for cryoEM hXkr4 in POPC (j) or DO-Mix membranes (k) or for αFold hXkr4 POPC (l).CC BY-NC-ND · PubMed Central
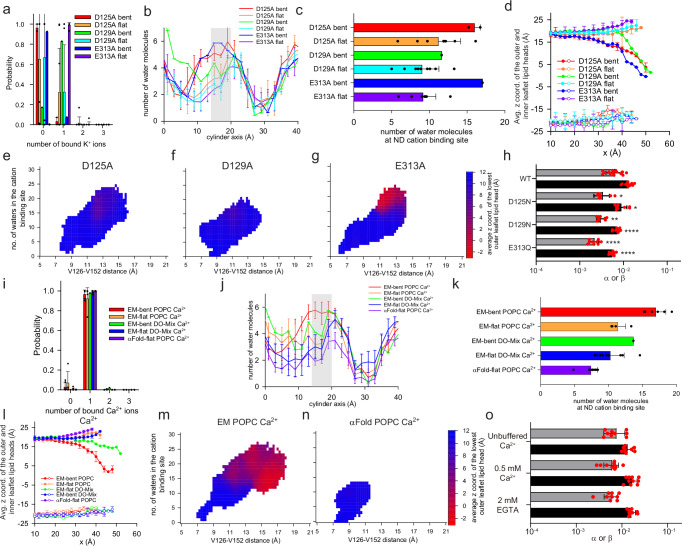
Fig. 5 Role of charged stairway residues and Ca2+ binding to hXkr4. a–g Probability distribution of the number of K+ ions in the ND cation site (a), distribution of water molecules in the ND repeat vestibule (b), total number of water molecules in the ND cation site (c), average z coordinate of the phosphorous atom of the lower/highest lipid headgroup from the outer/inner leaflet in MD trajectories of hXkr4 D125A bent (red, n = 2), D125A flat (orange, n = 8), D129A bent (green, n = 1), D129A flat (cyan, n = 9), E313A bent (blue, n = 1), or E313A flat (purple, n = 9) in POPC membranes (d). Data is mean (e–g) the average z coordinate of the phosphorous atom of the headgroups from the lowest outer leaflet lipid (colored from is plotted as a function of the V126-V152 Cα distance (x axis) and of the number of water molecules in the cation site in the ND vestibule (y axis) for trajectories for D125A (e), D129A (f), and E313A (g). h Forward (α) and reverse (β) scrambling rate constants of WT (n = 15), D125N (n = 9), D129N (n = 9), and E313Q (n = 9) hXkr4 reconstituted in DO-Mix liposomes. I–k Quantification of Ca2+ or water molecules observed during simulation. Bars are averages for α (black) and β (gray) (N ≥ 3), error bars are S. Dev., and red circles are values from individual repeats whose values are reported in the Source Data Files. *-**** denote the statistical significance evaluated using a two sided Student’s t-test and comparing to the WT experiments that were carried out in side-by-side reconstitutions. The WT data points are included in Fig. 1d. p(αD125N) = 0.001, p(βD125N) = 0.003; p(αD129N) < 0.0001, p(βD129N) = 0.0001; p(αE313Q) < 0.0001, p(βE313Q) < 0.0001. l–n Same plots as in (a–g) but for simulations of hXkr4 in cryoEM conformation in POPC (n = 6 for bent, and n = 4 for flat) and DO-mix (n = 1 for bent and n = 9 for flat) membranes in the presence of Ca2+, and for hXkr4α in POPC membranes with Ca2+ (n = 10 for flat). o Forward (α) and reverse (β) scrambling rate constants of hXk4 reconstituted in DO-Mix liposomes in unbuffered Ca2+ (~10 µM) (n = 9), 2 mM EGTA ( < 10 nM Ca2+) (n = 9), and 0.5 mM Ca2+ (n = 10). Data in all panels is Mean± St.Dev. and red circles are values from individual repeats whose values are reported in the Source Data Files.
Fig. 5 Role of charged stairway residues and Ca2+ binding to hXkr4. a–g Probability distribution of the number of K+ ions in the ND cation site (a), distribution of water molecules in the ND repeat vestibule (b), total number of water molecules in the ND cation site (c), average z coordinate of the phosphorous atom of the lower/highest lipid headgroup from the outer/inner leaflet in MD trajectories of hXkr4 D125A bent (red, n = 2), D125A flat (orange, n = 8), D129A bent (green, n = 1), D129A flat (cyan, n = 9), E313A bent (blue, n = 1), or E313A flat (purple, n = 9) in POPC membranes (d). Data is mean (e–g) the average z coordinate of the phosphorous atom of the headgroups from the lowest outer leaflet lipid (colored from is plotted as a function of the V126-V152 Cα distance (x axis) and of the number of water molecules in the cation site in the ND vestibule (y axis) for trajectories for D125A (e), D129A (f), and E313A (g). h Forward (α) and reverse (β) scrambling rate constants of WT (n = 15), D125N (n = 9), D129N (n = 9), and E313Q (n = 9) hXkr4 reconstituted in DO-Mix liposomes. I–k Quantification of Ca2+ or water molecules observed during simulation. Bars are averages for α (black) and β (gray) (N ≥ 3), error bars are S. Dev., and red circles are values from individual repeats whose values are reported in the Source Data Files. *-**** denote the statistical significance evaluated using a two sided Student’s t-test and comparing to the WT experiments that were carried out in side-by-side reconstitutions. The WT data points are included in Fig. 1d. p(αD125N) = 0.001, p(βD125N) = 0.003; p(αD129N) < 0.0001, p(βD129N) = 0.0001; p(αE313Q) < 0.0001, p(βE313Q) < 0.0001. l–n Same plots as in (a–g) but for simulations of hXkr4 in cryoEM conformation in POPC (n = 6 for bent, and n = 4 for flat) and DO-mix (n = 1 for bent and n = 9 for flat) membranes in the presence of Ca2+, and for hXkr4α in POPC membranes with Ca2+ (n = 10 for flat). o Forward (α) and reverse (β) scrambling rate constants of hXk4 reconstituted in DO-Mix liposomes in unbuffered Ca2+ (~10 µM) (n = 9), 2 mM EGTA ( < 10 nM Ca2+) (n = 9), and 0.5 mM Ca2+ (n = 10). Data in all panels is Mean± St.Dev. and red circles are values from individual repeats whose values are reported in the Source Data Files.CC BY-NC-ND · PubMed Central

Verification

Claims the paper makes

The claims and statistics of this paper haven’t been checked yet.

Run the check — free, no account needed. It reads the open-access text and checks the sources it cites.

A few free checks a day · papers already verified open instantly · results are public

Self-check

Percentages, sums and reported differences re-computed from the paper’s own numbers.

The self-check needs the paper’s full text.

Citations

Cites

Research works printed but not linked: 81

  1. 10.1152/physrev.00020.2015 · DOI
  2. Sakuragi, T. and S. Nagata , Regulation of phospholipid distribution in the lipid bilayer by flippases and scramblases. Nature Reviews Molecular Cell Biology, 2023. · DOI
  3. 10.1016/j.cub.2018.01.007 · DOI
  4. 2017, Anoctamins/TMEM16 Proteins: Chloride Channels Flirting with Lipids and Extracellular Vesicles, Annu Rev Physiol, 10, 119
  5. 2007, Apoptosis in health and disease and modulation of apoptosis for therapy: An overview, Indian J Clin Biochem, 22, 6, 10.1007/BF02913307 · DOI
  6. 10.1038/471310a · DOI
  7. 10.1110/ps.04789804 · DOI
  8. 10.1038/ni.3253 · DOI · Paper page
  9. 2020, Efferocytosis in health and disease, Nature Reviews Immunology, 20, 254, 10.1038/s41577-019-0240-6 · DOI · Paper page
  10. 10.1007/s10495-008-0187-8 · DOI
  11. 2021, Release mechanisms of major DAMPs, Apoptosis, 26, 152, 10.1007/s10495-021-01663-3 · DOI
  12. 2019, Inflammation and its resolution in atherosclerosis: mediators and therapeutic opportunities, Nature Reviews Cardiology, 16, 389
  13. 10.1016/j.gene.2005.10.037 · DOI
  14. 10.1126/science.1236758 · DOI
  15. 10.1074/jbc.M114.583419 · DOI
  16. 10.1038/ng.81 · DOI · Paper page
  17. 10.1073/pnas.1720732115 · DOI
  18. 2017, Xk-related protein 8 regulates myoblast differentiation and survival, The FEBS Journal, 284, 3575, 10.1111/febs.14261 · DOI
  19. 2018, XK-related protein 5 (XKR5) is a novel negative regulator of KIT/D816V-mediated transformation, Oncogenesis, 7, 48, 10.1038/s41389-018-0057-3 · DOI
  20. 10.1152/ajplung.00320.2007 · DOI
  21. 10.1046/j.1440-1711.2003.t01-1-01170.x · DOI · Paper page
  22. 2021, Caspase cleavage releases a nuclear protein fragment that stimulates phospholipid scrambling at the plasma membrane, Mol Cell, 81, 1397, 10.1016/j.molcel.2021.02.025 · DOI
  23. 2017, XKR4 Gene Effects on Cerebellar Development Are Not Specific to ADHD, Front Cell Neurosci, 11, 396, 10.3389/fncel.2017.00396 · DOI
  24. 2013, Imaging gene and environmental effects on cerebellum in Attention-Deficit/Hyperactivity Disorder and typical development, NeuroImage: Clinical, 2, 103, 10.1016/j.nicl.2012.11.010 · DOI
  25. 10.1016/j.bcp.2007.06.042 · DOI
  26. 2013, Caspase-mediated activation of Caenorhabditis elegans CED-8 promotes apoptosis and phosphatidylserine externalization, Nature Communications, 4, 2726, 10.1038/ncomms3726 · DOI
  27. 10.1073/pnas.1820499116 · DOI
  28. 10.1073/pnas.1610403113 · DOI
  29. 2023, Extracellular calcium functions as a molecular glue for transmembrane helices to activate the scramblase Xkr4, Nat Commun, 14, 5592, 10.1038/s41467-023-40934-2 · DOI
  30. 10.1038/s41594-021-00665-8 · DOI
  31. 10.7554/eLife.69800 · DOI
  32. 10.1073/PNAS.2205425119/SUPPL_FILE/PNAS.2205425119.SM02.MP4 · DOI
  33. 10.1002/bies.202200106 · DOI
  34. Ghanbarpour, A. , et al., A model for a partnership of lipid transfer proteins and scramblases in membrane expansion and organelle biogenesis. Proc Natl Acad Sci U S A, 2021. 118(16). · DOI
  35. Adlakha, J. , et al., Structural and biochemical insights into lipid transport by VPS13 proteins. J Cell Biol, 2022. 221(5). · DOI
  36. 2024, The role of the C-terminal tail region as a plug to regulate XKR8 lipid scramblase, J Biol Chem, 300, 105755, 10.1016/j.jbc.2024.105755 · DOI
  37. 10.1007/s00018-006-6167-7 · DOI
  38. 2022, TMEM16 scramblases thin the membrane to enable lipid scrambling, Nat Commun, 13, 2604, 10.1038/s41467-022-30300-z · DOI
  39. Falzone, M.E. , et al., Structural basis of Ca(2+)-dependent activation and lipid transport by a TMEM16 scramblase. Elife, 2019. 8. · DOI
  40. 2023, Direct determination of oligomeric organization of integral membrane proteins and lipids from intact customizable bilayer, Nat Methods, 20, 891, 10.1038/s41592-023-01864-5 · DOI
  41. 2023, Studying Membrane Protein-Lipid Specificity through Direct Native Mass Spectrometric Analysis from Tunable Proteoliposomes, J Am Soc Mass Spectrom, 34, 1917, 10.1021/jasms.3c00110 · DOI
  42. 10.1016/j.str.2012.06.009 · DOI
  43. 10.1038/nprot.2014.173 · DOI
  44. Malvezzi, M. , et al., Out of the groove transport of lipids by TMEM16 and GPCR scramblases PNAS, 2018. · DOI
  45. 10.1007/978-1-0716-0373-4_15 · DOI
  46. Feng, Z. , O.E. Alvarenga , and A. Accardi , Structural basis of closed groove scrambling by a TMEM16 protein. Nat Struct Mol Biol, 2024. · DOI
  47. 2013, Ca2+-dependent phospholipid scrambling by a reconstituted TMEM16 ion channel, Nature Communications, 4, 2367, 10.1038/ncomms3367 · DOI
  48. 10.1038/sj.cdd.4400497 · DOI
  49. 10.1016/j.bpj.2016.09.032 · DOI
  50. 10.7554/eLife.44365 · DOI
  51. 10.1038/nature13984 · DOI
  52. 10.1038/s41586-022-04814-x · DOI
  53. 2017, cryoSPARC: algorithms for rapid unsupervised cryo-EM structure determination, Nature Methods, 14, 290, 10.1038/nmeth.4169 · DOI · Paper page
  54. 2019, The structural basis of lipid scrambling and inactivation in the endoplasmic reticulum scramblase TMEM16K, Nature Communications, 10, 3956, 10.1038/s41467-019-11753-1 · DOI
  55. 10.1038/s41467-018-05724-1 · DOI
  56. 10.1073/pnas.1607574113 · DOI
  57. Jiang, T. , et al., Lipids and ions traverse the membrane by the same physical pathway in the nhTMEM16 scramblase. Elife, 2017. 6. · DOI
  58. 2021, Molecular mechanisms of ion conduction and ion selectivity in TMEM16 lipid scramblases, Nature Communications, 12, 2826, 10.1038/s41467-021-22724-w · DOI
  59. 10.1038/s41467-022-34497-x · DOI
  60. 2019, Stepwise activation mechanism of the scramblase nhTMEM16 revealed by cryo-EM, eLife, 8, e44364, 10.7554/eLife.44364 · DOI
  61. 2019, Cryo-EM Studies of TMEM16F Calcium-Activated Ion Channel Suggest Features Important for Lipid Scrambling, Cell Reports, 28, 567, 10.1016/j.celrep.2019.06.023 · DOI
  62. Jarvis, D.L. , Chapter 14 Baculovirus–Insect Cell Expression Systems, in Methods in Enzymology, R.R. Burgess and M.P. Deutscher , Editors. 2009, Academic Press. p. 191–222. · DOI
  63. 10.1038/nbt1036 · DOI
  64. 2022, Deconvolving Native and Intact Protein Mass Spectra with UniDec, Methods Mol Biol, 2500, 159, 10.1007/978-1-0716-2325-1_12 · DOI
  65. 10.1016/j.jsb.2015.08.008 · DOI
  66. 2019, Real-time cryo-electron microscopy data preprocessing with Warp, Nat Methods, 16, 1146, 10.1038/s41592-019-0580-y · DOI
  67. 10.1016/j.jsb.2009.01.002 · DOI
  68. 10.1016/j.jsb.2005.03.010 · DOI
  69. 2017, Phenix tool to compute a difference map for cryo-EM, Computational Crystallography Newsletter, 8, 8
  70. 2013, PHENIX News, Computational Crystallography Newsletter, 4, 43
  71. 10.1107/S2059798319011471/HTTPS://GOLDBOOK.IUPAC.ORG/E02002.HTML · DOI
  72. 2022, ColabFold: making protein folding accessible to all, Nature Methods, 19, 679, 10.1038/s41592-022-01488-1 · DOI · Paper page
  73. Webb, B. and A. Sali , Comparative Protein Structure Modeling Using MODELLER. Curr Protoc Bioinformatics, 2016. 54: p. 5.6.1–5.6.37. · DOI
  74. 10.1016/0263-7855(96)00018-5 · DOI · Paper page
  75. 10.1002/jcc.23702 · DOI
  76. 10.1021/ct300400x · DOI
  77. 10.1063/1.445869 · DOI
  78. 2020, The Ca2+ permeation mechanism of the ryanodine receptor revealed by a multi-site ion model, Nature Communications, 11, 922, 10.1038/s41467-020-14573-w · DOI
  79. 2015, GROMACS: High performance molecular simulations through multi-level parallelism from laptops to supercomputers, SoftwareX, 1–2, 19
  80. 10.1038/s41594-023-01210-5 · DOI
  81. 2023, MOSAICS: A software suite for analysis of membrane structure and dynamics in simulated trajectories, Biophysical Journal, 122, 2023, 10.1016/j.bpj.2022.11.005 · DOI

Metadata

Authors
Chakraborty, S., Feng, Z., Lee, S., Alvarenga, O. E., Panda, A., Bruni, R., Khelashvili, G., Gupta, K., & Accardi, A.
Affiliations
  • Weill Cornell Medicine (US)
  • Yale University (US)
  • New York Structural Biology Center (US)
Corresponding author
Accardi, Alessio
Venue
Nature Communications
Publisher
openRxiv
Published
2024-08-09
Volume
16
Issue
1
Pages
7317-7317
ISSN
2041-1723 (ISSN-L)
OpenAlex
W4413054266
Cited by
5
References
1
Citations by year
2026: 3 · 2025: 1 · 2024: 1
FWCI
1.20
Type
journal article
Language
en
Open access
Locations
  • Nature Communications (publishedVersion, cc-by-nc-nd)
  • bioRxiv (Cold Spring Harbor Laboratory) (acceptedVersion, cc-by-nc-nd)
  • PubMed Central (publishedVersion, cc-by-nc-nd)
  • PubMed (publishedVersion)
  • PubMed Central (submittedVersion, cc-by-nc-nd)
  • DOAJ (DOAJ: Directory of Open Access Journals) (submittedVersion, cc-by-sa)
Funders
  • National Science Foundation (DEAC05- 00OR22725, 1746886)
  • U.S. Department of Energy (AC05-00OR22725, DE--AC05--00OR22725, DE-AC05?, 00OR22725)
  • U.S. Department of Health and Human Services (R01GM141192)
  • Division of Intramural Research, National Institute of Allergy and Infectious Diseases (R01AI178180)
  • National Institutes of Health (DE-AC05-00OR22725, GM 103310)
  • Directorate for Biological Sciences (1746886)
  • Office of Science (DEAC05- 00OR22725, AC05-00OR22725)
  • Weill Cornell Medical College
  • National Institute of General Medical Sciences (P41GM103310, SCR_019202, P41GM116799, DE-AC05-00OR22725, GM103310, T32GM132081, R01GM141192)
  • National Institute of Allergy and Infectious Diseases (R01AI178180)
Topics
  • Life Sciences › Biochemistry, Genetics and Molecular Biology › Molecular Biology › Lipid Membrane Structure and Behavior
  • Life Sciences › Immunology and Microbiology › Immunology › Phagocytosis and Immune Regulation
  • Life Sciences › Biochemistry, Genetics and Molecular Biology › Molecular Biology › Cell death mechanisms and regulation
Keywords
phosphatidylserine exposure, membrane thinning, protein conformation, caspase cleavage, inflammation, cryo-electron microscopy, molecular dynamics simulation

About these checks

Registry, retraction, Cites and statistics results are computed, not judged, with one exception: a printed reference that no index lists is read once by a model before it counts as a citation error. Claims are extracted by a model and kept only when their quote appears verbatim in the text; each cited source is then checked, with a model’s help, for whether it says what the claim relies on. Those verdicts can be wrong — read the claim’s quote and the cited source before relying on one.

Statistics and arithmetic are recomputed, not judged.

Confidence bands are shown only for fields calibrated on our annotated test set. None is calibrated yet, so no band is shown.

What counts as a claim ›How we measure confidence ›How we check this ›

Are you an author, or do you see a problem with this page? Request a review