

The DOI matches its Crossref record; 1 of the 1 references it cites were found in a registry or an index.
Do Protein Language Models Learn Phylogeny?
Open accessPreprint — published as 10.1093/bib/bbaf047 · Paper page
Abstract
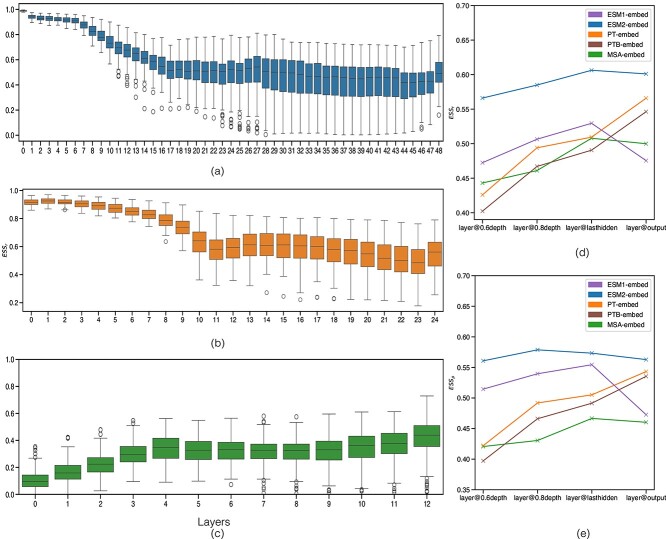
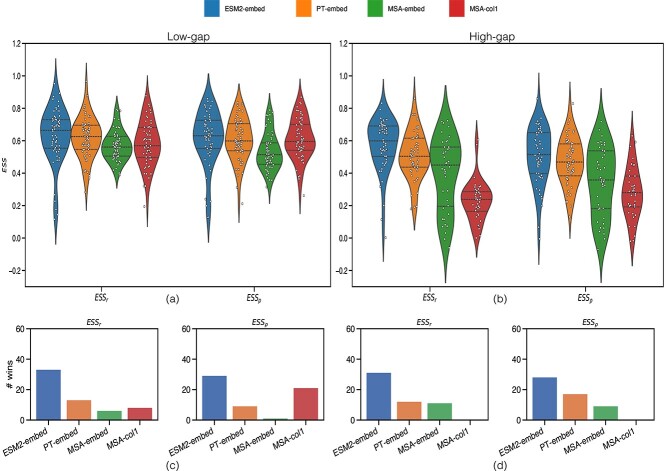
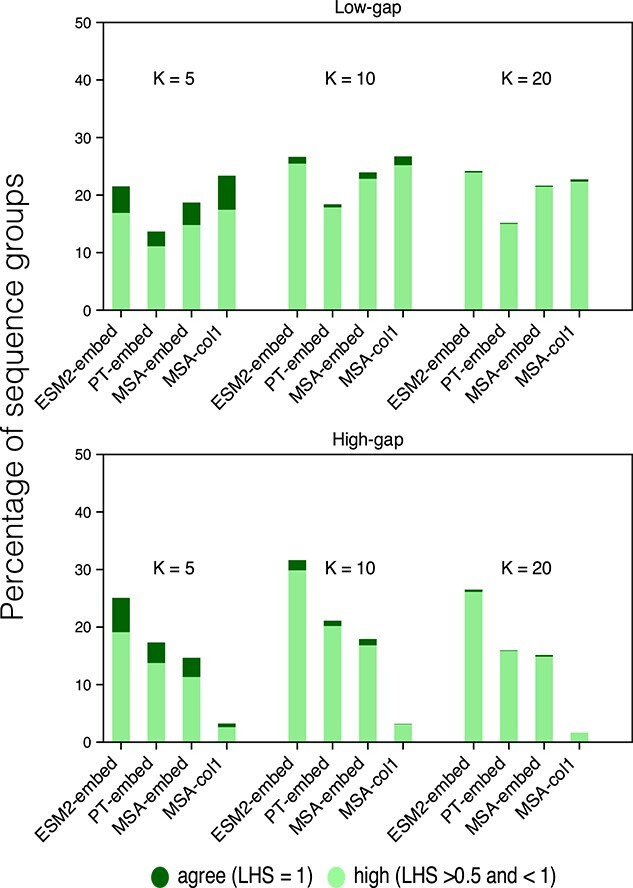
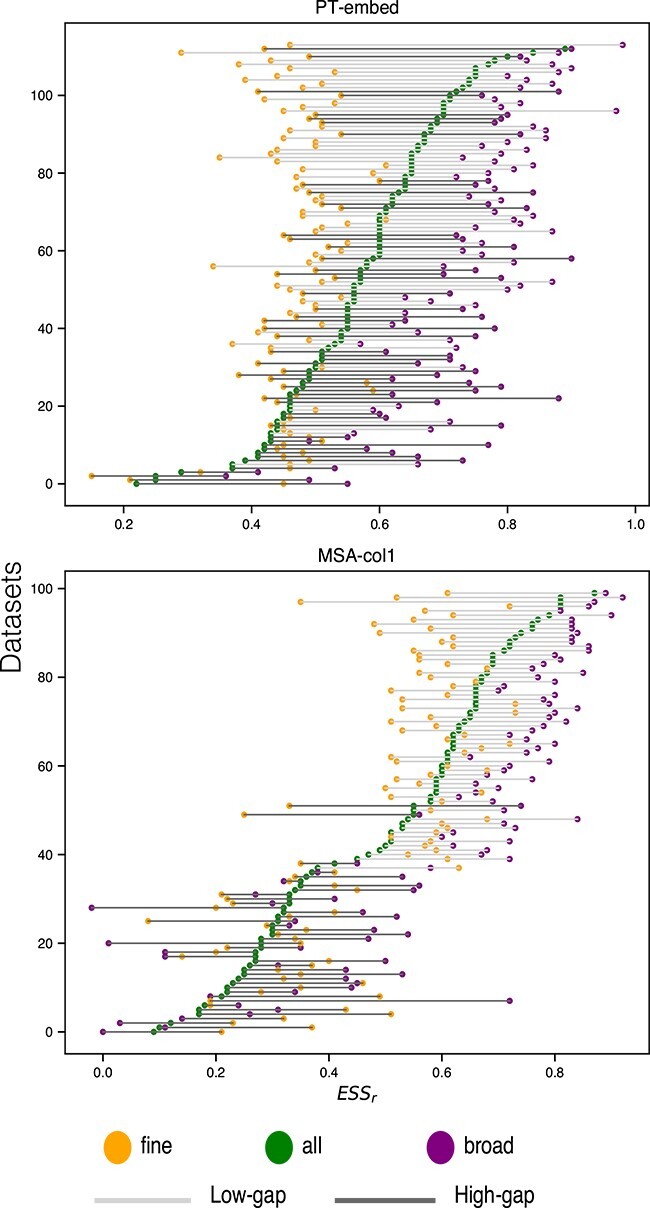
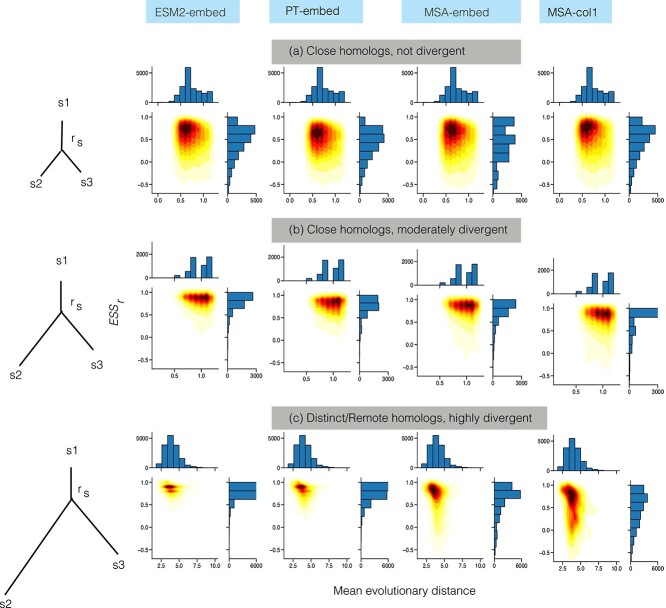
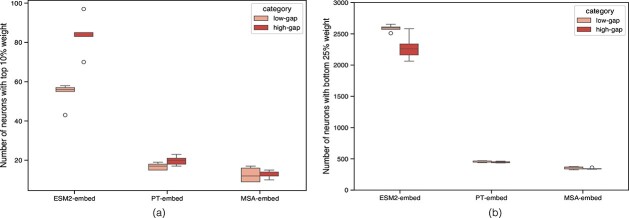
Deep machine learning demonstrates a capacity to uncover evolutionary relationships directly from protein sequences, in effect internalising notions inherent to classical phylogenetic tree inference. We connect these two paradigms by assessing the capacity of protein-based language models (pLMs) to discern phylogenetic relationships without being explicitly trained to do so. We evaluate ESM2, ProtTrans and MSA-Transformer relative to classical phylogenetic methods, while also considering sequence insertions and deletions (indels) across 114 Pfam datasets. The largest ESM2 model tends to outperform other pLMs (including the multimodal ESM3) by recovering phylogenetic relationships among homologous protein sequences in both low- and high-gap settings. pLMs agree with conventional phylogenetic methods in general, but more so for protein families with fewer implied indels, highlighting indels as a key factor differentiating classical phylogenetics from pLMs. We find that pLMs preferentially capture broader as opposed to finer evolutionary relationships within a specific protein family, where ESM2 has a sweet spot for highly divergent sequences, at remote distance. Less than 10% of neurons are sufficient to broadly recapitulate classical phylogenetic distances; when used in isolation the difference between the paradigms is further diminished. We show these neurons are polysemantic, shared among different homologous families but never fully overlapping. We highlight the potential of ESM2 as a complementary tool for phylogenetic analysis, especially when extending to remote homologs that are difficult to align and imply complex histories of insertions and deletions.
Overview
The claims and statistics of this paper haven’t been checked yet.
Run the check — free, no account needed. It reads the open-access text and checks the sources it cites.
Integrity signals
Registry
Cites
Statistics
Figures
Verification
Claims the paper makes
The claims and statistics of this paper haven’t been checked yet.
Run the check — free, no account needed. It reads the open-access text and checks the sources it cites.
Self-check
Percentages, sums and reported differences re-computed from the paper’s own numbers.
The self-check needs the paper’s full text.
Citations
Cites
Highly accurate protein structure prediction with AlphaFold
Jumper, J., Evans, R., Pritzel, A., Green, T., Figurnov, M., Ronneberger, O., Tunyasuvunakool, K., Bates, R., Žídek, A., Potapenko, A., et al. (2021) · Nature · doi:10.1038/s41586-021-03819-2 · Cited by 43,764
Research works printed but not linked: 33
- 10.1093/molbev/msaa015 · DOI · Paper page
- 10.1371/journal.pone.0013124 · DOI
- 10.1093/molbev/msn067 · DOI · Paper page
- 2015, Improving multiple sequence alignment by using better guide trees, BMC Bioinformatics, 16, S4
- 10.1371/journal.pone.0054583 · DOI · Paper page
- 10.1371/journal.pcbi.0020077 · DOI
- 10.1080/07388550802512633 · DOI
- 10.1093/bib/bbaa337 · DOI
- 10.1371/journal.pcbi.1010633 · DOI · Paper page
- 10.1073/pnas.2016239118 · DOI · Paper page
- 10.1093/bioinformatics/btad579 · DOI
- 10.1126/science.abd7331 · DOI · Paper page
- 2022, Evolutionary velocity with protein language models predicts evolutionary dynamics of diverse proteins, Cell Systems, 13, 274, 10.1016/j.cels.2022.01.003 · DOI
- 10.1186/s12859-024-05699-5 · DOI · Paper page
- 10.1093/bioinformatics/btad786 · DOI · Paper page
- J. Meier , R. Rao , R. Verkuil et al., “Language models enable zero-shot prediction of the effects of mutations on protein function,” bioRxiv, 2021. [Online]. Available: https://www.biorxiv.org/content/early/2021/11/17/2021.07.09.450648
- 2021, Cluster learning-assisted directed evolution, Nat Comput Sci, 1, 809, 10.1038/s43588-021-00168-y · DOI
- 2021, Informed training set design enables efficient machine learning-assisted directed protein evolution, Cell Syst, 12, 1026, 10.1016/j.cels.2021.07.008 · DOI
- 2022, Protein language models trained on multiple sequence alignments learn phylogenetic relationships, Nature Communications, 13, 6298, 10.1038/s41467-022-34032-y · DOI · Paper page
- 2021, Proceedings of the 38th International Conference on Machine Learning, ser. Proceedings of Machine Learning Research, 139, 8844
- 10.1126/science.ade2574 · DOI · Paper page
- 2022, Prottrans: Toward understanding the language of life through self-supervised learning, IEEE Transactions on Pattern Analysis and Machine Intelligence, 44, 7112, 10.1109/TPAMI.2021.3095381 · DOI · Paper page
- T. Hayes , R. Rao , H. Akin , N. J. Sofroniew et al., “Simulating 500 million years of evolution with a language model,” bioRxiv, 2024. [Online]. Available: https://www.biorxiv.org/content/early/2024/07/02/2024.07.01.600583
- M. Heinzinger , K. Weissenow , J. G. Sanchez , A. Henkel et al., “Prostt5: Bilingual language model for protein sequence and structure,” bioRxiv, 2023. [Online]. Available: https://www.biorxiv.org/content/early/2023/07/25/2023.07.23.550085
- 10.1093/nar/gkaa913 · DOI · Paper page
- N. Kriegeskorte , M. Mur , and P. Bandettini , “Representational similarity analysis - connecting the branches of systems neuroscience,” Frontiers in Systems Neuroscience, vol. 2, 2008. [Online]. Available: https://www.frontiersin.org/articles/10.3389/neuro.06.004.2008 · DOI · Paper page
- S. Abnar , L. Beinborn , R. Choenni , and W. H. Zuidema , “Blackbox meets blackbox: Representational similarity and stability analysis of neural language models and brains,” CoRR, vol. abs/1906.01539, 2019. [Online]. Available: http://arxiv.org/abs/1906.01539 · DOI
- 10.1093/molbev/msw046 · DOI
- L. Valeriani , F. Cuturello , A. Ansuini , and A. Cazzaniga , “The geometry of hidden representations of protein language models,” bioRxiv, 2022. [Online]. Available: https://www.biorxiv.org/content/early/2022/10/26/2022.10.24.513504
- 10.1007/BF02589501 · DOI
- F. Dalvi , N. Durrani , H. Sajjad , Y. Belinkov , A. Bau , and J. Glass , “What is one grain of sand in the desert? analyzing individual neurons in deep nlp models,” 2018. [Online]. Available: https://arxiv.org/abs/1812.09355 · arXiv
- N. Elhage , T. Hume , C. Olsson , N. Schiefer et al., “Toy models of superposition,” 2022. [Online]. Available: https://arxiv.org/abs/2209.10652 · arXiv
- 10.1002/prot.22458 · DOI
Metadata
- Authors
- Tule, S., Foley, G., & Bodén, M.
- Affiliations
- The University of Queensland (AU)
- Venue
- Briefings in Bioinformatics
- Publisher
- openRxiv
- Published
- 2024-09-25
- Volume
- 26
- Issue
- 1
- ISSN
- 1467-5463 (ISSN-L)
- PMC
- PMC11847157
- OpenAlex
- W4407867672
- Cited by
- 19
- References
- 1
- Citations by year
- 2026: 9 · 2025: 10
- FWCI
- 2.58
- Type
- journal article
- Language
- en
- Open access
- gold
- doi.org
- Licence
- Locations
- Briefings in Bioinformatics (publishedVersion, cc-by)
- bioRxiv (Cold Spring Harbor Laboratory) (acceptedVersion, cc-by)
- PubMed Central (publishedVersion, cc-by)
- PubMed (publishedVersion)
- Topics
- Life Sciences › Biochemistry, Genetics and Molecular Biology › Molecular Biology › Genomics and Phylogenetic Studies
- Life Sciences › Biochemistry, Genetics and Molecular Biology › Molecular Biology › Machine Learning in Bioinformatics
- Life Sciences › Biochemistry, Genetics and Molecular Biology › Molecular Biology › Protein Structure and Dynamics
- Keywords
- protein language models, phylogenetic inference, ESM-2, indels, phylogenetic distance, remote homologs, protein sequence evolution, Pfam protein families
- MeSH terms
- Machine Learning, Deep Learning, Humans, Phylogeny, Proteins, Evolution, Molecular, INDEL Mutation
About these checks
Registry, retraction, Cites and statistics results are computed, not judged, with one exception: a printed reference that no index lists is read once by a model before it counts as a citation error. Claims are extracted by a model and kept only when their quote appears verbatim in the text; each cited source is then checked, with a model’s help, for whether it says what the claim relies on. Those verdicts can be wrong — read the claim’s quote and the cited source before relying on one.
Statistics and arithmetic are recomputed, not judged.
Confidence bands are shown only for fields calibrated on our annotated test set. None is calibrated yet, so no band is shown.
What counts as a claim ›How we measure confidence ›How we check this ›
Are you an author, or do you see a problem with this page? Request a review
