Student or educator? Sign up with your school email and get 6 months of Pro free.
PreprintCited by 8Cellular transport and secretionProtein Structure and DynamicsReceptor Mechanisms and Signaling

The DOI matches its Crossref record; 1 of the 1 references it cites were found in a registry or an index.

Promiscuous and multivalent interactions between Eps15 and partner protein Dab2 generate a complex interaction network

Open access

Preprint — published as 10.1038/s41467-025-63090-1 · Paper page

Abstract

Clathrin-mediated endocytosis depends on complex protein interactions. Eps15 plays a key role through interactions of its three EH domains with Asn-Pro-Phe (NPF) motifs in intrinsically disordered regions (IDRs) of other endocytic proteins. Using nuclear magnetic resonance spectroscopy, we investigate the interaction between Eps15’s EH domains and a highly disordered Dab2 fragment (Dab2₃₂₀₋₄₉₅). We find that the EH domains exhibit binding promiscuity, recognizing not only the NPF motif of Dab2 but also other phenylalanine containing motifs. This promiscuity enables interactions with Eps15’s own IDR (Eps15 IDR ), which lacks NPF motifs, suggesting an self-inhibitory state that promotes liquid-liquid phase separation. Despite competing for the same EH domain binding sites, Eps15 IDR and Dab2₃₂₀₋₄₉₅ can bind EH123 simultaneously, forming a highly dynamic interaction network that facilitates the recruitment of Dab2₃₂₀₋₄₉₅ into Eps15 condensates. Our findings provide molecular insights into the competitive interactions shaping the early stages of clathrin-mediated endocytosis.

Overview

The claims and statistics of this paper haven’t been checked yet.

Run the check — free, no account needed. It reads the open-access text and checks the sources it cites.

A few free checks a day · papers already verified open instantly · results are public

Integrity signals

Registry

Crossref · 10.1101/2024.09.30.615448

Cites

1 of 1 references verified0 citation errors · 0 not checkable

Statistics

Figures

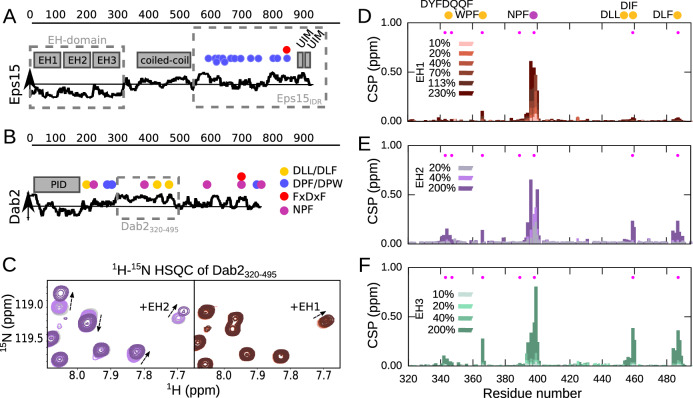
Fig. 1 Interaction between Dab2320–495 and the individual EH domains of Eps15. Schematic illustration of (A) Eps15 and (B) Dab2. The disorder prediction (IUPred2A23) is shown as a black curve along the sequence. Above horizontal line: predicted disordered, Below horizontal line: predicted ordered. The folded domains are shown as gray boxes above the disorder prediction. Putative interaction motifs are shown as colored circles along the sequence (legend on the right of Dab2). DLL/DLF: clathrin binding; DPF/DPW: AP2α binding; FxDxF: AP2β binding; NPF: EH domain binding. The stretches used in this study are boxed with gray dashed lines. C Zoom into a 1H−15N HSQC spectrum of Dab2320–495 in the absence and presence of EH2 (left) and EH1 (right). D–F CSPs of 100 μM Dab2320–495 in the presence versus the absence of increasing concentrations of EH1 (D), EH2 (E) and EH3 (F), respectively. Color legends are displayed in the respective plots. Filled pink circles denote positions of phenylalanines.
Fig. 1 Interaction between Dab2320–495 and the individual EH domains of Eps15. Schematic illustration of (A) Eps15 and (B) Dab2. The disorder prediction (IUPred2A23) is shown as a black curve along the sequence. Above horizontal line: predicted disordered, Below horizontal line: predicted ordered. The folded domains are shown as gray boxes above the disorder prediction. Putative interaction motifs are shown as colored circles along the sequence (legend on the right of Dab2). DLL/DLF: clathrin binding; DPF/DPW: AP2α binding; FxDxF: AP2β binding; NPF: EH domain binding. The stretches used in this study are boxed with gray dashed lines. C Zoom into a 1H−15N HSQC spectrum of Dab2320–495 in the absence and presence of EH2 (left) and EH1 (right). D–F CSPs of 100 μM Dab2320–495 in the presence versus the absence of increasing concentrations of EH1 (D), EH2 (E) and EH3 (F), respectively. Color legends are displayed in the respective plots. Filled pink circles denote positions of phenylalanines.CC BY · PubMed Central
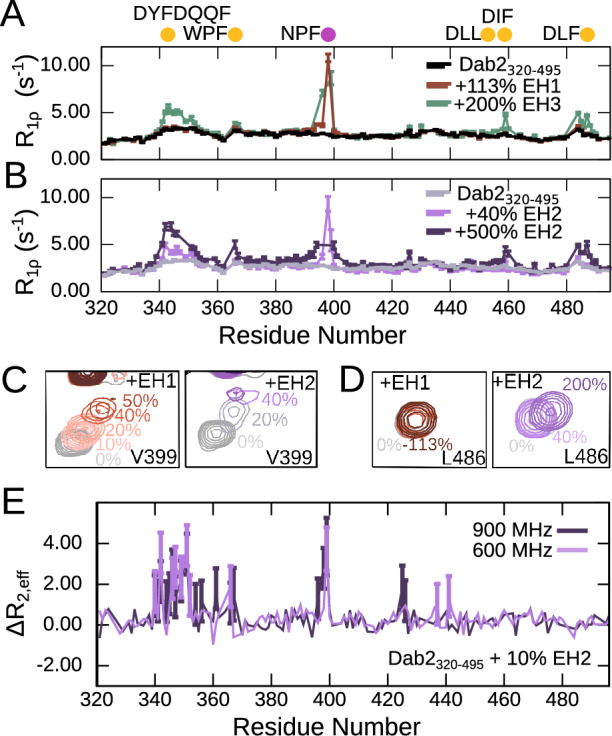
Fig. 2 15N spin relaxation of Dab2320–495 upon interaction with the EH domains. 15N R1ρ spin relaxation of Dab2320–495 (100 µM) in the absence and presence of (A) EH1 or EH3 and (B) increasing concentrations of EH2. The experiments were recorded at a 1H frequency of 600 MHz. The relaxation rates in (A) and (B) were derived from a fit of peak intensities against the relaxation delay. Errors of the fitted rates were derived from the experimental uncertainty. C Zoom into the peak corresponding to V399 from Dab2320–495 1H-15N HSQC spectra alone and in the presence of increasing concentrations of EH1 (left) and EH2 (right). D Zoom into the peak corresponding to L486 from Dab2320–495 1H-15N HSQC spectra alone and in the presence of increasing concentrations of EH1 (left) and EH2 (right). Color legends are displayed in the respective panels. E ΔR2, eff calculated from effective R2 values (R2, eff) of relaxation dispersion experiments at a CPMG frequency of 31 Hz subtracted with R2, eff at a CPMG frequency of 1000 Hz recorded on a sample of 100 µM Dab2320–495 in the presence of 10% EH2 at a 1H frequency of 600 MHz and 900 MHz. Error bars, propagated from the errors of R2, eff at 31 Hz and 1000 Hz determined from repeat measurements and with a minimum error of 0.5 (see Supplementary Fig. 7B for the corresponding decay curves), are shown for values that are significantly larger than 0 .
Fig. 2 15N spin relaxation of Dab2320–495 upon interaction with the EH domains. 15N R1ρ spin relaxation of Dab2320–495 (100 µM) in the absence and presence of (A) EH1 or EH3 and (B) increasing concentrations of EH2. The experiments were recorded at a 1H frequency of 600 MHz. The relaxation rates in (A) and (B) were derived from a fit of peak intensities against the relaxation delay. Errors of the fitted rates were derived from the experimental uncertainty. C Zoom into the peak corresponding to V399 from Dab2320–495 1H-15N HSQC spectra alone and in the presence of increasing concentrations of EH1 (left) and EH2 (right). D Zoom into the peak corresponding to L486 from Dab2320–495 1H-15N HSQC spectra alone and in the presence of increasing concentrations of EH1 (left) and EH2 (right). Color legends are displayed in the respective panels. E ΔR2, eff calculated from effective R2 values (R2, eff) of relaxation dispersion experiments at a CPMG frequency of 31 Hz subtracted with R2, eff at a CPMG frequency of 1000 Hz recorded on a sample of 100 µM Dab2320–495 in the presence of 10% EH2 at a 1H frequency of 600 MHz and 900 MHz. Error bars, propagated from the errors of R2, eff at 31 Hz and 1000 Hz determined from repeat measurements and with a minimum error of 0.5 (see Supplementary Fig. 7B for the corresponding decay curves), are shown for values that are significantly larger than 0 .CC BY · PubMed Central
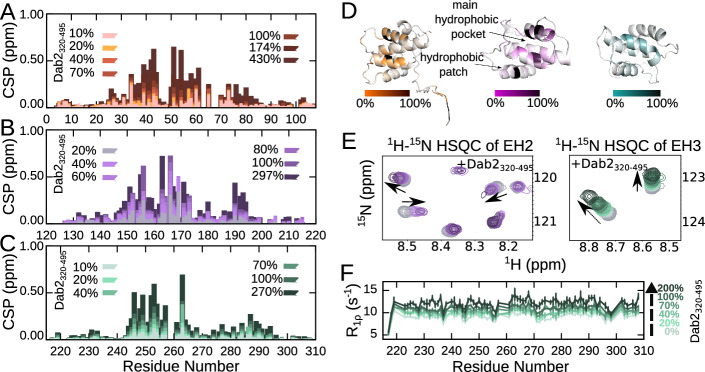
Fig. 3 Interaction between the individual EH domains of Eps15 and Dab2320–495. A–C CSPs of 100 μM EH1 (A), EH2 (B) and EH3 (C), respectively, in the absence versus the presence of increasing amounts of Dab2320–495. Color legends are displayed in the respective plots. D Structures of EH1 (AlphaFold234), EH2 (PDB 1FF131) and EH3 (PDB 1C0732) with the CSP at 100% Dab2320–495 mapped onto them. The linear gradient starts from 0% (white), which represents no CSP, to the 100% (black), which is 0.75 ppm (the biggest CSP observed between EH2 and Dab2320–495). E Zoom into a 1H-15N TROSY-HSQC spectrum of EH2 (left) and EH3 (right) alone and in the presence of Dab2320–495. F 15N R1ρ spin relaxation of EH3 (100 µM) in the absence and presence of Dab2320–495 at a 1H frequency of 600 MHz. Color legends are indicated in the figures. The relaxation rates were derived from a fit of peak intensities against the relaxation delay. Errors of the fitted rates were derived from the experimental uncertainty.
Fig. 3 Interaction between the individual EH domains of Eps15 and Dab2320–495. A–C CSPs of 100 μM EH1 (A), EH2 (B) and EH3 (C), respectively, in the absence versus the presence of increasing amounts of Dab2320–495. Color legends are displayed in the respective plots. D Structures of EH1 (AlphaFold234), EH2 (PDB 1FF131) and EH3 (PDB 1C0732) with the CSP at 100% Dab2320–495 mapped onto them. The linear gradient starts from 0% (white), which represents no CSP, to the 100% (black), which is 0.75 ppm (the biggest CSP observed between EH2 and Dab2320–495). E Zoom into a 1H-15N TROSY-HSQC spectrum of EH2 (left) and EH3 (right) alone and in the presence of Dab2320–495. F 15N R1ρ spin relaxation of EH3 (100 µM) in the absence and presence of Dab2320–495 at a 1H frequency of 600 MHz. Color legends are indicated in the figures. The relaxation rates were derived from a fit of peak intensities against the relaxation delay. Errors of the fitted rates were derived from the experimental uncertainty.CC BY · PubMed Central
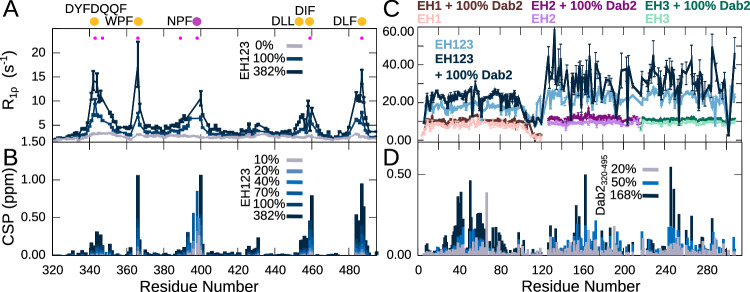
Fig. 4 Interaction between EH123 and Dab2320–495. A 15N R1ρ spin relaxation of Dab2320–495 (100 µM) in the absence and presence of increasing concentrations of EH123 at a 1H frequency of 600 MHz. B CSPs between the 1H-15N HSQC of 15N Dab2320–495 in the absence and presence of increasing amounts of EH123. The filled pink dots represent the phenylalanines present in the Dab2320–495. C 15N R1ρ spin relaxation of the individual 15N EH domains (EH1, EH2, EH3) as well as EH123 in the absence and presence of 100% Dab2320–495 at a 1H frequency of 600 MHz. D CSPs between the 1H-15N TROSY-HSQC of 15N EH123 in the absence and presence of increasing amounts of the Dab2320–495. The color legends are indicated in the respective figure panels. The relaxation rates in (A) and (C) were derived from a fit of peak intensities against the relaxation delay. Errors of the fitted rates were derived from the experimental uncertainty.
Fig. 4 Interaction between EH123 and Dab2320–495. A 15N R1ρ spin relaxation of Dab2320–495 (100 µM) in the absence and presence of increasing concentrations of EH123 at a 1H frequency of 600 MHz. B CSPs between the 1H-15N HSQC of 15N Dab2320–495 in the absence and presence of increasing amounts of EH123. The filled pink dots represent the phenylalanines present in the Dab2320–495. C 15N R1ρ spin relaxation of the individual 15N EH domains (EH1, EH2, EH3) as well as EH123 in the absence and presence of 100% Dab2320–495 at a 1H frequency of 600 MHz. D CSPs between the 1H-15N TROSY-HSQC of 15N EH123 in the absence and presence of increasing amounts of the Dab2320–495. The color legends are indicated in the respective figure panels. The relaxation rates in (A) and (C) were derived from a fit of peak intensities against the relaxation delay. Errors of the fitted rates were derived from the experimental uncertainty.CC BY · PubMed Central
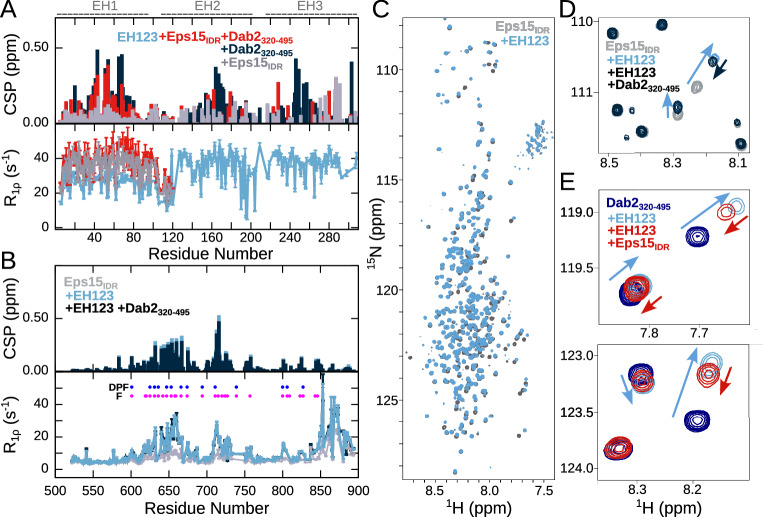
Fig. 5 Competitive binding of Dab2320–495 and Eps15IDR to EH123. A CSPs calculated between the 1H–15N TROSY-HSQC of 200 µM 15N EH123 in the absence and presence of 200 µM Dab2320–495 and/or 200 µM Eps15IDR. Below are 15N R1ρ spin relaxation rates of 15N EH123 in the absence and presence of 100% Eps15IDR and both 100% Dab2320–495 and Eps15IDR at a 1H frequency of 1200 MHz. Only the R1ρ rates within EH1 in the presence of Eps15IDR and Eps15IDR with Dab2320–495 are shown as the peaks of EH2 and EH3 were severely broadened. The parts of EH123 corresponding to EH1, EH2, and EH3 are illustrated above the plots. B CSPs calculated between the 1H-15N HSQC of 100 µM 15N Eps15IDR in the absence and presence of 100 µM EH123 and 100 µM EH123 + 100 µM Dab2320–495, and 15N R1ρ spin relaxation of 15N Eps15IDR in the absence and presence of 100% EH123 and 100% EH123 + 100% Dab2320–495 at a 1H frequency of 1200 MHz. C 1H–15N HSQC spectra of 100 µM 15N Eps15IDR alone and in the presence of 100 µM EH123. D Zoom into 1H-15N HSQC spectrum of 100 µM 15N Eps15IDR alone and in the presence of 100 µM EH123 and 100 µM EH123 + 100 µM Dab2320–495. E Zoom into 1H-15N HSQC spectrum of 100 µM 15N Dab2320–495 alone and in the presence of 100 µM EH123 and 100 µM EH123 + 100 µM Eps15IDR. Color codes are denoted in the respective panels. The relaxation rates in (A) and (B) (lower panels) were derived from a fit of peak intensities against the relaxation delay. Errors of the fitted rates were derived from the experimental uncertainty.
Fig. 5 Competitive binding of Dab2320–495 and Eps15IDR to EH123. A CSPs calculated between the 1H–15N TROSY-HSQC of 200 µM 15N EH123 in the absence and presence of 200 µM Dab2320–495 and/or 200 µM Eps15IDR. Below are 15N R1ρ spin relaxation rates of 15N EH123 in the absence and presence of 100% Eps15IDR and both 100% Dab2320–495 and Eps15IDR at a 1H frequency of 1200 MHz. Only the R1ρ rates within EH1 in the presence of Eps15IDR and Eps15IDR with Dab2320–495 are shown as the peaks of EH2 and EH3 were severely broadened. The parts of EH123 corresponding to EH1, EH2, and EH3 are illustrated above the plots. B CSPs calculated between the 1H-15N HSQC of 100 µM 15N Eps15IDR in the absence and presence of 100 µM EH123 and 100 µM EH123 + 100 µM Dab2320–495, and 15N R1ρ spin relaxation of 15N Eps15IDR in the absence and presence of 100% EH123 and 100% EH123 + 100% Dab2320–495 at a 1H frequency of 1200 MHz. C 1H–15N HSQC spectra of 100 µM 15N Eps15IDR alone and in the presence of 100 µM EH123. D Zoom into 1H-15N HSQC spectrum of 100 µM 15N Eps15IDR alone and in the presence of 100 µM EH123 and 100 µM EH123 + 100 µM Dab2320–495. E Zoom into 1H-15N HSQC spectrum of 100 µM 15N Dab2320–495 alone and in the presence of 100 µM EH123 and 100 µM EH123 + 100 µM Eps15IDR. Color codes are denoted in the respective panels. The relaxation rates in (A) and (B) (lower panels) were derived from a fit of peak intensities against the relaxation delay. Errors of the fitted rates were derived from the experimental uncertainty.CC BY · PubMed Central
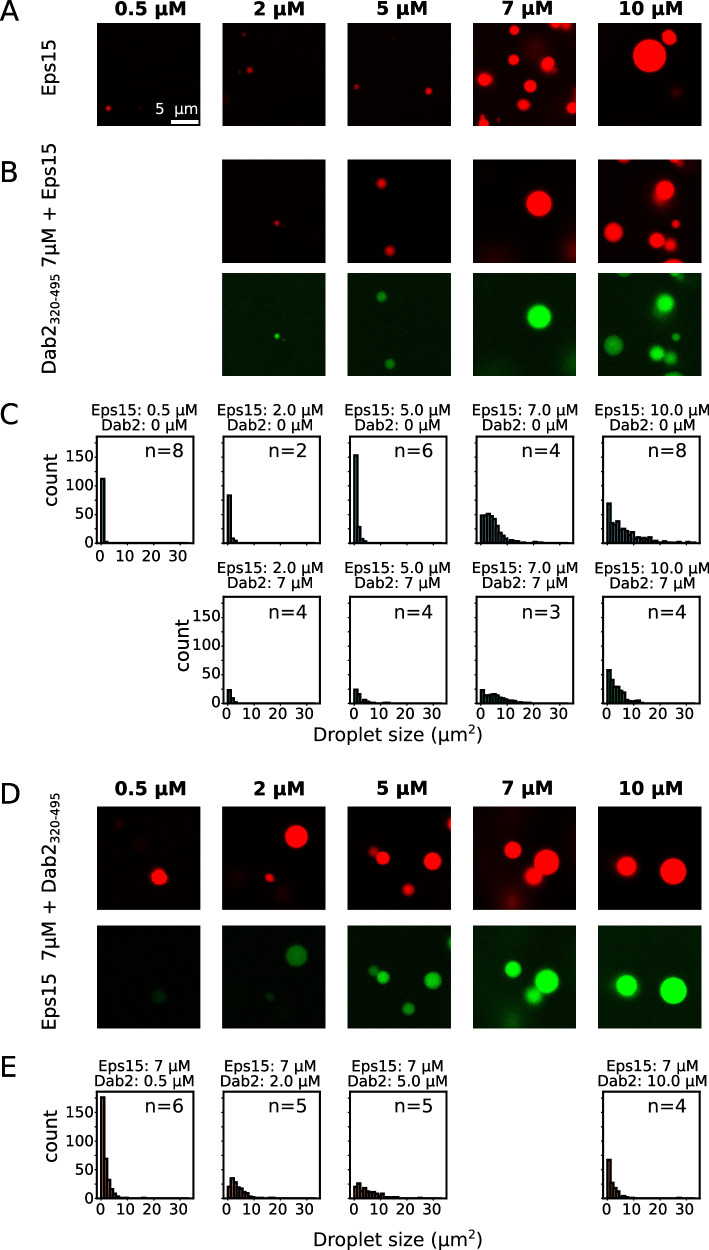
Fig. 6 Dab2320–495 is recruited into Eps15 droplets. A Representative droplets imaged from Eps15 alone at different concentrations (0.5 to 10 μM, indicated above). B Eps15 droplets formed under the same conditions in the presence of 7 μM Dab2320–495. C Droplet sizes plotted in a histogram for different concentrations of Eps15 in the presence and absence of 7 μM Dab2320–495, corresponding to the microscopy images in (A) and (B). D Eps15 droplets formed with 7 μM protein, to which different concentrations of Dab2320–495 (0.5 to 10 μM, indicated above) was added. E Droplet sizes plotted in a histogram for different concentrations of Dab2320–495 in the presence and absence of 7 μM Eps15, corresponding to the microscopy images in (D). 10% of the protein used in the microscopy experiments was fluorescently labeled. Eps15 was labeled using AZDye594 (displayed in red). Dab2320–495 S328C was labeled using AZDye488 (displayed in green). The scale bar is 5 μm and applies to all images in the figure. Images were acquired by confocal microscopy. The number of images used for the histograms is indicated as ‘n = x’ in each plot. Source data are the same as for Supplementary Fig. 22A and B and are provided as a Source Data file.
Fig. 6 Dab2320–495 is recruited into Eps15 droplets. A Representative droplets imaged from Eps15 alone at different concentrations (0.5 to 10 μM, indicated above). B Eps15 droplets formed under the same conditions in the presence of 7 μM Dab2320–495. C Droplet sizes plotted in a histogram for different concentrations of Eps15 in the presence and absence of 7 μM Dab2320–495, corresponding to the microscopy images in (A) and (B). D Eps15 droplets formed with 7 μM protein, to which different concentrations of Dab2320–495 (0.5 to 10 μM, indicated above) was added. E Droplet sizes plotted in a histogram for different concentrations of Dab2320–495 in the presence and absence of 7 μM Eps15, corresponding to the microscopy images in (D). 10% of the protein used in the microscopy experiments was fluorescently labeled. Eps15 was labeled using AZDye594 (displayed in red). Dab2320–495 S328C was labeled using AZDye488 (displayed in green). The scale bar is 5 μm and applies to all images in the figure. Images were acquired by confocal microscopy. The number of images used for the histograms is indicated as ‘n = x’ in each plot. Source data are the same as for Supplementary Fig. 22A and B and are provided as a Source Data file.CC BY · PubMed Central
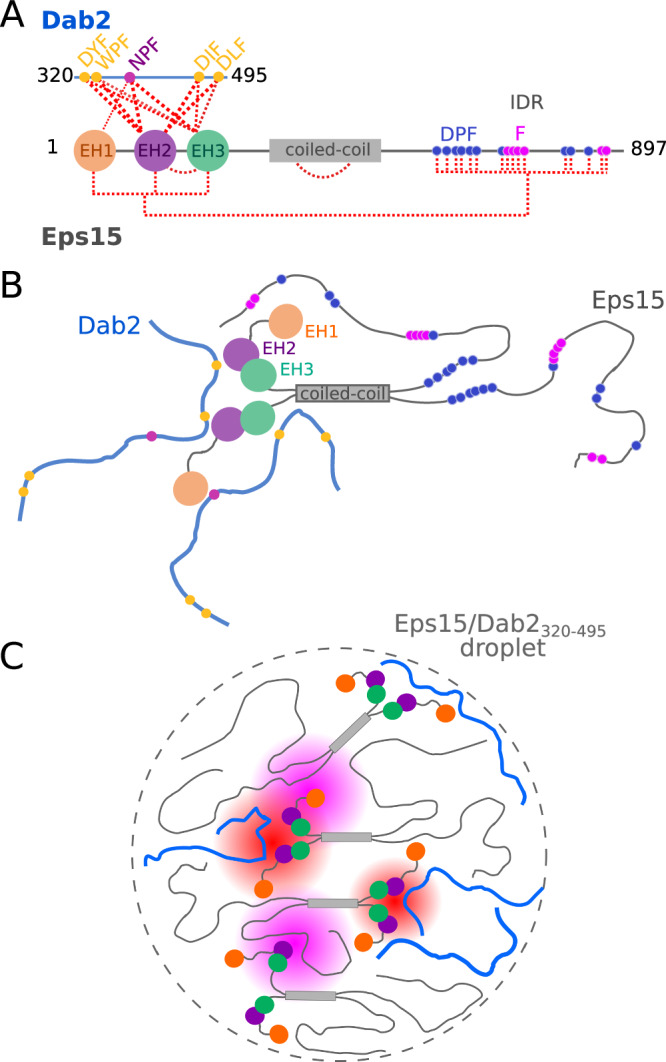
Fig. 7 Schematic of Eps15 and Dab2320–495 interactions and phase separation. A illustration of the complex interaction network between Eps15 and Dab2320–495, including intra-molecular interactions within Eps15. Interactions are visualized with red dashed lines. B Cartoon of self-interactions within Eps15 and of interactions between Eps15 and Dab2320–495. Eps15’s EH domains interact with Eps15IDR and with Dab2320–495. EH2 and EH3 tumble together. All three EH domains interact with the NPF motif within Dab2320–495, while EH2 and EH3 are promiscuous binders. C The weak multivalent interaction network of the two IDRs with EH123 likely contributes to co-phase separation of Eps15 and Dab2320–495. Eps15:Dab2 interactions are highlighted in red shading, and Eps15:Eps15 interactions are highlighted in pink shading.
Fig. 7 Schematic of Eps15 and Dab2320–495 interactions and phase separation. A illustration of the complex interaction network between Eps15 and Dab2320–495, including intra-molecular interactions within Eps15. Interactions are visualized with red dashed lines. B Cartoon of self-interactions within Eps15 and of interactions between Eps15 and Dab2320–495. Eps15’s EH domains interact with Eps15IDR and with Dab2320–495. EH2 and EH3 tumble together. All three EH domains interact with the NPF motif within Dab2320–495, while EH2 and EH3 are promiscuous binders. C The weak multivalent interaction network of the two IDRs with EH123 likely contributes to co-phase separation of Eps15 and Dab2320–495. Eps15:Dab2 interactions are highlighted in red shading, and Eps15:Eps15 interactions are highlighted in pink shading.CC BY · PubMed Central

Verification

Claims the paper makes

The claims and statistics of this paper haven’t been checked yet.

Run the check — free, no account needed. It reads the open-access text and checks the sources it cites.

A few free checks a day · papers already verified open instantly · results are public

Self-check

Percentages, sums and reported differences re-computed from the paper’s own numbers.

The self-check needs the paper’s full text.

Citations

Cites

Show all 1 references

Research works printed but not linked: 61

  1. 10.1038/nrm.2017.132 · DOI · Paper page
  2. 10.1016/j.tcb.2006.08.001 · DOI
  3. 10.1016/S0969-2126(02)00784-0 · DOI
  4. 10.1021/cr400585q · DOI · Paper page
  5. 10.1371/journal.pbio.0040262 · DOI
  6. 10.1038/sj.emboj.7600445 · DOI · Paper page
  7. 10.1038/s41467-024-50212-4 · DOI
  8. 10.1016/j.jmb.2010.09.044 · DOI
  9. 10.1021/acs.biochem.5b00065 · DOI
  10. 10.1126/science.1188462 · DOI · Paper page
  11. 10.1016/S0014-5793(01)03241-0 · DOI
  12. 10.1074/jbc.272.24.15413 · DOI
  13. 10.1074/jbc.272.52.33430 · DOI
  14. 10.1186/1478-811X-7-24 · DOI
  15. 10.1038/emboj.2009.248 · DOI
  16. 10.1038/s41556-021-00646-5 · DOI
  17. 10.1101/gad.11.17.2239 · DOI · Paper page
  18. 10.1038/sj.emboj.7601980 · DOI
  19. 10.1091/mbc.E11-12-1007 · DOI
  20. 10.1002/bies.201670907 · DOI
  21. Smith, S. M. , Baker, M. , Halebian, M. & Smith, C. J . Weak Molecular Interactions in Clathrin-Mediated Endocytosis. Frontiers in Molecular Biosciences 4, (2017). · DOI
  22. 10.1016/S0962-8924(01)02082-7 · DOI · Paper page
  23. 10.1002/cpbi.99 · DOI · Paper page
  24. 10.1093/bioinformatics/bts172 · DOI
  25. 10.1021/ja909973n · DOI
  26. 10.1007/s12104-008-9083-y · DOI
  27. 10.1023/A:1008394326526 · DOI
  28. 10.1023/A:1008382305918 · DOI
  29. 10.1110/ps.062465306 · DOI
  30. 10.1021/bi990922i · DOI
  31. 10.1038/80924 · DOI
  32. 10.1021/bi9927383 · DOI
  33. 10.1021/ja809687r · DOI
  34. 10.1074/jbc.M203004200 · DOI
  35. 10.1016/S0968-0004(01)01835-7 · DOI · Paper page
  36. 10.1021/jacs.6b02424 · DOI
  37. 10.1016/j.sbi.2017.12.007 · DOI
  38. 10.1038/s41598-022-09259-w · DOI · Paper page
  39. 10.1093/emboj/17.22.6541 · DOI
  40. 10.1002/pro.258 · DOI
  41. 10.1186/1471-2091-8-29 · DOI
  42. 10.1038/nature06173 · DOI · Paper page
  43. 10.1038/s41467-024-48004-x · DOI
  44. 10.1093/pnasnexus/pgae342 · DOI
  45. 10.1126/science.aaw8653 · DOI · Paper page
  46. 10.1371/journal.pbio.1000604 · DOI · Paper page
  47. 10.1385/1-59259-890-0:571 · DOI
  48. 10.1007/BF00197809 · DOI · Paper page
  49. 10.1002/anie.201100370 · DOI
  50. 10.1007/s10858-016-0060-y · DOI · Paper page
  51. 10.1007/s10858-013-9715-0 · DOI
  52. 10.1023/B:JNMR.0000042954.99056.ad · DOI · Paper page
  53. 10.1023/A:1022836027055 · DOI · Paper page
  54. 10.1007/s10858-012-9626-5 · DOI
  55. 10.1021/jp074793o · DOI
  56. 10.1007/s10858-007-9166-6 · DOI · Paper page
  57. 10.1038/S41592-022-01488-1 · DOI · Paper page
  58. 10.1126/sciadv.aaz7095 · DOI
  59. 10.1007/978-1-61779-151-2_1 · DOI
  60. 10.1038/nmeth.2019 · DOI · Paper page
  61. 10.1073/pnas.1419528112 · DOI

Metadata

Authors
Papagiannoula, A., Vedel, I. M., Motzny, K., Tengo, M., Saiti, A., & Milles, S.
Affiliations
  • Leibniz-Forschungsinstitut für Molekulare Pharmakologie (DE)
  • Centre National de la Recherche Scientifique (FR)
Corresponding author
Milles, Sigrid
Venue
Nature Communications
Publisher
openRxiv
Published
2024-10-01
Volume
16
Issue
1
Pages
7783-7783
ISSN
2041-1723 (ISSN-L)
OpenAlex
W4413405547
Cited by
8
References
1
Citations by year
2026: 4 · 2025: 4
FWCI
4.00
Type
journal article
Language
en
Open access
Locations
  • Nature Communications (publishedVersion, cc-by)
  • bioRxiv (Cold Spring Harbor Laboratory) (acceptedVersion, cc-by-nc-nd)
  • Europe PMC (PubMed Central) (publishedVersion, cc-by)
  • PubMed Central (publishedVersion, cc-by)
  • PubMed (publishedVersion)
  • Refubium (Universitätsbibliothek der Freien Universität Berlin) (submittedVersion, cc-by)
  • DOAJ (DOAJ: Directory of Open Access Journals) (submittedVersion, cc-by-sa)
  • Universitätsbibliothek der FU Berlin Hochschulschriftenstelle u. Dokumentenserver (cc-by)
Funders
  • European Commission (802209, HORIZON2020, ERC StG 802209)
  • Leibniz-Gemeinschaft
Topics
  • Life Sciences › Biochemistry, Genetics and Molecular Biology › Cell Biology › Cellular transport and secretion
  • Life Sciences › Biochemistry, Genetics and Molecular Biology › Molecular Biology › Protein Structure and Dynamics
  • Life Sciences › Biochemistry, Genetics and Molecular Biology › Molecular Biology › Receptor Mechanisms and Signaling
Keywords
Eps15, Dab2, clathrin-mediated endocytosis, EH domain, intrinsically disordered regions, binding promiscuity, protein-protein interaction, liquid-liquid phase separation, protein condensates, competitive binding
MeSH terms
Protein Domains, Biomolecular Condensates, Endocytosis, Humans, Phenylalanine, Nuclear Magnetic Resonance, Biomolecular, Amino Acid Motifs, Clathrin-Coated Vesicles, Adaptor Proteins, Signal Transducing, Apoptosis Regulatory Proteins, Hydrophobic and Hydrophilic Interactions, Protein Interaction Maps, Intrinsically Disordered Proteins

About these checks

Registry, retraction, Cites and statistics results are computed, not judged, with one exception: a printed reference that no index lists is read once by a model before it counts as a citation error. Claims are extracted by a model and kept only when their quote appears verbatim in the text; each cited source is then checked, with a model’s help, for whether it says what the claim relies on. Those verdicts can be wrong — read the claim’s quote and the cited source before relying on one.

Statistics and arithmetic are recomputed, not judged.

Confidence bands are shown only for fields calibrated on our annotated test set. None is calibrated yet, so no band is shown.

What counts as a claim ›How we measure confidence ›How we check this ›

Are you an author, or do you see a problem with this page? Request a review

How to cite

Cite CoChat for the checks on this page, and the paper for its own findings.

This page
CoChat. (2026). Citation check: Promiscuous and multivalent interactions between Eps15 and partner protein Dab2 generate a complex interaction network. https://app.cochat.ai/papers/10.1101/2024.09.30.615448
The paper
Papagiannoula, A., Vedel, I. M., Motzny, K., Tengo, M., Saiti, A., & Milles, S. (2024). Promiscuous and multivalent interactions between Eps15 and partner protein Dab2 generate a complex interaction network. Nature Communications. https://doi.org/10.1101/2024.09.30.615448

Data sources

Bibliographic data: Semantic Scholar, OpenAlex, Crossref.

Contains information from the Semantic Scholar Academic Graph Datasets, made available under the ODC Attribution License (ODC-BY 1.0).

Semantic Scholar’s data is described in: Kinney, R., et al. (2023). The Semantic Scholar Open Data Platform. arXiv:2301.10140.