PreprintCited by 5Ion channel regulation and functionProtein Structure and DynamicsCardiac electrophysiology and arrhythmias

The DOI matches its Crossref record; 2 of the 2 references it cites were found in a registry or an index.

Structural Basis for Voltage Gating and Dalfampridine Binding in the Shaker Potassium Channel

Open access
Pinto-Anwandter, Bernardo I·2024·Biophysical Journal

Preprint — published as 10.1016/j.bpj.2025.06.029 · Paper page

Abstract

The generation and propagation of action potentials in neurons depend on the coordinated activation of voltage-dependent sodium and potassium channels. Potassium channels of the Shaker family regulate neuronal excitability through voltage-dependent opening and closing of their ion conduction pore. This family of channels is an important therapeutic target, particularly in multiple sclerosis where the inhibitor dalfampridine (4-aminopyridine) is used to improve nerve conduction. The molecular details of how the voltage sensor domain drives opening of the pore domain has been limited by the lack of closed-state structures, also impairing the search for novel drugs. Using AlphaFold2-based conformational sampling methods we identify a structural model for the closed Shaker potassium channel where movement of the voltage sensor drives the opening trough interactions between the S4-S5 linker and S6 helix. We show experimentally that breakage of a backbone hydrogen bond is a critical part of the activation pathway. Through docking we identify a hydrophobic cavity formed by the pore domain helices that binds dalfampridine in the closed state. Our results demonstrate how voltage sensor movement drives pore opening and provide a structural framework for developing new therapeutic agents targeting the closed state. We anticipate this work will enable structure-based drug design efforts focused on state-dependent modulation of voltage-gated ion channels for the treatment of neurological disorders.

Overview

The claims and statistics of this paper haven’t been checked yet.

Run the check — free, no account needed. It reads the open-access text and checks the sources it cites.

A few free checks a day · papers already verified open instantly · results are public

Integrity signals

Registry

Crossref · 10.1101/2024.10.22.619486

Cites

2 of 2 references verified0 citation errors · 0 not checkable

Statistics

Figures

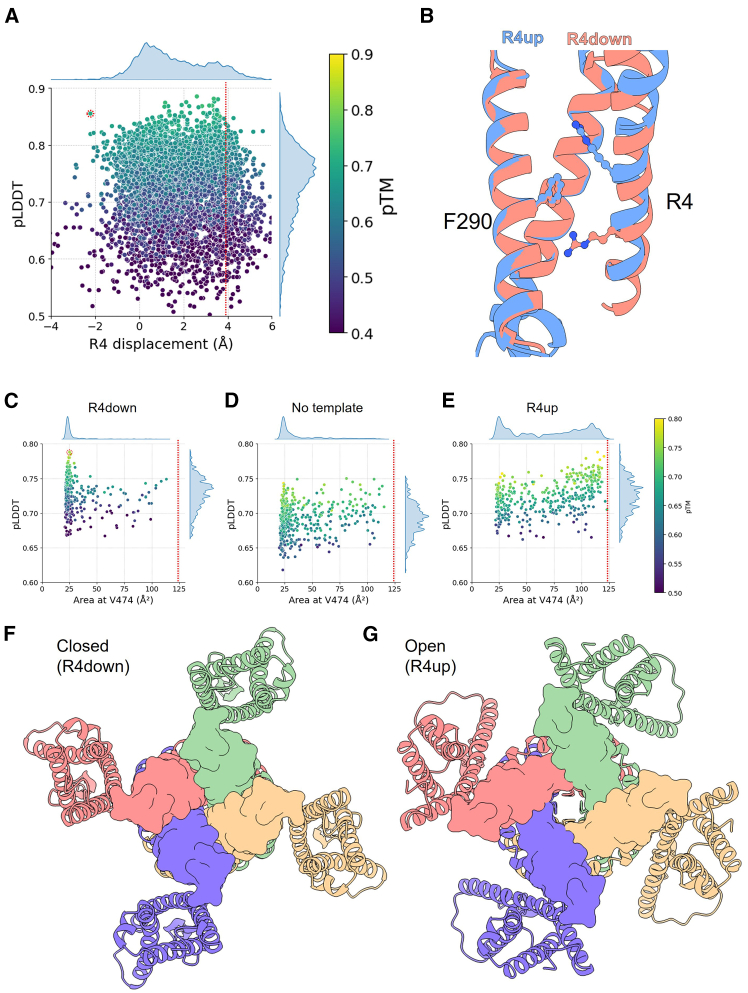
Figure 1 Obtaining a closed state model for the Shaker channel. (A) Plot of R4 α carbon displacement versus pLDDT for AF2 generated models of Shaker VSD (6000 models). Points colored according to the predicted template modeling (pTM) score. MSA subsampling parameters used was 4:8 (“max_seq”:“max_extra_seq”). Circle indicates the selected VSD model, dotted red line indicates the displacement in the WT structure. (B) Comparison between the VSD from the Shaker WT structure (R4up, PDB: 7sip (22)) and the selected VSD model (R4down), showing position of residues F290 and R4. S3 was removed for clarity. (C–E) Plot of quadrilateral area at the level of V474 versus pLDDT for AF2 generated models (400 models per plot) of Shaker tetrameric channel (residues 215–495) using R4down template (C), no template (D), or R4up template (E). Dotted line indicates the area in the WT structure. MSA subsampling parameters used was 16:32. Circle in (C) indicates the selected model. Side plots show the kernel density estimates distribution for each axis. (F and G) Intracellular view of the tetrameric Shaker channel in the closed (R4down) (F) and open R4up (G) conformations, each subunit is shown in a different color. Surface representation is shown for residues of the S6 C-terminal region.
Figure 1 Obtaining a closed state model for the Shaker channel. (A) Plot of R4 α carbon displacement versus pLDDT for AF2 generated models of Shaker VSD (6000 models). Points colored according to the predicted template modeling (pTM) score. MSA subsampling parameters used was 4:8 (“max_seq”:“max_extra_seq”). Circle indicates the selected VSD model, dotted red line indicates the displacement in the WT structure. (B) Comparison between the VSD from the Shaker WT structure (R4up, PDB: 7sip (22)) and the selected VSD model (R4down), showing position of residues F290 and R4. S3 was removed for clarity. (C–E) Plot of quadrilateral area at the level of V474 versus pLDDT for AF2 generated models (400 models per plot) of Shaker tetrameric channel (residues 215–495) using R4down template (C), no template (D), or R4up template (E). Dotted line indicates the area in the WT structure. MSA subsampling parameters used was 16:32. Circle in (C) indicates the selected model. Side plots show the kernel density estimates distribution for each axis. (F and G) Intracellular view of the tetrameric Shaker channel in the closed (R4down) (F) and open R4up (G) conformations, each subunit is shown in a different color. Surface representation is shown for residues of the S6 C-terminal region.CC BY · PubMed Central
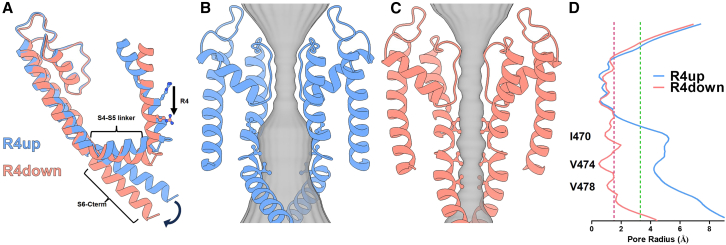
Figure 2 Conformational changes from open to closed state of Shaker. (A) Superposition of the S4 to S6 region of a single subunit in the open (R4up, blue) and closed (R4down, red) states of the Shaker channel. Arrows indicate two major conformational changes between states: the movement of the S4 helix (shown as the displacement of R4) and the S6 C-terminus. (B and C) Intramembrane view of two opposed subunits of the R4up open state (B) and R4down closed state (C). Residues I470, V474, and V478 side chains are shown in ball and stick representation. The pore diameter obtained through HOLE calculations is shown in gray. (D) Pore radius analysis for the open (blue line) and closed (red line) states. The y axis represents the position along the pore axis aligned with the structures in (B) and (C). The position of key residues I470, V474, and V478 are indicated, highlighting the region of major constriction in the closed state. Dashed red and green lines indicate radii of 1.5 and 3.3 Å corresponding to the ionic and hydrated radius of potassium, respectively.
Figure 2 Conformational changes from open to closed state of Shaker. (A) Superposition of the S4 to S6 region of a single subunit in the open (R4up, blue) and closed (R4down, red) states of the Shaker channel. Arrows indicate two major conformational changes between states: the movement of the S4 helix (shown as the displacement of R4) and the S6 C-terminus. (B and C) Intramembrane view of two opposed subunits of the R4up open state (B) and R4down closed state (C). Residues I470, V474, and V478 side chains are shown in ball and stick representation. The pore diameter obtained through HOLE calculations is shown in gray. (D) Pore radius analysis for the open (blue line) and closed (red line) states. The y axis represents the position along the pore axis aligned with the structures in (B) and (C). The position of key residues I470, V474, and V478 are indicated, highlighting the region of major constriction in the closed state. Dashed red and green lines indicate radii of 1.5 and 3.3 Å corresponding to the ionic and hydrated radius of potassium, respectively.CC BY · PubMed Central
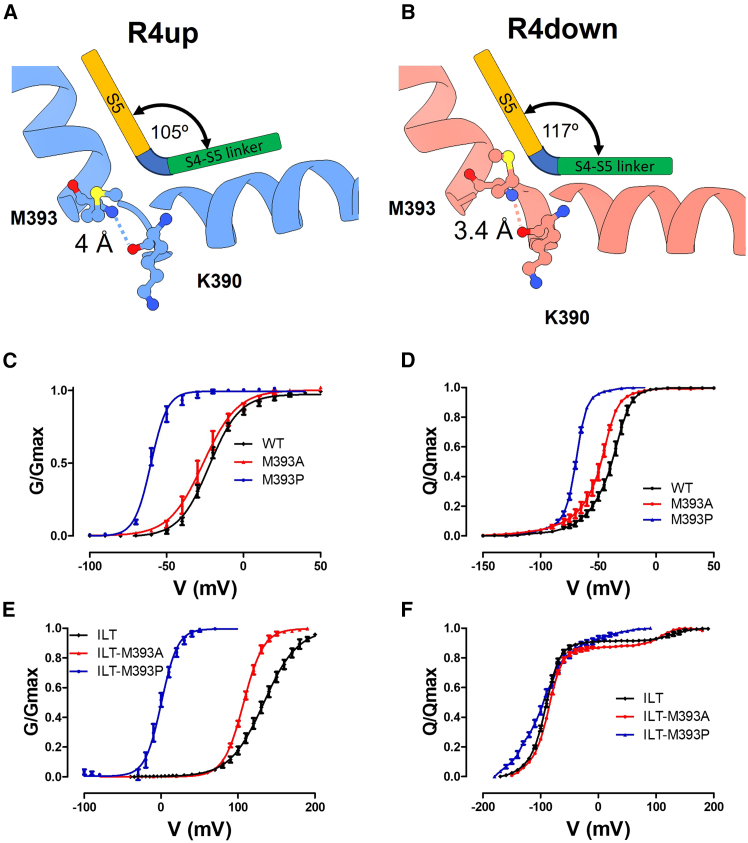
Figure 3 S4-S5 linker movement during opening involves breakage of a backbone hydrogen bond. (A and B) S4-S5 linker position relative to the S5 in the R4up open conformation (A) and the R4down closed conformation (B). The dashed line shows the distance between K390 carbonyl group and M393 amide group. The cartoon exemplifies the movement of the S4-S5 linker relative to the S5. (C) G-V relationship for the WT channel (black), M393A (red), and M393P (blue) mutants. (D) Q-V relationship for the WT channel (black), M393A (red), and M393P (blue) mutants. (E) G-V relationship for ILT (black), ILT-M393A (red), and ILT-M393P (blue) mutants. (F) Q-V relationship for ILT (black), ILT-M393A (red), and ILT-M393P (blue) mutants. Results shown as mean ± SEM, n ≥ 4. Continuous lines correspond to a two-state fit (Eq. 1) in the GV curves and an interpolation between points in the Q-V curves.
Figure 3 S4-S5 linker movement during opening involves breakage of a backbone hydrogen bond. (A and B) S4-S5 linker position relative to the S5 in the R4up open conformation (A) and the R4down closed conformation (B). The dashed line shows the distance between K390 carbonyl group and M393 amide group. The cartoon exemplifies the movement of the S4-S5 linker relative to the S5. (C) G-V relationship for the WT channel (black), M393A (red), and M393P (blue) mutants. (D) Q-V relationship for the WT channel (black), M393A (red), and M393P (blue) mutants. (E) G-V relationship for ILT (black), ILT-M393A (red), and ILT-M393P (blue) mutants. (F) Q-V relationship for ILT (black), ILT-M393A (red), and ILT-M393P (blue) mutants. Results shown as mean ± SEM, n ≥ 4. Continuous lines correspond to a two-state fit (Eq. 1) in the GV curves and an interpolation between points in the Q-V curves.CC BY · PubMed Central
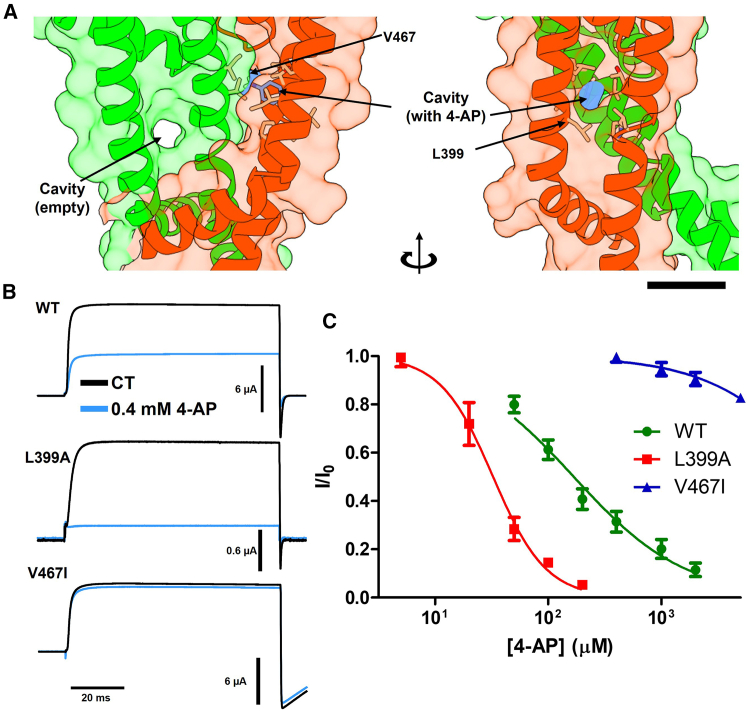
Figure 4 Identification of the 4-aminopyridine binding pocket. (A) Docking analysis results showing the hydrophobic cavity where 4-AP binds, formed by residues in the S5 (L399, I400, L403) and S6 (V467, T469, L472, P473). Scale bar, 1 nm. (B) Inhibition of ionic currents by 0.4 mM 4-AP in WT, L399A, and V467I mutant channels. (C) Dose-response curves for the WT channel (green circles, half inhibitory concentration [IC50] = 170 μM), L399A (red squares, IC50 = 32 μM), and V467I (blue triangles, IC50 = 28 mM). Results shown as mean ± SE, n ≥ 4.
Figure 4 Identification of the 4-aminopyridine binding pocket. (A) Docking analysis results showing the hydrophobic cavity where 4-AP binds, formed by residues in the S5 (L399, I400, L403) and S6 (V467, T469, L472, P473). Scale bar, 1 nm. (B) Inhibition of ionic currents by 0.4 mM 4-AP in WT, L399A, and V467I mutant channels. (C) Dose-response curves for the WT channel (green circles, half inhibitory concentration [IC50] = 170 μM), L399A (red squares, IC50 = 32 μM), and V467I (blue triangles, IC50 = 28 mM). Results shown as mean ± SE, n ≥ 4.CC BY · PubMed Central
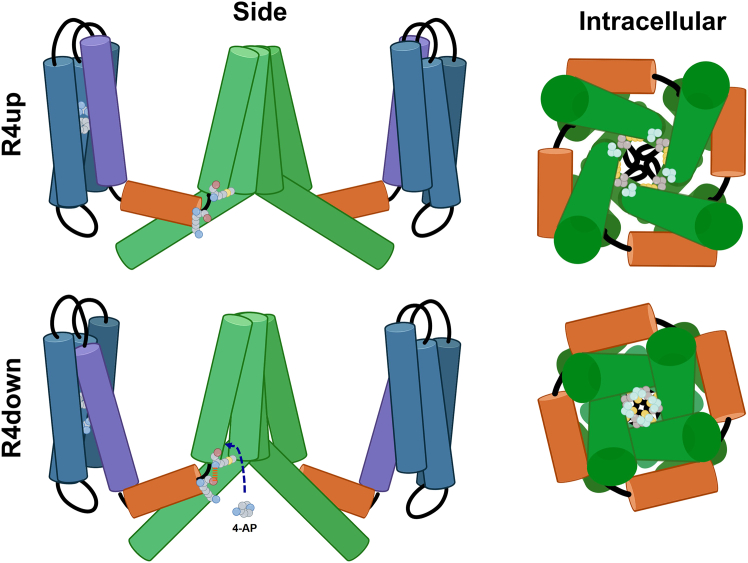
Figure 5 Proposed gating mechanism and 4-aminopyridine binding for the Shaker channel family. Top (R4up) Shaker channel in the active open state, where the VSD S4 segments (purple) are in the “R4up” conformation, and the channel pore is open (green). Bottom (R4down): channel in its partially activated closed state, where the VSD S4 segments are in the “R4down” position. The downward movement of the S4 segments triggers a downward and radial displacement of the S4-S5 linker (orange) that produces a contraction and rotation of the S6 C-terminal helices, closing the pore and allowing for the binding of 4-AP. Side view (left) shows two opposed subunits from a view parallel to the membrane, residues F290, R377 (R4) in the VSD and K390 and M393 in the S4-S5 linker hinge are shown. Intracellular view (right) shows S4-S5 linker (orange), S5 and S6 (green) from the intracellular side. Residues I470 (yellow), V474 (gray), and V478 (pale blue) are shown. Created with BioRender.com.
Figure 5 Proposed gating mechanism and 4-aminopyridine binding for the Shaker channel family. Top (R4up) Shaker channel in the active open state, where the VSD S4 segments (purple) are in the “R4up” conformation, and the channel pore is open (green). Bottom (R4down): channel in its partially activated closed state, where the VSD S4 segments are in the “R4down” position. The downward movement of the S4 segments triggers a downward and radial displacement of the S4-S5 linker (orange) that produces a contraction and rotation of the S6 C-terminal helices, closing the pore and allowing for the binding of 4-AP. Side view (left) shows two opposed subunits from a view parallel to the membrane, residues F290, R377 (R4) in the VSD and K390 and M393 in the S4-S5 linker hinge are shown. Intracellular view (right) shows S4-S5 linker (orange), S5 and S6 (green) from the intracellular side. Residues I470 (yellow), V474 (gray), and V478 (pale blue) are shown. Created with BioRender.com.CC BY · PubMed Central

Verification

Claims the paper makes

The claims and statistics of this paper haven’t been checked yet.

Run the check — free, no account needed. It reads the open-access text and checks the sources it cites.

A few free checks a day · papers already verified open instantly · results are public

Self-check

Percentages, sums and reported differences re-computed from the paper’s own numbers.

The self-check needs the paper’s full text.

Citations

Cites

Research works printed but not linked: 44

  1. 2012, K+ channels: Function-structural overview, Compr. Physiol, 2, 2087
  2. Hille, B. Ion Channels of Excitable Membranes (3rd Edition). (Sinauer Associates Inc 2001-07, 2001). doi:citeulike-article-id:306134.
  3. 10.1038/nrd2983 · DOI
  4. 10.1016/S0896-6273(00)80142-7 · DOI
  5. 10.1016/S0896-6273(00)80143-9 · DOI
  6. 10.1038/nature02270 · DOI
  7. 10.1085/jgp.117.5.469 · DOI
  8. 10.1016/S0165-0173(01)00134-5 · DOI
  9. 10.1016/S0140-6736(09)60442-6 · DOI
  10. 10.1345/aph.1L028 · DOI
  11. 10.1101/2021.10.04.463034 · DOI · Paper page
  12. 10.1126/science.abj8754 · DOI · Paper page
  13. 10.1002/prot.26382 · DOI · Paper page
  14. 10.1038/s41467-024-46715-9 · DOI · Paper page
  15. 10.1126/sciadv.abj5362 · DOI
  16. 10.1073/pnas.1103397108 · DOI
  17. Lacroix, J. J. , Clark Hyde, H. , Campos, F. V. & Bezanilla, F. Moving gating charges through the gating pore in a Kv channel voltage sensor. Proc. Natl. Acad. Sci. U. S. A. 111, (2014). · DOI
  18. 10.1126/science.1185954 · DOI
  19. 10.1002/prot.26257 · DOI
  20. 10.1016/S0896-6273(00)80357-8 · DOI
  21. 10.1016/0896-6273(93)90190-3 · DOI
  22. 10.1085/jgp.113.3.389 · DOI
  23. 10.1016/S0006-3495(01)75749-9 · DOI
  24. 10.1021/acs.jcim.1c00203 · DOI
  25. 10.1002/jcc.21334 · DOI · Paper page
  26. 10.1016/0896-6273(93)90154-J · DOI
  27. 10.1085/jgp.200810048 · DOI
  28. 10.1085/jgp.201010573 · DOI
  29. 10.1085/jgp.20028696 · DOI
  30. 10.1038/35101535 · DOI
  31. 10.1038/35079500 · DOI
  32. 10.1126/science.2000494 · DOI
  33. 10.1038/273387a0 · DOI
  34. 10.1085/jgp.58.4.413 · DOI · Paper page
  35. 10.1085/jgp.109.5.527 · DOI
  36. 10.1016/S0006-3495(01)76189-9 · DOI
  37. 10.1038/S41592-022-01488-1 · DOI · Paper page
  38. 10.1093/bioinformatics/bty1057 · DOI · Paper page
  39. 10.1016/S0263-7855(97)00009-X · DOI
  40. 10.1016/j.bpj.2024.07.010 · DOI · Paper page
  41. 10.1002/PRO.3943 · DOI
  42. 10.1126/science.2122519 · DOI
  43. 10.1016/S0076-6879(98)93020-8 · DOI
  44. 10.1085/jgp.201210827 · DOI

Metadata

Authors
Pinto-Anwandter, B. I.
Venue
Biophysical Journal
Publisher
openRxiv
Published
2024-10-25
Volume
124
Issue
15
Pages
2500-2510
ISSN
0006-3495 (ISSN-L)
OpenAlex
W4411593274
Cited by
5
References
2
Citations by year
2026: 2 · 2025: 3
FWCI
1.50
Type
journal article
Language
en
Open access
Locations
  • Biophysical Journal (publishedVersion, cc-by)
  • bioRxiv (Cold Spring Harbor Laboratory) (acceptedVersion, cc-by-nc-nd)
  • PubMed (publishedVersion)
  • PubMed Central (publishedVersion, cc-by)
  • PubMed Central (submittedVersion, cc-by-nc-nd)
Funders
  • Pew Charitable Trusts
  • Google (GCP19980904)
  • University of Chicago
  • National Institutes of Health
  • National Institute of General Medical Sciences (R01GM030376)
Topics
  • Life Sciences › Biochemistry, Genetics and Molecular Biology › Molecular Biology › Ion channel regulation and function
  • Life Sciences › Biochemistry, Genetics and Molecular Biology › Molecular Biology › Protein Structure and Dynamics
  • Health Sciences › Medicine › Cardiology and Cardiovascular Medicine › Cardiac electrophysiology and arrhythmias
Keywords
Kv1 potassium channels, voltage-dependent gating, voltage-sensing domain, 4-aminopyridine, pore gating, action potential repolarization, multiple sclerosis

About these checks

Registry, retraction, Cites and statistics results are computed, not judged, with one exception: a printed reference that no index lists is read once by a model before it counts as a citation error. Claims are extracted by a model and kept only when their quote appears verbatim in the text; each cited source is then checked, with a model’s help, for whether it says what the claim relies on. Those verdicts can be wrong — read the claim’s quote and the cited source before relying on one.

Statistics and arithmetic are recomputed, not judged.

Confidence bands are shown only for fields calibrated on our annotated test set. None is calibrated yet, so no band is shown.

What counts as a claim ›How we measure confidence ›How we check this ›

Are you an author, or do you see a problem with this page? Request a review