

The DOI matches its Crossref record; 1 of the 1 references it cites were found in a registry or an index.
Machine learning driven acceleration of biopharmaceutical formulation development using Excipient Prediction Software (ExPreSo)
Open accessPreprint — published as 10.1016/j.csbj.2025.10.026 · Paper page
Abstract
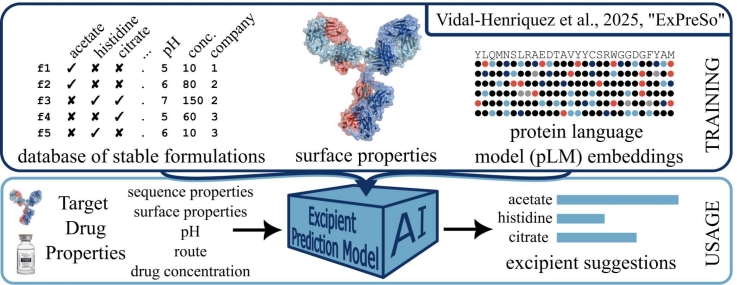
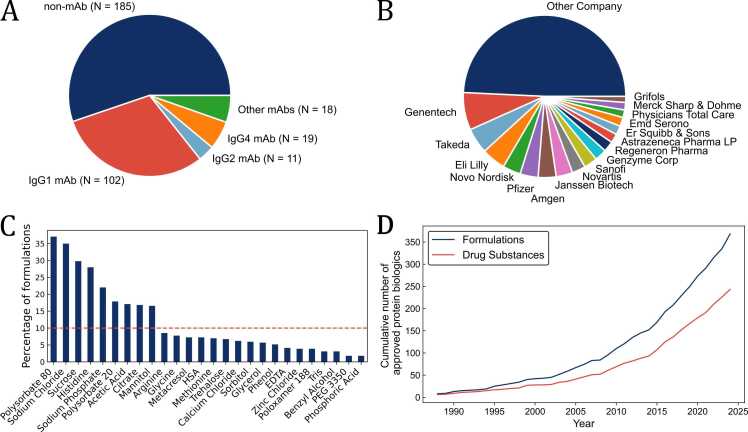
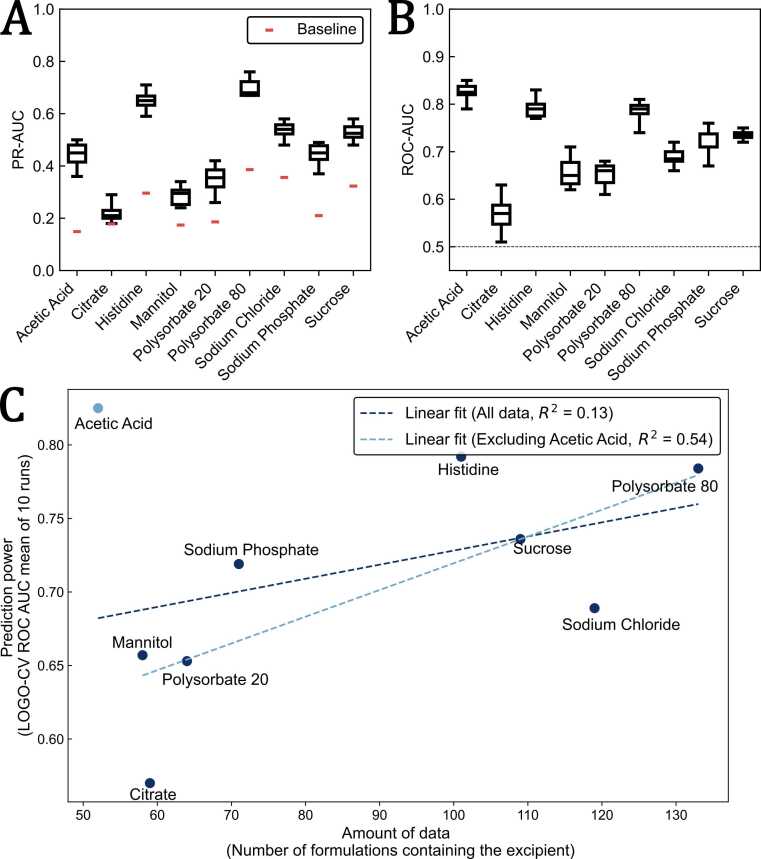
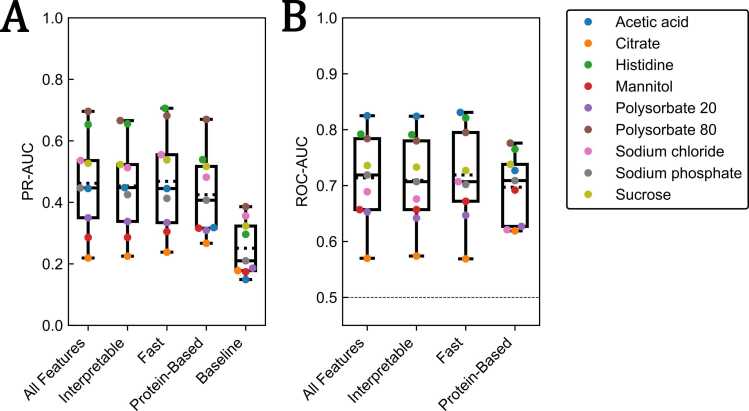
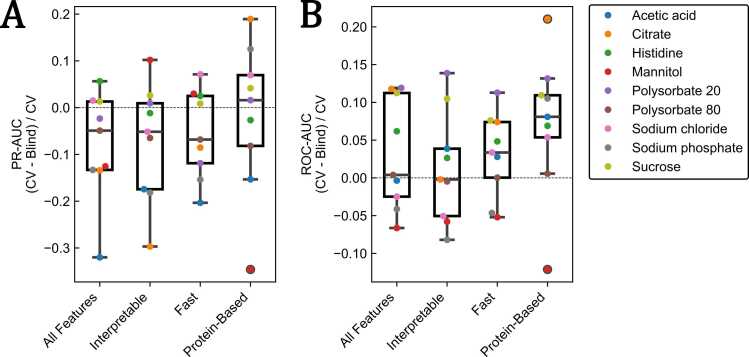
Formulation development of protein biopharmaceuticals has become increasingly challenging due to new modalities and higher target drug substance concentrations. The limited amount of drug substance available during development, coupled with extensive analytical requirements, restrict the number of excipients that can be empirically screened. There is a strong need for in silico tools to optimize excipient pre-selection before wet lab experiments. Here, we introduce Excipient Prediction Software (ExPreSo), a supervised machine learning algorithm that suggests excipients based on the properties of the protein drug substance and target product profile. ExPreSo was trained on a dataset comprising 335 regulatory-approved peptide and protein drug products. Predictive features included protein structural properties, protein language model embeddings, and drug product characteristics. ExPreSo showed good performance for the nine most prevalent excipients in biopharmaceutical formulations and minimal overfitting. A fast variant of ExPreSo using only sequence-based input features showed similar prediction power to slower models that relied on molecular modeling. Notably, an ExPreSo variant using only protein-based input features also showed good performance, indicating resilience to the influence of platform formulations. To our knowledge, this is the first machine learning algorithm to suggest biopharmaceutical excipients based on the dataset of regulatory-approved drug products. Overall, ExPreSo shows great potential to reduce the time, costs, and risks associated with excipient screening during formulation development. Abstract Figure:
Overview
The claims and statistics of this paper haven’t been checked yet.
Run the check — free, no account needed. It reads the open-access text and checks the sources it cites.
Integrity signals
Registry
Cites
Statistics
Figures
Verification
Claims the paper makes
The claims and statistics of this paper haven’t been checked yet.
Run the check — free, no account needed. It reads the open-access text and checks the sources it cites.
Self-check
Percentages, sums and reported differences re-computed from the paper’s own numbers.
The self-check needs the paper’s full text.
Citations
Cites
Highly accurate protein structure prediction with AlphaFold
Jumper, J., Evans, R., Pritzel, A., Green, T., Figurnov, M., Ronneberger, O., Tunyasuvunakool, K., Bates, R., Žídek, A., Potapenko, A., et al. (2021) · Nature · doi:10.1038/s41586-021-03819-2 · Cited by 43,764
Research works printed but not linked: 51
- 10.1002/jps.10154 · DOI
- 10.1016/j.ejpb.2011.03.004 · DOI
- 10.1016/j.xphs.2023.03.026 · DOI
- 10.1080/19420862.2023.2285277 · DOI
- 10.1080/19420862.2023.2211185 · DOI
- 10.1016/j.xphs.2021.11.008 · DOI
- 10.1080/19420862.2023.2205540 · DOI
- 10.1016/j.ijpharm.2024.124877 · DOI
- 10.1038/nrd3581 · DOI
- 10.1016/j.molimm.2015.01.003 · DOI · Paper page
- 10.1038/s41573-023-00709-2 · DOI
- 10.1093/bib/bbae307 · DOI
- 10.1080/19420862.2023.2185924 · DOI
- 10.1016/j.sbi.2022.102343 · DOI
- 10.1080/19420862.2023.2171248 · DOI
- 10.1007/s43393-021-00024-0 · DOI
- 10.3390/ijms17060853 · DOI
- 10.1016/j.ejps.2023.106625 · DOI
- 10.1007/S11095-019-2703-7/FIGURES/8 · DOI
- 10.1021/acs.molpharmaceut.9b00545 · DOI
- 10.1080/19420862.2020.1854149 · DOI
- 10.1021/acs.molpharmaceut.4c00859 · DOI
- 10.1021/acs.molpharmaceut.1c00135 · DOI
- 10.3389/fmolb.2021.689400 · DOI
- 10.1016/j.xphs.2017.12.015 · DOI
- 10.1021/acscentsci.8b00913 · DOI
- 10.1021/acs.molpharmaceut.0c00629 · DOI
- 10.1021/acs.molpharmaceut.0c00775 · DOI
- 10.1080/19420862.2023.2212416 · DOI
- 10.26434/chemrxiv-2024-1zv1q · DOI
- 10.1016/j.xphs.2020.10.051 · DOI
- 10.1016/j.ejpb.2020.04.002 · DOI
- 10.1093/bib/bbad468 · DOI
- 10.1016/j.ijpharm.2023.122839 · DOI
- 10.1007/s11095-020-02919-4 · DOI
- 10.1016/j.xphs.2021.03.017 · DOI
- 10.1093/abt/tbab027 · DOI
- 10.1186/s12859-019-2669-9 · DOI
- 10.1002/pro.4497 · DOI · Paper page
- 10.1073/pnas.2016239118 · DOI · Paper page
- 10.1109/TPAMI.2021.3095381 · DOI · Paper page
- 10.1038/s41598-021-81132-8 · DOI
- 10.1093/bioinformatics/btp163 · DOI · Paper page
- 10.1007/s10994-006-6226-1 · DOI · Paper page
- 10.1016/j.cpc.2010.04.018 · DOI
- 10.1080/19420862.2023.2248671 · DOI
- 10.1613/jair.953 · DOI · Paper page
- 10.1093/bioinformatics/bts565 · DOI · Paper page
- 10.1093/bioinformatics/btl158 · DOI
- Lundberg SM , Lee SI . A unified approach to interpreting model predictions. In: Guyon I , Luxburg U V , Bengio S , et al. , eds. Advances in Neural Information Processing Systems 30. Curran Associates, Inc.; 2017:4765–4774. http://papers.nips.cc/paper/7062-a-unified-approach-to-interpreting-model-predictions.pdf
- 10.1023/A:1010933404324 · DOI · Paper page
Metadata
- Authors
- Vidal-Henriquez, E., Holder, T., Lee, N. F., Pompe, C., & Teese, M. G.
- Affiliations
- Leukocare AG, Klopferspitz 19a, 82152 Martinsried/Munich, Germany
- Corresponding author
- Teese, Mark George
- Venue
- Computational and Structural Biotechnology Journal
- Publisher
- openRxiv
- Published
- 2025-02-16
- Volume
- 27
- Pages
- 4517-4525
- ISSN
- 2001-0370 (ISSN-L)
- PMC
- PMC12597001
- OpenAlex
- W4415197028
- Cited by
- 9
- References
- 1
- Citations by year
- 2026: 6 · 2025: 3
- FWCI
- 2.71
- Type
- journal article
- Language
- en
- Open access
- gold
- doi.org
- Licence
- cc-by-nc-nd
- www.biorxiv.org/about/FAQ#license (vor)
- Locations
- Computational and Structural Biotechnology Journal (publishedVersion, cc-by-nc-nd)
- bioRxiv (Cold Spring Harbor Laboratory) (acceptedVersion)
- Europe PMC (PubMed Central) (publishedVersion, cc-by-nc-nd)
- PubMed (publishedVersion)
- DOAJ (DOAJ: Directory of Open Access Journals) (submittedVersion, cc-by-sa)
- Funders
- Technische Universität München
- University of Colorado Boulder
- Topics
- Life Sciences › Biochemistry, Genetics and Molecular Biology › Molecular Biology › Protein purification and stability
- Life Sciences › Pharmacology, Toxicology and Pharmaceutics › Drug Discovery › Computational Drug Discovery Methods
- Life Sciences › Biochemistry, Genetics and Molecular Biology › Molecular Biology › Machine Learning in Bioinformatics
- Keywords
- excipient selection, protein language model embeddings, protein structural properties
About these checks
Registry, retraction, Cites and statistics results are computed, not judged, with one exception: a printed reference that no index lists is read once by a model before it counts as a citation error. Claims are extracted by a model and kept only when their quote appears verbatim in the text; each cited source is then checked, with a model’s help, for whether it says what the claim relies on. Those verdicts can be wrong — read the claim’s quote and the cited source before relying on one.
Statistics and arithmetic are recomputed, not judged.
Confidence bands are shown only for fields calibrated on our annotated test set. None is calibrated yet, so no band is shown.
What counts as a claim ›How we measure confidence ›How we check this ›
Are you an author, or do you see a problem with this page? Request a review
