PreprintCited by 2Protein Structure and DynamicsEnzyme Structure and FunctionMachine Learning in Bioinformatics

The DOI matches its Crossref record; 1 of the 1 references it cites were found in a registry or an index.

An interpretable alphabet for local protein structure search based on amino acid neighborhoods

Open access
Zerefa, Saba, Cool, Jesse, Singh, Pramesh, Petti, Samantha·2025·Bioinformatics

Preprint — published as 10.1093/bioinformatics/btaf458 · Paper page

Abstract

Motivation: Recent advancements in protein structure prediction methods have vastly increased the size of databases of protein structures, necessitating fast methods for protein structure comparison. Search methods that find structurally similar proteins can be applied to find remote homologs, study the functional relationships among proteins, and aid in protein engineering tasks. The structure comparison method Foldseek represents each protein structure as a sequence of “3Di” characters and uses highly optimized sequence comparison software to search with this alphabet. An alternate alphabet encoding richer features has the potential to improve search accuracy while leaving the underlying search algorithm unchanged. Results: We design a “3Dn” structural alphabet that encodes the local neighborhoods around each amino acid in an interpretable way. In a search benchmark task, a combination of our alphabet and Foldseek’s 3Di alphabet, outperforms each alphabet individually and ranks best among local search methods that do not require amino acid identity information. We provide software tools that enable the exploration of novel alphabets and combinations of alphabets for protein structure search. Availability and implementation: The code is freely available at https://github.com/spetti/structure_comparison .

Overview

The claims and statistics of this paper haven’t been checked yet.

Run the check — free, no account needed. It reads the open-access text and checks the sources it cites.

A few free checks a day · papers already verified open instantly · results are public

Integrity signals

Registry

Crossref · 10.1101/2025.04.21.649886

Cites

1 of 1 references verified0 citation errors · 0 not checkable

Statistics

Figures

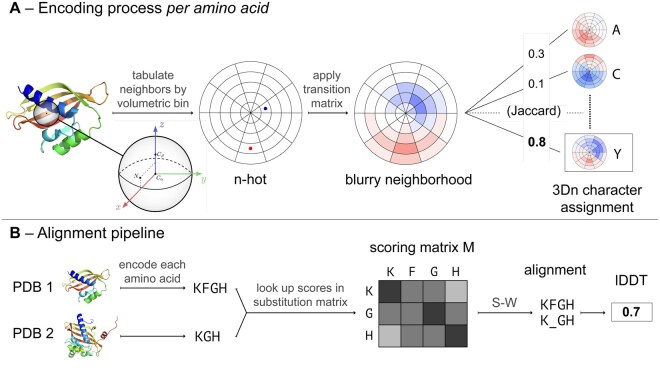
Figure 1. Overview of the process for encoding a 3Dn sequence and generating an alignment. (A) Encoding process for a single amino acid. We define a reference frame centered at the Cα atom and divide the surrounding 15Å sphere into bins. Then we compute an n-hot vector that tabulates the positions and secondary structures of neighboring amino acids in the sphere. The n-hot vector shown is a simplified 2D example. A transition matrix is applied to the n-hot vector, resulting in a blurry neighborhood. The blurry neighborhood is compared via weighted Jaccard similarity to twenty landmark blurry neighborhoods, each of which are affiliated with a 3Dn character. The amino acid is assigned to the 3Dn character with the largest weighted Jaccard similarity value. (B) Pipeline demonstrating how to obtain an alignment from two PDB files. Each amino acid is encoded into a 3Dn character according to the process outlined in A. For simplicity, we only show a short (three or four character) subsequence of the encoded sequence. A scoring matrix for the pair of encoded sequences is generated by looking up a substitution score for each pair. With this scoring matrix, the Smith-Waterman (S-W) algorithm is used to generate an alignment, the quality of which is computed using lDDT. Protein depictions are courtesy of SCOPe (Chandonia et al. 2019).
Figure 1. Overview of the process for encoding a 3Dn sequence and generating an alignment. (A) Encoding process for a single amino acid. We define a reference frame centered at the Cα atom and divide the surrounding 15Å sphere into bins. Then we compute an n-hot vector that tabulates the positions and secondary structures of neighboring amino acids in the sphere. The n-hot vector shown is a simplified 2D example. A transition matrix is applied to the n-hot vector, resulting in a blurry neighborhood. The blurry neighborhood is compared via weighted Jaccard similarity to twenty landmark blurry neighborhoods, each of which are affiliated with a 3Dn character. The amino acid is assigned to the 3Dn character with the largest weighted Jaccard similarity value. (B) Pipeline demonstrating how to obtain an alignment from two PDB files. Each amino acid is encoded into a 3Dn character according to the process outlined in A. For simplicity, we only show a short (three or four character) subsequence of the encoded sequence. A scoring matrix for the pair of encoded sequences is generated by looking up a substitution score for each pair. With this scoring matrix, the Smith-Waterman (S-W) algorithm is used to generate an alignment, the quality of which is computed using lDDT. Protein depictions are courtesy of SCOPe (Chandonia et al. 2019).CC BY · PubMed Central
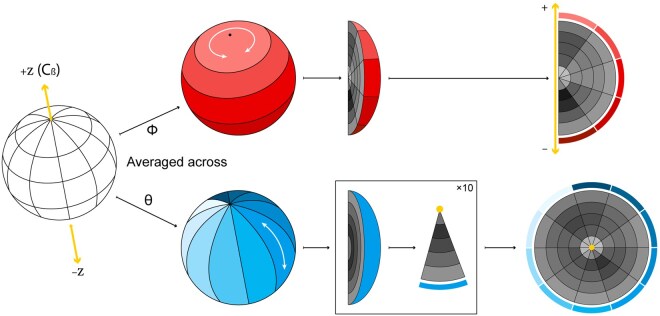
Figure 2. Visualizing 3Dn characters. We discretize the 15Å sphere oriented with respect to the reference frame depicted in Fig. 1A into 250 bins by taking 10 intervals in ϕ, 5 intervals in θ and 5 intervals in r (hidden in the left image). To visualize the neighbor counts in each of these bins, we show two flattened images obtained by averaging over ϕ (upper row) and θ (lower row). In the upper row, the darkness of each cell represents the average number of neighbors across all bins with a particular interval for r and interval for θ. In the lower row, the darkness of each cell represents the average number of neighbors across all bins with a particular interval for r and interval for ϕ. The z-axis appears as a line in the upper plot and a point in the lower plot, as depicted in yellow. See Fig. 3 for examples. Note that these figures are not to scale; true r, θ, and ϕ values are chosen so that each bin has equal volume.
Figure 2. Visualizing 3Dn characters. We discretize the 15Å sphere oriented with respect to the reference frame depicted in Fig. 1A into 250 bins by taking 10 intervals in ϕ, 5 intervals in θ and 5 intervals in r (hidden in the left image). To visualize the neighbor counts in each of these bins, we show two flattened images obtained by averaging over ϕ (upper row) and θ (lower row). In the upper row, the darkness of each cell represents the average number of neighbors across all bins with a particular interval for r and interval for θ. In the lower row, the darkness of each cell represents the average number of neighbors across all bins with a particular interval for r and interval for ϕ. The z-axis appears as a line in the upper plot and a point in the lower plot, as depicted in yellow. See Fig. 3 for examples. Note that these figures are not to scale; true r, θ, and ϕ values are chosen so that each bin has equal volume.CC BY · PubMed Central
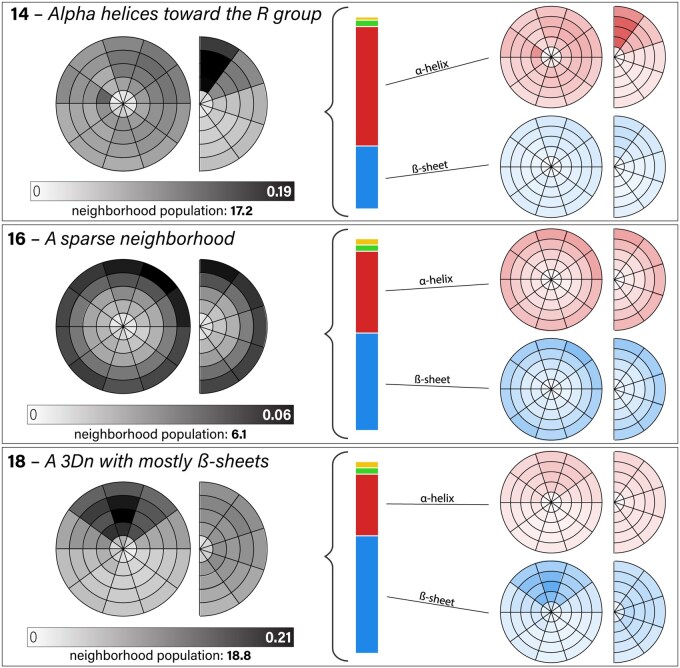
Figure 3. Visualization of 3Dn characters 14, 16, and 18. Figure 2 explains how to interpret the circle and semi-circle figures. The left figures illustrate the spatial distributions of neighbors in the landmark blurry neighborhood for the 3Dn character. The number of neighbors varies substantially across the different 3Dn states, as indicated by the given neighborhood populations. The vertical bar shows the distribution of the secondary structure of the neighbors. The top rightmost plots illustrate the distribution of the right helix neighbors, whereas the bottom rightmost plots illustrate the distribution of beta sheet neighbors. See Section 3.2.1 for a qualitative description of the three 3Dn states visualized here. The full alphabet, including left α-helix (yellow) and unclassified secondary structure (green) is depicted in Fig. 12, available as supplementary data at Bioinformatics online.
Figure 3. Visualization of 3Dn characters 14, 16, and 18. Figure 2 explains how to interpret the circle and semi-circle figures. The left figures illustrate the spatial distributions of neighbors in the landmark blurry neighborhood for the 3Dn character. The number of neighbors varies substantially across the different 3Dn states, as indicated by the given neighborhood populations. The vertical bar shows the distribution of the secondary structure of the neighbors. The top rightmost plots illustrate the distribution of the right helix neighbors, whereas the bottom rightmost plots illustrate the distribution of beta sheet neighbors. See Section 3.2.1 for a qualitative description of the three 3Dn states visualized here. The full alphabet, including left α-helix (yellow) and unclassified secondary structure (green) is depicted in Fig. 12, available as supplementary data at Bioinformatics online.CC BY · PubMed Central
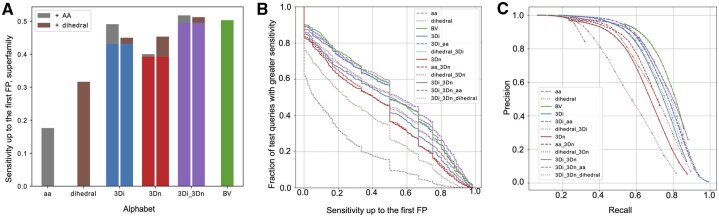
Figure 4. Superfamily search benchmark results. (A) Sensitivity up to the first false positive for AA, Dihedral, 3Di, 3Dn, 3Di-3Dn, and BV alphabets at the superfamily level. The benefit of adding amino acid information is shown in gray, and the benefit of adding dihedral information is shown in brown. (B) The fraction of queries that receive a greater sensitivity up to the first false positive than indicated in the corresponding x-axis value, at the superfamily level. Each color and line type represent a different alphabet or combination of alphabets. (C) Precision and recall of each alphabet at the superfamily level. Each color and line type represent a different alphabet or combination of alphabets.
Figure 4. Superfamily search benchmark results. (A) Sensitivity up to the first false positive for AA, Dihedral, 3Di, 3Dn, 3Di-3Dn, and BV alphabets at the superfamily level. The benefit of adding amino acid information is shown in gray, and the benefit of adding dihedral information is shown in brown. (B) The fraction of queries that receive a greater sensitivity up to the first false positive than indicated in the corresponding x-axis value, at the superfamily level. Each color and line type represent a different alphabet or combination of alphabets. (C) Precision and recall of each alphabet at the superfamily level. Each color and line type represent a different alphabet or combination of alphabets.CC BY · PubMed Central
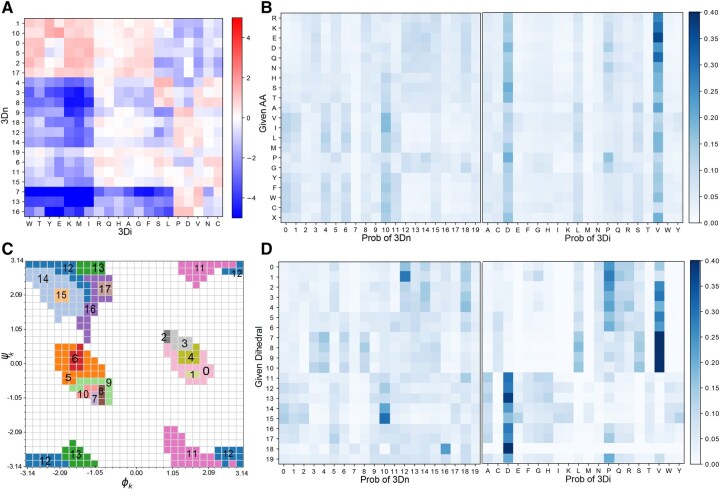
Figure 5. Co-occurance of 3Di, 3Dn, amino acid and dihedral characters. (A) A log odds matrix illustrating the co-occurance of 3Di and 3Dn characters; a positive log odds score (red) indicates the pair co-occur more than what would be expected by chance. (B) Probabilities of any given amino acid belonging to any 3Dn character or 3Di character. (C) Labels of regions corresponding to our learned dihedral characters on a Ramachandran plot. (D) Probabilities of any given dihedral character associating to any given 3Dn character or 3Di character.
Figure 5. Co-occurance of 3Di, 3Dn, amino acid and dihedral characters. (A) A log odds matrix illustrating the co-occurance of 3Di and 3Dn characters; a positive log odds score (red) indicates the pair co-occur more than what would be expected by chance. (B) Probabilities of any given amino acid belonging to any 3Dn character or 3Di character. (C) Labels of regions corresponding to our learned dihedral characters on a Ramachandran plot. (D) Probabilities of any given dihedral character associating to any given 3Dn character or 3Di character.CC BY · PubMed Central

Verification

Claims the paper makes

The claims and statistics of this paper haven’t been checked yet.

Run the check — free, no account needed. It reads the open-access text and checks the sources it cites.

A few free checks a day · papers already verified open instantly · results are public

Self-check

Percentages, sums and reported differences re-computed from the paper’s own numbers.

The self-check needs the paper’s full text.

Citations

Cites

Research works printed but not linked: 23

  1. 10.1006/jmbi.1990.9999 · DOI · Paper page
  2. 10.1088/1742-5468/2008/10/P10008 · DOI · Paper page
  3. 10.1093/nar/gky1134 · DOI
  4. 10.1093/nar/gku989 · DOI · Paper page
  5. 10.1126/science.add2187 · DOI · Paper page
  6. 10.1093/nar/gkr367 · DOI · Paper page
  7. Zhangyang Gao , Cheng Tan , and Stan Z Li . Foldtoken3: Fold structures worth 256 words or less. bioRxiv, pages 2024–07, 2024.
  8. 2024, Learning the language of protein structure, arXiv preprint
  9. 10.1093/bioinformatics/btw006 · DOI
  10. Michael Heinzinger , Konstantin Weissenow , Joaquin Gomez Sanchez , Adrian Henkel , Milot Mirdita , Martin Steinegger , and Burkhard Rost . Bilingual language model for protein sequence and structure. NAR Genomics and Bioinformatics, 6(4):qae150, 2024. · DOI · Paper page
  11. 10.1073/pnas.89.22.10915 · DOI · Paper page
  12. 10.1002/pro.3749 · DOI
  13. Liang Hong , Zhihang Hu , Siqi Sun , Xiangru Tang , Jiuming Wang , Qingxiong Tan , Liangzhen Zheng , Sheng Wang , Sheng Xu , Irwin King , et al. Fast, sensitive detection of protein homologs using deep dense retrieval. Nature Biotechnology, pages 1–13, 2024. · DOI
  14. 10.7554/eLife.91415 · DOI · Paper page
  15. 10.1038/s41467-024-46808-5 · DOI · Paper page
  16. Amy X Lu , Wilson Yan , Kevin K Yang , Vladimir Gligorijevic , Kyunghyun Cho , Pieter Abbeel , Richard Bonneau , and Nathan Frey . Tokenized and continuous embedding compressions of protein sequence and structure. bioRxiv, pages 2024–08, 2024.
  17. 10.1093/bioinformatics/btt473 · DOI · Paper page
  18. 10.1093/bioinformatics/btac724 · DOI · Paper page
  19. David Procházka , Terézia Slanináková , Jaroslav Olha , Adrián Rošinec , Katarína Grešová , Miriama Jánošová , Jakub Čillík , Jana Porubská , Radka Svobodová , Vlastislav Dohnal , et al. AlphaFind: Discover structure similarity across the entire known proteome. bioRxiv, pages 2024–02, 2024. · DOI
  20. 10.1103/PhysRevE.74.016110 · DOI · Paper page
  21. 10.1016/0022-2836(81)90087-5 · DOI
  22. 10.1038/s41587-023-01773-0 · DOI · Paper page
  23. 10.1093/nar/gki524 · DOI · Paper page

Metadata

Authors
Zerefa, S., Cool, J., Singh, P., & Petti, S.
Affiliations
  • Harvard University (US)
  • Tufts University (US)
Corresponding author
Petti, Samantha
Venue
Bioinformatics
Publisher
openRxiv
Published
2025-04-24
Volume
41
Issue
10
ISSN
1367-4803 (ISSN-L)
OpenAlex
W4413491758
Cited by
2
References
1
Citations by year
2026: 2
FWCI
0.60
Type
journal article
Language
en
Open access
Locations
  • Bioinformatics (publishedVersion, cc-by)
  • bioRxiv (Cold Spring Harbor Laboratory) (acceptedVersion, cc-by-nc-nd)
  • Europe PMC (PubMed Central) (publishedVersion, cc-by)
  • PubMed (publishedVersion)
Funders
  • National Science Foundation (1764269)
  • Burroughs Wellcome Fund
  • Wellcome Trust
  • Canadian Aeronautics and Space Institute
Topics
  • Life Sciences › Biochemistry, Genetics and Molecular Biology › Molecular Biology › Protein Structure and Dynamics
  • Life Sciences › Biochemistry, Genetics and Molecular Biology › Structural Biology › Enzyme Structure and Function
  • Life Sciences › Biochemistry, Genetics and Molecular Biology › Molecular Biology › Machine Learning in Bioinformatics
Keywords
protein structure search, structural alphabet, remote homology detection, interpretable representations, protein structure database
MeSH terms
Algorithms, Amino Acids, Protein Conformation, Proteins, Software, Computational Biology, Sequence Analysis, Protein, Databases, Protein

About these checks

Registry, retraction, Cites and statistics results are computed, not judged, with one exception: a printed reference that no index lists is read once by a model before it counts as a citation error. Claims are extracted by a model and kept only when their quote appears verbatim in the text; each cited source is then checked, with a model’s help, for whether it says what the claim relies on. Those verdicts can be wrong — read the claim’s quote and the cited source before relying on one.

Statistics and arithmetic are recomputed, not judged.

Confidence bands are shown only for fields calibrated on our annotated test set. None is calibrated yet, so no band is shown.

What counts as a claim ›How we measure confidence ›How we check this ›

Are you an author, or do you see a problem with this page? Request a review