PreprintCited by 10Protein Structure and DynamicsRNA and protein synthesis mechanismsChemical Synthesis and Analysis

The DOI matches its Crossref record; its reference list is not available.

Designing Novel Solenoid Proteins with In Silico Evolution

Open access

Preprint — published as 10.1038/s42004-025-01817-3

Abstract

Solenoid proteins are elongated tandem repeat proteins with diverse biological functions, making them attractive targets for protein design. Advances in machine learning have transformed our understanding of sequence-structure relationships, enabling new approaches for de novo protein design. Here, we present an in silico evolution platform that couples a solenoid discriminator network with AlphaFold2 as an oracle within a genetic algorithm. Starting from random sequences, we design α-, β-, and αβ-solenoid backbones, generating structures that span natural and novel solenoid space. We experimentally characterise 41 solenoid designs, with α-solenoids consistently folding as intended, including one structurally validated design that closely matches the design model. All β-solenoids initially failed, reflecting the difficulty of designing β-strand majority proteins. By introducing terminal capping elements and refining designs based on earlier experimental screens, we generate two β-solenoids that have biophysical properties consistent with their designs. Our approach achieves fold-specific hallucination-based design without depending on explicit structural templates.

Overview

The claims and statistics of this paper haven’t been checked yet.

Run the check — free, no account needed. It reads the open-access text and checks the sources it cites.

A few free checks a day · papers already verified open instantly · results are public

Integrity signals

Registry

Crossref · 10.1101/2025.04.23.646631

Cites

Statistics

Figures

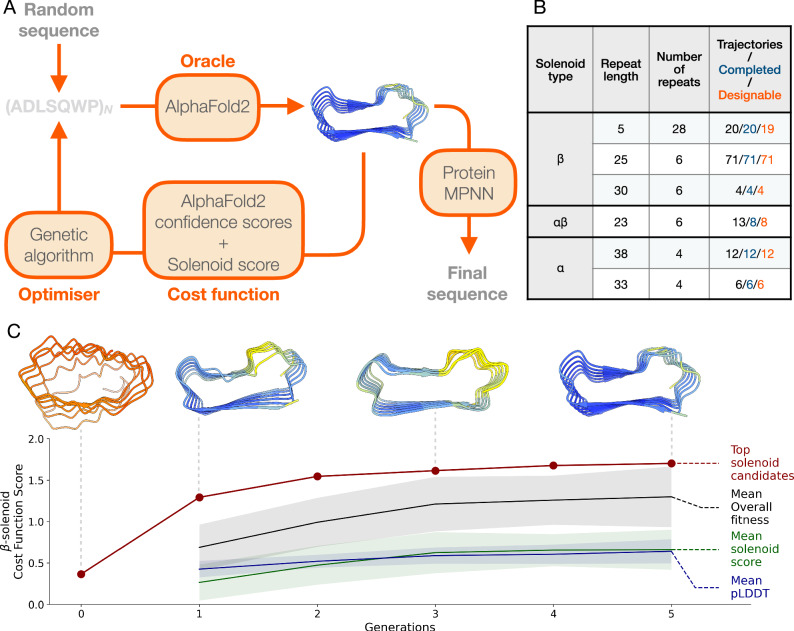
Fig. 1 In silico evolution platform for solenoid protein generation. A The input repeat sequence of length L is repeated N times to make the full NxL sequence, whose structure is then predictedWi with AF2. The resulting design is scored with a cost function that combines AF2 pLDDT, as well as a solenoid-type probability score. The sequence pool is updated using a genetic algorithm. This continues until a set threshold for the cost function is met, and the output protein structure is taken forward. The sequence is redesigned using ProteinMPNN for successful backbones obtained through the in silico evolution platform. B Outcomes of different solenoid category and repeat lengths for solenoids generated with the in silico evolution platform. C Example of trajectory for β-solenoid from an initial random sequence to final solenoid design. Generation 0 is the initial random starting sequence. The cost function value of the best candidate (red) is shown for each generation. The mean fitness (black), pLDDT (blue) and solenoid score (green) for each generation is shown. 1 standard deviation around the mean is shown by the shaded regions. Top candidate structures colored by pLDDT score (blue: 90–100, cyan: 70–90, yellow: 50–70, orange 0–50) are shown for generations 0, 1, 3, and 5.
Fig. 1 In silico evolution platform for solenoid protein generation. A The input repeat sequence of length L is repeated N times to make the full NxL sequence, whose structure is then predictedWi with AF2. The resulting design is scored with a cost function that combines AF2 pLDDT, as well as a solenoid-type probability score. The sequence pool is updated using a genetic algorithm. This continues until a set threshold for the cost function is met, and the output protein structure is taken forward. The sequence is redesigned using ProteinMPNN for successful backbones obtained through the in silico evolution platform. B Outcomes of different solenoid category and repeat lengths for solenoids generated with the in silico evolution platform. C Example of trajectory for β-solenoid from an initial random sequence to final solenoid design. Generation 0 is the initial random starting sequence. The cost function value of the best candidate (red) is shown for each generation. The mean fitness (black), pLDDT (blue) and solenoid score (green) for each generation is shown. 1 standard deviation around the mean is shown by the shaded regions. Top candidate structures colored by pLDDT score (blue: 90–100, cyan: 70–90, yellow: 50–70, orange 0–50) are shown for generations 0, 1, 3, and 5.CC BY · PubMed Central
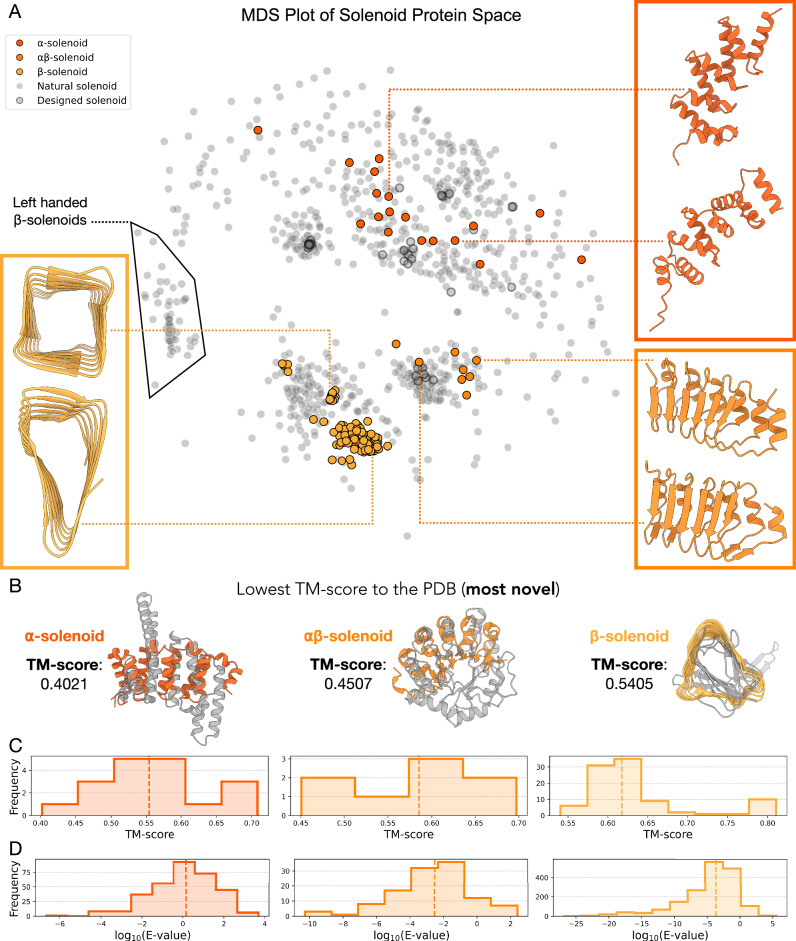
Fig. 2 Designed solenoid protein novelty and diversity. A Natural and novel solenoid protein representation space structural similarity quantified by MDS of solenoid pairwise structural similarities. The solenoids produced by the in silico evolution loop are seen in color. Natural solenoid proteins are in grey and previous designed proteins in the PDB are grey with a black outline. Left-handed β-solenoids are outlined. B For each solenoid design, we identified the most similar structure in the PDB. Shown here are the least similar of these best matches, the alignments with the lowest TM-scores, for each solenoid type. These represent the most structurally novel designs. The lowest best-match TM-scores were: α-solenoids, 0.40 (PDB:2O8P); αβ-solenoids, 0.45 (PDB:4I6K); β-solenoids, 0.54 (PDB:1K8F). C Histograms showing the TM-score of the most similar structure in the PDB to the solenoid backbone designs for α-solenoids, αβ-solenoids and β-solenoids. Median TM-scores (dotted line) for the α-, αβ- and β-solenoids are 0.55, 0.59 and 0.62, respectively. D Histograms showing the E-value distribution for the closest hit in the non-redundant database for ProteinMPNN re-designed sequences, based on backbones generated from the in silico evolution loop for α-solenoids, αβ-solenoids, and β-solenoids. Only sequences with an RMSD < 5 Å compared to the original backbone after AF2 prediction, and a pLDDT >80, are included. The median E-values (dotted line) for the α-, αβ-, and β-solenoids are 1.44, 2.92 × 10⁻³, and 2.13 × 10⁻⁴, respectively.
Fig. 2 Designed solenoid protein novelty and diversity. A Natural and novel solenoid protein representation space structural similarity quantified by MDS of solenoid pairwise structural similarities. The solenoids produced by the in silico evolution loop are seen in color. Natural solenoid proteins are in grey and previous designed proteins in the PDB are grey with a black outline. Left-handed β-solenoids are outlined. B For each solenoid design, we identified the most similar structure in the PDB. Shown here are the least similar of these best matches, the alignments with the lowest TM-scores, for each solenoid type. These represent the most structurally novel designs. The lowest best-match TM-scores were: α-solenoids, 0.40 (PDB:2O8P); αβ-solenoids, 0.45 (PDB:4I6K); β-solenoids, 0.54 (PDB:1K8F). C Histograms showing the TM-score of the most similar structure in the PDB to the solenoid backbone designs for α-solenoids, αβ-solenoids and β-solenoids. Median TM-scores (dotted line) for the α-, αβ- and β-solenoids are 0.55, 0.59 and 0.62, respectively. D Histograms showing the E-value distribution for the closest hit in the non-redundant database for ProteinMPNN re-designed sequences, based on backbones generated from the in silico evolution loop for α-solenoids, αβ-solenoids, and β-solenoids. Only sequences with an RMSD < 5 Å compared to the original backbone after AF2 prediction, and a pLDDT >80, are included. The median E-values (dotted line) for the α-, αβ-, and β-solenoids are 1.44, 2.92 × 10⁻³, and 2.13 × 10⁻⁴, respectively.CC BY · PubMed Central
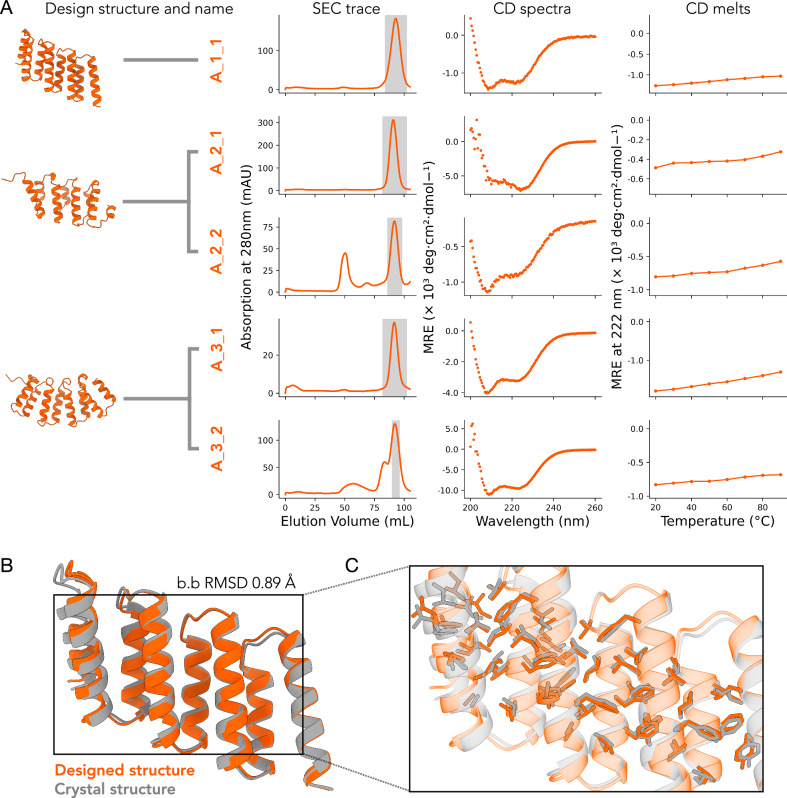
Fig. 3 Experimental characterisation of designed solenoid proteins. A First panel, predicted structure and name of the design. Multiple designs with different sequences but the same protein backbone are grouped under the same backbone structure. Second panel, SEC chromatogram. The highlighted region indicates the fractions pooled to continue for further structural characterisation. Third panel, CD spectra taken at 20 °C. Fourth panel, 222 nm CD thermal scan from 20 °C to 90 °C. B Superposed designed model (orange) and crystal structure (grey) of design A_1_1. C Detail overlay of the crystal structure (grey) and designed model (orange) with selected hydrophobic core side chains shown as sticks.
Fig. 3 Experimental characterisation of designed solenoid proteins. A First panel, predicted structure and name of the design. Multiple designs with different sequences but the same protein backbone are grouped under the same backbone structure. Second panel, SEC chromatogram. The highlighted region indicates the fractions pooled to continue for further structural characterisation. Third panel, CD spectra taken at 20 °C. Fourth panel, 222 nm CD thermal scan from 20 °C to 90 °C. B Superposed designed model (orange) and crystal structure (grey) of design A_1_1. C Detail overlay of the crystal structure (grey) and designed model (orange) with selected hydrophobic core side chains shown as sticks.CC BY · PubMed Central
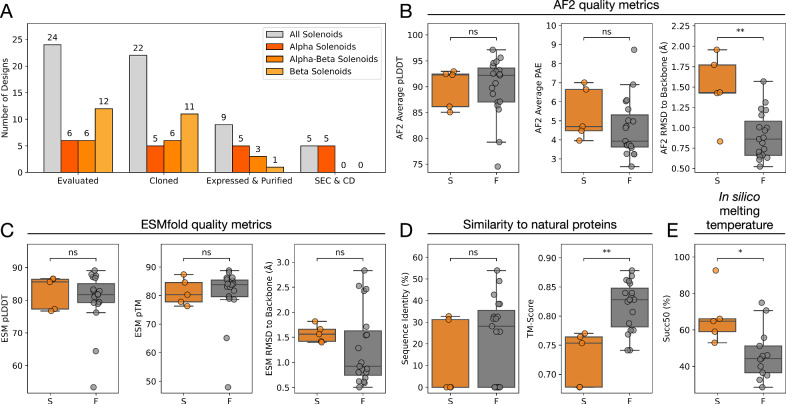
Fig. 4 Comparing in silico metrics with experimental outcomes for solenoid designs from the in silico evolution platform. A bar chart showing the outcomes of the experimental characterisation of in silico platform solenoid designs. This is shown by how many designs were evaluated, cloned into a backbone vector, had a purification product at the expected molecular weight after Ni-NTA purification and if there is an expected SEC and CD spectra trace. B–E Metrics are comparing experimental success (S) versus failure (F) in designs, defined by the presence of an expected SEC peak and a matching CD trace for secondary structure. The five successful designs include A_1_1, A_2_1, A_2_2, A_3_1 and A_3_2; the remaining 19 designs are classified as failures. B AF2 quality metrics: Box plots for average pLDDT (left, not significant), average PAE (middle, not significant), and RMSD to the original backbone design post-sequence redesign (right, significant with P-value 0.0093). C ESMFold quality metrics: Box plots for pLDDT (left, not significant), pTM (middle, not significant), and RMSD to the original backbone design post-sequence redesign (right, not significant). D Similarity to natural proteins: Sequence identity with the top hit in the nr database (left, not significant) and TM alignment score to the closest PDB match (right, significant with P-value 0.0044). E Box plots of the sigmoidal inflection point values (representing ‘melting temperatures’) of the ‘melting curves’ (significant with P-value 0.019). Statistical significance was determined using the Mann-Whitney U test.
Fig. 4 Comparing in silico metrics with experimental outcomes for solenoid designs from the in silico evolution platform. A bar chart showing the outcomes of the experimental characterisation of in silico platform solenoid designs. This is shown by how many designs were evaluated, cloned into a backbone vector, had a purification product at the expected molecular weight after Ni-NTA purification and if there is an expected SEC and CD spectra trace. B–E Metrics are comparing experimental success (S) versus failure (F) in designs, defined by the presence of an expected SEC peak and a matching CD trace for secondary structure. The five successful designs include A_1_1, A_2_1, A_2_2, A_3_1 and A_3_2; the remaining 19 designs are classified as failures. B AF2 quality metrics: Box plots for average pLDDT (left, not significant), average PAE (middle, not significant), and RMSD to the original backbone design post-sequence redesign (right, significant with P-value 0.0093). C ESMFold quality metrics: Box plots for pLDDT (left, not significant), pTM (middle, not significant), and RMSD to the original backbone design post-sequence redesign (right, not significant). D Similarity to natural proteins: Sequence identity with the top hit in the nr database (left, not significant) and TM alignment score to the closest PDB match (right, significant with P-value 0.0044). E Box plots of the sigmoidal inflection point values (representing ‘melting temperatures’) of the ‘melting curves’ (significant with P-value 0.019). Statistical significance was determined using the Mann-Whitney U test.CC BY · PubMed Central
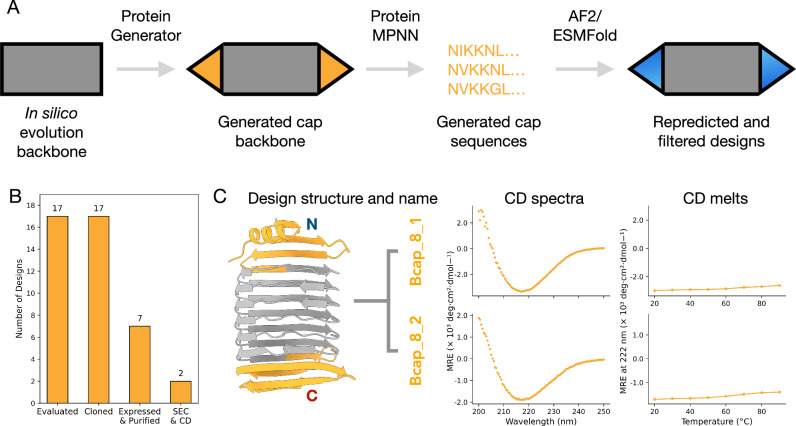
Fig. 5 Design and experimental characterisation of capped β-solenoids. A Pipeline to design capping regions for β-solenoids. B Outcomes of the experimental characterisation of capped β-solenoid designs. This is shown by how many designs were evaluated, cloned into a backbone vector, had a purification product at the expected molecular weight after Ni-NTA purification and if there is an expected CD spectra trace. C First panel, predicted structure and name of the design characterised. β-solenoid region in grey and capping region in yellow. Second panel, CD spectra taken at 20 °C. Third panel, CD (222 nm) thermal scan from 20 °C to 90 °C.
Fig. 5 Design and experimental characterisation of capped β-solenoids. A Pipeline to design capping regions for β-solenoids. B Outcomes of the experimental characterisation of capped β-solenoid designs. This is shown by how many designs were evaluated, cloned into a backbone vector, had a purification product at the expected molecular weight after Ni-NTA purification and if there is an expected CD spectra trace. C First panel, predicted structure and name of the design characterised. β-solenoid region in grey and capping region in yellow. Second panel, CD spectra taken at 20 °C. Third panel, CD (222 nm) thermal scan from 20 °C to 90 °C.CC BY · PubMed Central

Verification

Claims the paper makes

The claims and statistics of this paper haven’t been checked yet.

Run the check — free, no account needed. It reads the open-access text and checks the sources it cites.

A few free checks a day · papers already verified open instantly · results are public

Self-check

Percentages, sums and reported differences re-computed from the paper’s own numbers.

The self-check needs the paper’s full text.

Citations

No citation lists for this paper

No citation lists for this paper yet — checked again daily.

References 66 · Cited by 10

Research works printed but not linked: 65

  1. 10.1002/(SICI)1097-0134(19990601)35:4<440::AID-PROT7>3.0.CO;2-Y · DOI
  2. 10.1038/35018604 · DOI
  3. 10.1126/science.1216211 · DOI
  4. 10.1038/s41586-023-05909-9 · DOI
  5. 10.1038/s41586-024-07188-4 · DOI
  6. Hsia, Y. , et al., Design of multi-scale protein complexes by hierarchical building block fusion. Nature Communications, 2021. 12(1). · DOI
  7. 10.1038/nature16162 · DOI
  8. 10.1038/nsmb.2938 · DOI
  9. 10.1073/pnas.1908768117 · DOI
  10. 10.1126/science.abj8754 · DOI · Paper page
  11. 10.1073/pnas.1914677117 · DOI · Paper page
  12. 10.1038/s41586-023-06415-8 · DOI · Paper page
  13. 10.1038/s41586-021-04184-w · DOI · Paper page
  14. 10.1126/science.abn2100 · DOI · Paper page
  15. 10.1126/science.add1964 · DOI · Paper page
  16. 10.1038/s41586-023-05696-3 · DOI
  17. 10.1126/science.adq1741 · DOI
  18. Pacesa, M. , et al., BindCraft: one-shot design of functional protein binders. bioRxiv, 2024: p. 2024.09.30.615802. · DOI
  19. Zorine, D. and D. Baker , De novo design of alpha-beta repeat proteins. bioRxiv, 2024: p. 2024.06.15.590358. · DOI
  20. 2022, Protein Structure and Sequence Generation with Equivariant Denoising Diffusion Probabilistic Models, arXiv preprint
  21. 10.1038/s43588-023-00440-3 · DOI · Paper page
  22. Nikov, G. , D. Pretorius , and J.W. Murray , SOLeNNoID: A Deep Learning Pipeline For Solenoid Residue Detection in Protein Structures. bioRxiv, 2024: p. 2024.07.22.604558. · DOI
  23. 10.1038/s41586-018-0509-0 · DOI · Paper page
  24. 10.1038/s41594-018-0141-6 · DOI
  25. 10.1126/science.abc8182 · DOI
  26. 2023, AF2-mutation: adversarial sequence mutations against AlphaFold2 on protein tertiary structure prediction, arXiv preprint
  27. 10.1002/pro.5189 · DOI
  28. 10.1016/S0065-3233(06)73003-0 · DOI · Paper page
  29. 10.1016/j.csbj.2025.01.016 · DOI · Paper page
  30. 10.1038/s41587-023-01773-0 · DOI · Paper page
  31. 10.1093/nar/gki524 · DOI · Paper page
  32. 10.1038/nbt.3988 · DOI · Paper page
  33. 2023, Database resources of the National Center for Biotechnology Information, Nucleic Acids Research, 52, D33
  34. 10.1006/jmbi.1990.9999 · DOI · Paper page
  35. 10.1002/prot.22458 · DOI
  36. 10.1016/j.celrep.2022.111902 · DOI
  37. 10.1111/j.1365-313X.2011.04657.x · DOI
  38. 10.1073/pnas.052706099 · DOI · Paper page
  39. 10.1038/s41467-023-38328-5 · DOI · Paper page
  40. 10.1002/pro.5033 · DOI
  41. 10.1073/pnas.1525308113 · DOI
  42. 10.1126/science.1110699 · DOI
  43. 10.1016/j.jsb.2008.09.010 · DOI
  44. Lisanza, S.L. , et al., Multistate and functional protein design using RoseTTAFold sequence space diffusion. Nature Biotechnology, 2024. · DOI
  45. Moffat, L. , J.G. Greener , and D.T. Jones , Using AlphaFold for Rapid and Accurate Fixed Backbone Protein Design. 2021, Cold Spring Harbor Laboratory. · DOI · Paper page
  46. 2020, AdaLead: A simple and robust adaptive greedy search algorithm for sequence design
  47. Mirdita, M. , et al., ColabFold: making protein folding accessible to all. Nature Methods, 2022. · DOI · Paper page
  48. 10.1074/jbc.M204982200 · DOI
  49. 10.1016/S0065-3233(06)73003-0 · DOI · Paper page
  50. 10.1371/journal.pcbi.1012526 · DOI
  51. 10.1126/science.add2187 · DOI · Paper page
  52. 10.1126/science.ade2574 · DOI · Paper page
  53. 10.1093/nar/gkt1175 · DOI
  54. 10.1093/bioinformatics/btl158 · DOI
  55. Chronowska, M. , et al., The Protein Design Archive (PDA): insights from 40 years of protein design. Nature Biotechnology, 2025. · DOI
  56. 2011, Scikit-learn: Machine learning in Python, the Journal of machine Learning research, 12, 2825
  57. 10.1093/bioinformatics/btaa558 · DOI
  58. 2008, KRX Autoinduction Protocol A Convenient Method for Protein Expression, Promega Notes, 98, 16
  59. 10.1107/S0021889807021206 · DOI · Paper page
  60. 10.1107/S0907444904019158 · DOI · Paper page
  61. 10.1107/S0907444909052925 · DOI · Paper page
  62. 10.1002/pro.3330 · DOI · Paper page
  63. 10.1107/S0021889809045701 · DOI
  64. 2020, Scaling diffraction data in the DIALS software package: algorithms and new approaches for multi-crystal scaling, Biological Crystallography, 76, 385
  65. 10.1107/S0021889897006766 · DOI

Metadata

Authors
Pretorius, D., Nikov, G. I., Washio, K., Florent, S.-W., Taunt, H. N., Ovchinnikov, S., & Murray, J. W.
Affiliations
  • Imperial College London (GB)
  • Massachusetts Institute of Technology (US)
Corresponding author
Murray, James W.
Venue
Communications Chemistry
Publisher
openRxiv
Published
2025-04-24
Volume
9
Issue
1
Pages
10-10
ISSN
2399-3669 (ISSN-L)
OpenAlex
W4416976319
Cited by
10
References
66
Citations by year
2026: 7 · 2025: 3
FWCI
3.01
Type
journal article
Language
en
Open access
Locations
  • Communications Chemistry (publishedVersion, cc-by)
  • bioRxiv (Cold Spring Harbor Laboratory) (acceptedVersion, cc-by)
  • PubMed (publishedVersion)
  • PubMed Central (publishedVersion, cc-by)
  • DOAJ (DOAJ: Directory of Open Access Journals) (submittedVersion, cc-by-sa)
  • Spiral (Imperial College London) (submittedVersion, cc-by)
Funders
  • Research Councils UK (EP/R513052/1, EP/S022856/1)
  • Engineering and Physical Sciences Research Council (EP/R513052/1, EP/S022856/1)
Topics
  • Life Sciences › Biochemistry, Genetics and Molecular Biology › Molecular Biology › Protein Structure and Dynamics
  • Life Sciences › Biochemistry, Genetics and Molecular Biology › Molecular Biology › RNA and protein synthesis mechanisms
  • Physical Sciences › Chemistry › Organic Chemistry › Chemical Synthesis and Analysis
Keywords
de novo protein design, in silico evolution, genetic algorithm, AlphaFold2, tandem repeat proteins, sequence-structure relationship

About these checks

Registry, retraction, Cites and statistics results are computed, not judged, with one exception: a printed reference that no index lists is read once by a model before it counts as a citation error. Claims are extracted by a model and kept only when their quote appears verbatim in the text; each cited source is then checked, with a model’s help, for whether it says what the claim relies on. Those verdicts can be wrong — read the claim’s quote and the cited source before relying on one.

Statistics and arithmetic are recomputed, not judged.

Confidence bands are shown only for fields calibrated on our annotated test set. None is calibrated yet, so no band is shown.

What counts as a claim ›How we measure confidence ›How we check this ›

Are you an author, or do you see a problem with this page? Request a review

How to cite

Cite CoChat for the checks on this page, and the paper for its own findings.

This page
CoChat. (2026). Citation check: Designing Novel Solenoid Proteins with In Silico Evolution. https://app.cochat.ai/papers/10.1101/2025.04.23.646631
The paper
Pretorius, D., Nikov, G. I., Washio, K., Florent, S.-W., Taunt, H. N., Ovchinnikov, S., & Murray, J. W. (2025). Designing Novel Solenoid Proteins with In Silico Evolution. Communications Chemistry. https://doi.org/10.1101/2025.04.23.646631