PreprintCited by 450Genomics and Chromatin DynamicsGenetic Associations and EpidemiologyGenomics and Rare Diseases

The DOI matches its Crossref record; 109 of the 110 references it cites were found in a registry or an index.

AlphaGenome: advancing regulatory variant effect prediction with a unified DNA sequence model

Open access

Preprint — published as 10.1038/s41586-025-10014-0 · Paper page

Abstract

Deep learning models that predict functional genomic measurements from DNA sequence are powerful tools for deciphering the genetic regulatory code. Existing methods trade off between input sequence length and prediction resolution, thereby limiting their modality scope and performance. We present AlphaGenome, which takes as input 1 megabase of DNA sequence and predicts thousands of functional genomic tracks up to single base pair resolution across diverse modalities – including gene expression, transcription initiation, chromatin accessibility, histone modifications, transcription factor binding, chro- matin contact maps, splice site usage, and splice junction coordinates and strength. Trained on human and mouse genomes, AlphaGenome matches or exceeds the strongest respective available external models on 24 out of 26 evaluations on variant effect prediction. AlphaGenome’s ability to simultaneously score variant effects across all modalities accurately recapitulates the mechanisms of clinically-relevant variants near the TAL1 oncogene. To facilitate broader use, we provide tools for making genome track and variant effect predictions from sequence.

Overview

The claims and statistics of this paper haven’t been checked yet.

Run the check — free, no account needed. It reads the open-access text and checks the sources it cites.

A few free checks a day · papers already verified open instantly · results are public

Integrity signals

Registry

Crossref · 10.1101/2025.06.25.661532

Cites

109 of 109 references verified0 citation errors · 0 not checkable

Statistics

Figures

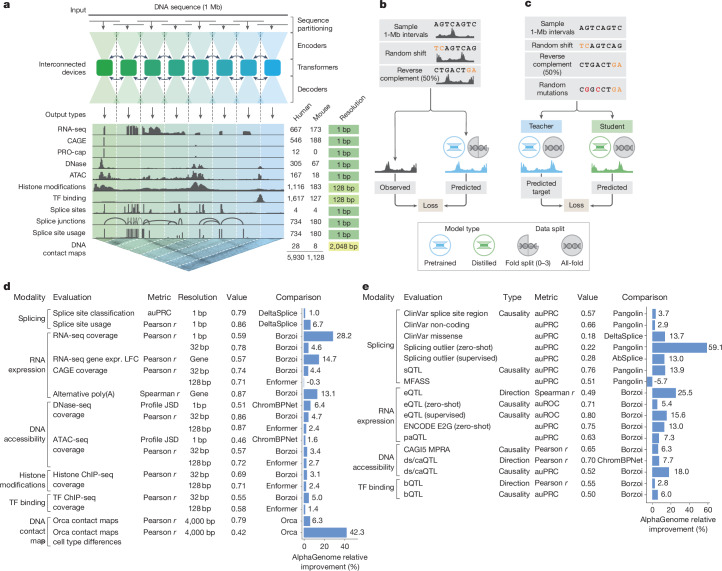
Fig. 1 AlphaGenome model architecture, training regimes and comprehensive evaluation performance. a, Model overview. AlphaGenome processes 1 Mb of DNA sequences and species identity (human/mouse) to predict 5,930 human or 1,128 mouse genome tracks across diverse cell types and 11 output types at specific resolutions (far right). Computation leverages sequence parallelism, breaking the 1 Mb of DNA sequence into 131-kb chunks processed across devices. The core architecture features a U-Net-style design comprising an encoder (downsampling the sequence), transformers with inter-device communication and a decoder (upsampling), which feed into task-specific output heads at their respective resolutions (detailed in Extended Data Fig. 1). b, The pretraining process, in which 1-Mb DNA intervals are sampled from cross-validation folds, augmented (shifted and reverse complemented) and used to train the model against experimental targets, yields fold-specific and all-fold teacher models. c, The distillation process, in which a student model learns to reproduce predictions from frozen all-fold teacher models using augmented and mutationally perturbed input sequences, yields a single model suitable for variant effect prediction. d, Track prediction: pretrained fold-split model. Relative performance improvement (%) of AlphaGenome over the best competing model for a selection of genome track prediction tasks across modalities and resolutions (Supplementary Table 3). The ‘value’ column represents the absolute performance of AlphaGenome. For all tasks shown, a value of 1.0 indicates perfect performance, with the exception of ‘profile JSD’, for which the ideal value is 0. Both competing models and AlphaGenome pretrained fold-split models were evaluated on held-out genome regions unseen during model training. For classification tasks, we adjusted the relative improvement to account for the performance of a random classifier (Methods). e, Variant effect prediction: distilled all-fold model. Relative performance improvement of AlphaGenome over the best competing model for a subset of variant effect prediction tasks (Supplementary Table 4). The distilled student AlphaGenome model is used for these evaluations. The ds/caQTL direction (causality) rows represent the average relative improvement across several similar datasets (Methods). ds, DNase sensitivity; ca, chromatin accessibility; JSD, Jensen–Shannon divergence.
Fig. 1 AlphaGenome model architecture, training regimes and comprehensive evaluation performance. a, Model overview. AlphaGenome processes 1 Mb of DNA sequences and species identity (human/mouse) to predict 5,930 human or 1,128 mouse genome tracks across diverse cell types and 11 output types at specific resolutions (far right). Computation leverages sequence parallelism, breaking the 1 Mb of DNA sequence into 131-kb chunks processed across devices. The core architecture features a U-Net-style design comprising an encoder (downsampling the sequence), transformers with inter-device communication and a decoder (upsampling), which feed into task-specific output heads at their respective resolutions (detailed in Extended Data Fig. 1). b, The pretraining process, in which 1-Mb DNA intervals are sampled from cross-validation folds, augmented (shifted and reverse complemented) and used to train the model against experimental targets, yields fold-specific and all-fold teacher models. c, The distillation process, in which a student model learns to reproduce predictions from frozen all-fold teacher models using augmented and mutationally perturbed input sequences, yields a single model suitable for variant effect prediction. d, Track prediction: pretrained fold-split model. Relative performance improvement (%) of AlphaGenome over the best competing model for a selection of genome track prediction tasks across modalities and resolutions (Supplementary Table 3). The ‘value’ column represents the absolute performance of AlphaGenome. For all tasks shown, a value of 1.0 indicates perfect performance, with the exception of ‘profile JSD’, for which the ideal value is 0. Both competing models and AlphaGenome pretrained fold-split models were evaluated on held-out genome regions unseen during model training. For classification tasks, we adjusted the relative improvement to account for the performance of a random classifier (Methods). e, Variant effect prediction: distilled all-fold model. Relative performance improvement of AlphaGenome over the best competing model for a subset of variant effect prediction tasks (Supplementary Table 4). The distilled student AlphaGenome model is used for these evaluations. The ds/caQTL direction (causality) rows represent the average relative improvement across several similar datasets (Methods). ds, DNase sensitivity; ca, chromatin accessibility; JSD, Jensen–Shannon divergence.CC BY · PubMed Central
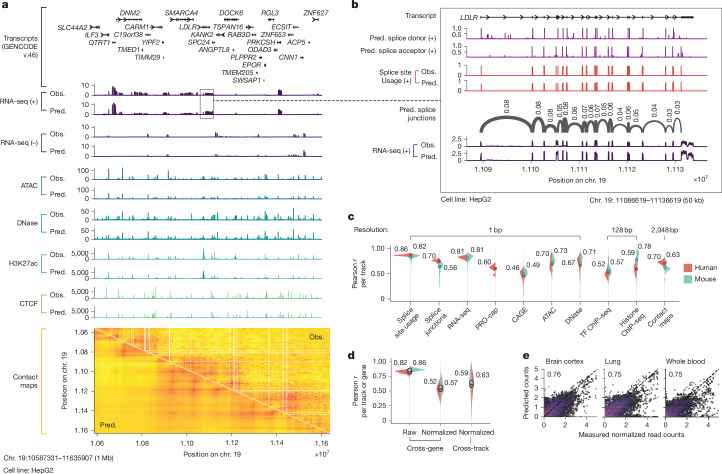
Fig. 2 Example of AlphaGenome track predictions and detailed performance evaluations. a, Observed and AlphaGenome-predicted genome tracks within a 1-Mb held-out region of human chr. 19 (0-based coordinates: 10587331–11635907) in the HepG2 cell line. The y-axis scales for each assay are defined in the Methods section. Strand-specific tracks are denoted as positive (+) or negative (−), whereas strand-agnostic tracks are shown without a strand symbol. Contact maps are pairwise interaction matrices; therefore, both x and y axes display genome coordinate positions. RNA-seq, ATAC-seq and DNase-seq track predictions are at 1-bp resolution; H3K27ac and CTCF ChIP-seq are at 128-bp resolution; and contact maps are at 2,048-bp resolution. b, Example predictions with splicing. Base-pair-resolution AlphaGenome predictions for a 50-kb region highlighting detailed splicing (donor/acceptor sites, splice site usage and splice junctions) and RNA-seq predictions around the LDLR gene. c, Track prediction performance evaluation across different modalities. Violin plots display the distribution of Pearson correlations between predicted and observed tracks evaluated on held-out test intervals. Each violin plot is grouped by modality and split by organism (human in red; mouse in blue). Filled circles with accompanying numerical values indicate the mean Pearson r per assay group and organism. Splice junction, RNA-seq, PRO-cap, CAGE and ChIP-seq tracks were log(1 + x) transformed, whereas the remainder were untransformed. d, Evaluation of RNA-seq gene log-expression prediction on held-out test intervals. The leftmost panel assesses the Pearson correlation between predicted and observed log-expression values across all genes within individual tracks. The middle and rightmost panels evaluate the prediction of tissue or cell-type specificity using quantile-normalized expression values (detailed in Methods); correlations are computed either across genes per track (middle) or across tracks per gene (right). e, Splice junction count prediction. Predicted versus observed splice junction read counts (log(1 + x) transformed; n = 1,344,738) and Pearson r between them in selected human tissues known for having distinct splicing patterns49. Each hexagonal bin is coloured by the density of the data points in that bin, with warmer colours corresponding to higher density. The diagonal dotted line indicates perfect agreement (predicted = observed). More tissues are shown in Extended Data Fig. 2d. Obs., observed; Pred., predicted.
Fig. 2 Example of AlphaGenome track predictions and detailed performance evaluations. a, Observed and AlphaGenome-predicted genome tracks within a 1-Mb held-out region of human chr. 19 (0-based coordinates: 10587331–11635907) in the HepG2 cell line. The y-axis scales for each assay are defined in the Methods section. Strand-specific tracks are denoted as positive (+) or negative (−), whereas strand-agnostic tracks are shown without a strand symbol. Contact maps are pairwise interaction matrices; therefore, both x and y axes display genome coordinate positions. RNA-seq, ATAC-seq and DNase-seq track predictions are at 1-bp resolution; H3K27ac and CTCF ChIP-seq are at 128-bp resolution; and contact maps are at 2,048-bp resolution. b, Example predictions with splicing. Base-pair-resolution AlphaGenome predictions for a 50-kb region highlighting detailed splicing (donor/acceptor sites, splice site usage and splice junctions) and RNA-seq predictions around the LDLR gene. c, Track prediction performance evaluation across different modalities. Violin plots display the distribution of Pearson correlations between predicted and observed tracks evaluated on held-out test intervals. Each violin plot is grouped by modality and split by organism (human in red; mouse in blue). Filled circles with accompanying numerical values indicate the mean Pearson r per assay group and organism. Splice junction, RNA-seq, PRO-cap, CAGE and ChIP-seq tracks were log(1 + x) transformed, whereas the remainder were untransformed. d, Evaluation of RNA-seq gene log-expression prediction on held-out test intervals. The leftmost panel assesses the Pearson correlation between predicted and observed log-expression values across all genes within individual tracks. The middle and rightmost panels evaluate the prediction of tissue or cell-type specificity using quantile-normalized expression values (detailed in Methods); correlations are computed either across genes per track (middle) or across tracks per gene (right). e, Splice junction count prediction. Predicted versus observed splice junction read counts (log(1 + x) transformed; n = 1,344,738) and Pearson r between them in selected human tissues known for having distinct splicing patterns49. Each hexagonal bin is coloured by the density of the data points in that bin, with warmer colours corresponding to higher density. The diagonal dotted line indicates perfect agreement (predicted = observed). More tissues are shown in Extended Data Fig. 2d. Obs., observed; Pred., predicted.CC BY · PubMed Central
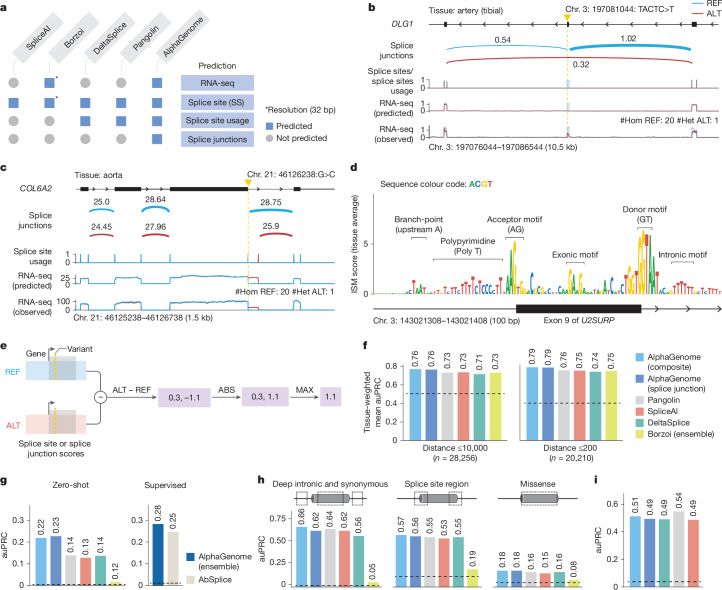
Fig. 3 AlphaGenome is a SOTA splicing variant effect prediction model. a, Comparison of prediction outputs across deep learning models. All models predict at 1-bp resolution, except Borzoi (32 bp). Borzoi predicts splice sites implicitly through RNA-seq coverage, whereas others produce explicit predictions. b, Variant causing exon skipping in DLG1 (GTEx artery tibial tissue). Predicted splice junction, site usage and RNA-seq coverage are shown alongside observed coverage for reference (REF; blue) and alternative (ALT; red) alleles. c, New splice junction variant in COL6A2 (aorta), creating a new splicing donor and disrupting the extant one. d, ISM of U2SURP exon 9 and flanking introns using the mean splice junction score across tissues. Splicing-related motifs are highlighted. e, Schema of splice variant effect prediction with AlphaGenome. The maximum difference between REF and ALT predictions across splice sites or splice junctions is used to score variants (Methods). f, Comparison of AlphaGenome composite and splice junction scorers versus other methods for classifying fine-mapped sQTL variants. Variants are stratified into two groups by distance to the splice site, as done in Borzoi2. Tissue-specific auPRCs were averaged and weighted by variant count per tissue. g, Prediction of rare variants associated with splicing outliers. AlphaGenome was evaluated in both zero-shot and supervised settings (training an ensemble model similar to AbSplice50). h, Classifying pathogenic versus benign ClinVar variants on the basis of splicing effects for deep intronic (more than 6 bp from splice sites) and synonymous (more than 3 bp from splice sites) variants, variants in the splice site region (within 6 bp intronic or 3 bp exonic) and missense variants predicted as ‘likely_benign’ by AlphaMissense51. i, MFASS splicing variant classification (MPRA-tested variants). auPRC on the classification of experimentally validated splice-disrupting variants (data from Chong et al.22). #Hom/#Het, number of homozygous/heterozygous samples in GTEx.
Fig. 3 AlphaGenome is a SOTA splicing variant effect prediction model. a, Comparison of prediction outputs across deep learning models. All models predict at 1-bp resolution, except Borzoi (32 bp). Borzoi predicts splice sites implicitly through RNA-seq coverage, whereas others produce explicit predictions. b, Variant causing exon skipping in DLG1 (GTEx artery tibial tissue). Predicted splice junction, site usage and RNA-seq coverage are shown alongside observed coverage for reference (REF; blue) and alternative (ALT; red) alleles. c, New splice junction variant in COL6A2 (aorta), creating a new splicing donor and disrupting the extant one. d, ISM of U2SURP exon 9 and flanking introns using the mean splice junction score across tissues. Splicing-related motifs are highlighted. e, Schema of splice variant effect prediction with AlphaGenome. The maximum difference between REF and ALT predictions across splice sites or splice junctions is used to score variants (Methods). f, Comparison of AlphaGenome composite and splice junction scorers versus other methods for classifying fine-mapped sQTL variants. Variants are stratified into two groups by distance to the splice site, as done in Borzoi2. Tissue-specific auPRCs were averaged and weighted by variant count per tissue. g, Prediction of rare variants associated with splicing outliers. AlphaGenome was evaluated in both zero-shot and supervised settings (training an ensemble model similar to AbSplice50). h, Classifying pathogenic versus benign ClinVar variants on the basis of splicing effects for deep intronic (more than 6 bp from splice sites) and synonymous (more than 3 bp from splice sites) variants, variants in the splice site region (within 6 bp intronic or 3 bp exonic) and missense variants predicted as ‘likely_benign’ by AlphaMissense51. i, MFASS splicing variant classification (MPRA-tested variants). auPRC on the classification of experimentally validated splice-disrupting variants (data from Chong et al.22). #Hom/#Het, number of homozygous/heterozygous samples in GTEx.CC BY · PubMed Central
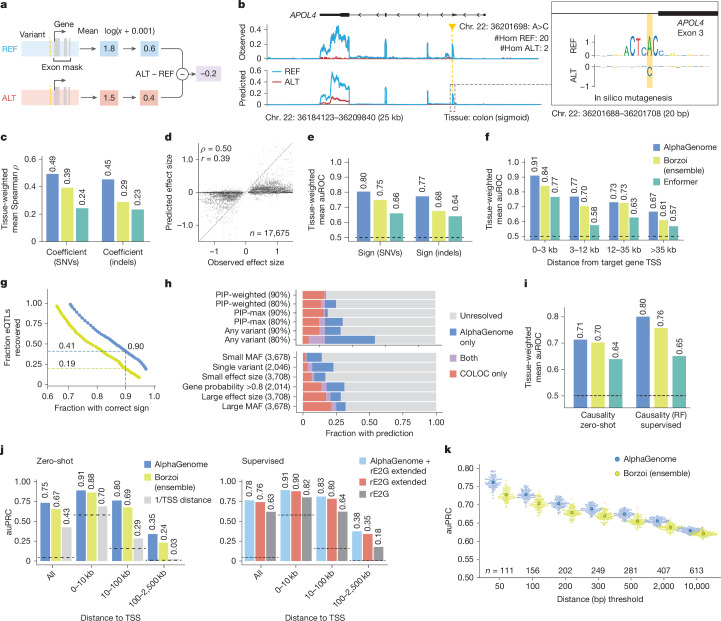
Fig. 4 AlphaGenome predicts the effect of variants on gene expression. a, RNA-seq variant scoring. Variant scoring strategy for predicting the effect of a genetic variant on the expression of a target gene (Methods). b, Example predictions for a known eQTL (chr. 22: 36201698: A>C) in GTEx colon (sigmoid) tissue. The observed RNA-seq coverage is the average across GTEx samples homozygous for either allele. Inset, comparative ISM on reference and alternative sequences over a 20-bp window centred on the variant (Methods). c, Comparison of performance (Spearman’s ρ) at predicting the effect size of eQTLs across 49 GTEx tissues (‘coefficient’) for different models and variant sets. d, Comparison of AlphaGenome-predicted variant scores and observed effect sizes (SuSiE β posterior) for 17,675 fine-mapped GTEx eQTLs (SNVs). Each point is a unique variant/gene/tissue combination. Spearman’s ρ (signed) = 0.50; Spearman’s ρ (unsigned; absolute values) = 0.10. Pearson’s r (signed) = 0.39; Pearson’s r (unsigned; absolute values) = 0.20. e, Comparison of performance (auROC) at predicting the direction of effect of eQTLs (‘sign’) for different models and variant sets. f, eQTL sign prediction performance stratified by different variant-to-TSS distance bins (SNVs only). g, Relationship between sign accuracy and eQTL recall. For a series of variant score thresholds, we plotted the fraction of GTEx eQTLs with a score above the threshold (y axis) and sign accuracy achieved (x axis) on those variants. h, Coverage of predictions across GWAS loci. Fraction of GWAS credible sets (from Open Targets52) with a predicted direction of effect for a plausible target gene, comparing AlphaGenome predictions to the eQTL co-localization approach. Top, each bar represents a different strategy for summarizing AlphaGenome scores, and two different score thresholds that yielded a given sign accuracy on eQTL of 80% or 90% (Methods). For COLOC, we counted a credible set as resolved if H4 > 0.95. Bottom, using the AlphaGenome strategy of PIP-weighting (80%), credible sets were further stratified by different properties (Methods). i, Comparison of performance (auROC) at distinguishing causal from non-causal eQTLs (‘causality’) using both zero-shot and supervised approaches (Methods). j, Enhancer–gene linking performance (ENCODE–rE2G CRISPRi dataset12). Zero-shot evaluation: performance (auPRC) comparison stratified by enhancer-to-TSS distance. Supervised evaluation: AlphaGenome input gradient score integrated into ENCODE–rE2G extended and ENCODE–rE2G models. k, Performance (auPRC) of paQTL variant effect prediction, thresholded by distance from the polyadenylation site. Each swarm plot represents 100 permutations of randomly matching each positive SNP with one of its distance and expression-matched negatives (Methods). Larger dots are the mean. RF, random forest.
Fig. 4 AlphaGenome predicts the effect of variants on gene expression. a, RNA-seq variant scoring. Variant scoring strategy for predicting the effect of a genetic variant on the expression of a target gene (Methods). b, Example predictions for a known eQTL (chr. 22: 36201698: A>C) in GTEx colon (sigmoid) tissue. The observed RNA-seq coverage is the average across GTEx samples homozygous for either allele. Inset, comparative ISM on reference and alternative sequences over a 20-bp window centred on the variant (Methods). c, Comparison of performance (Spearman’s ρ) at predicting the effect size of eQTLs across 49 GTEx tissues (‘coefficient’) for different models and variant sets. d, Comparison of AlphaGenome-predicted variant scores and observed effect sizes (SuSiE β posterior) for 17,675 fine-mapped GTEx eQTLs (SNVs). Each point is a unique variant/gene/tissue combination. Spearman’s ρ (signed) = 0.50; Spearman’s ρ (unsigned; absolute values) = 0.10. Pearson’s r (signed) = 0.39; Pearson’s r (unsigned; absolute values) = 0.20. e, Comparison of performance (auROC) at predicting the direction of effect of eQTLs (‘sign’) for different models and variant sets. f, eQTL sign prediction performance stratified by different variant-to-TSS distance bins (SNVs only). g, Relationship between sign accuracy and eQTL recall. For a series of variant score thresholds, we plotted the fraction of GTEx eQTLs with a score above the threshold (y axis) and sign accuracy achieved (x axis) on those variants. h, Coverage of predictions across GWAS loci. Fraction of GWAS credible sets (from Open Targets52) with a predicted direction of effect for a plausible target gene, comparing AlphaGenome predictions to the eQTL co-localization approach. Top, each bar represents a different strategy for summarizing AlphaGenome scores, and two different score thresholds that yielded a given sign accuracy on eQTL of 80% or 90% (Methods). For COLOC, we counted a credible set as resolved if H4 > 0.95. Bottom, using the AlphaGenome strategy of PIP-weighting (80%), credible sets were further stratified by different properties (Methods). i, Comparison of performance (auROC) at distinguishing causal from non-causal eQTLs (‘causality’) using both zero-shot and supervised approaches (Methods). j, Enhancer–gene linking performance (ENCODE–rE2G CRISPRi dataset12). Zero-shot evaluation: performance (auPRC) comparison stratified by enhancer-to-TSS distance. Supervised evaluation: AlphaGenome input gradient score integrated into ENCODE–rE2G extended and ENCODE–rE2G models. k, Performance (auPRC) of paQTL variant effect prediction, thresholded by distance from the polyadenylation site. Each swarm plot represents 100 permutations of randomly matching each positive SNP with one of its distance and expression-matched negatives (Methods). Larger dots are the mean. RF, random forest.CC BY · PubMed Central
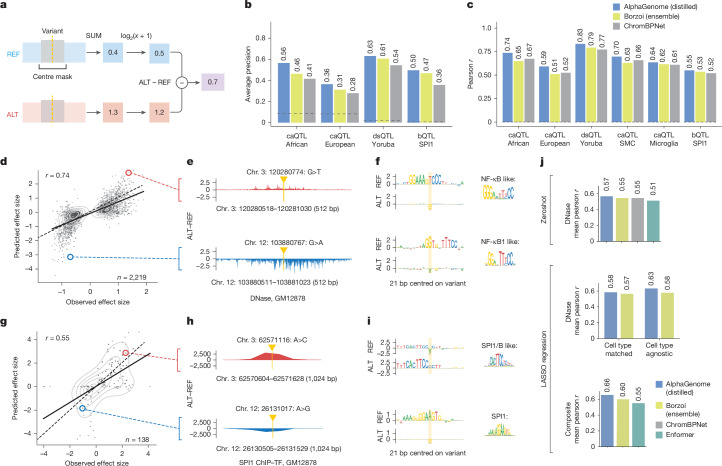
Fig. 5 AlphaGenome accurately predicts variant effects on chromatin accessibility and SPI1 transcription factor binding. a, Schematic of the centre-mask variant scoring strategy used for accessibility and ChIP-seq predictions (Methods). b,c, Performance comparison of AlphaGenome, Borzoi and ChromBPNet on QTL causality (b; average precision) and QTL effect size (c; Pearson r) across QTL types and ancestries. d, Predicted versus observed effect sizes for causal caQTLs (African ancestry). The scatterplot displays GM12878 cell line DNase predictions. Signed Pearson r = 0.74; unsigned Pearson r = 0.45. Signed Pearson r correlation uses raw values; unsigned Pearson r uses absolute values. Red and blue circles highlight variants in e and f. e, Example ALT–REF differences in predicted DNase (GM12878) for variants in d. f, ISM-derived sequence logos for REF/ALT alleles from e, suggesting variant disruption or modulation of transcription factor binding motifs. Putative binding factors and JASPAR53 matrix IDs (MA0105.1 and MA0105.3) are indicated on the right. g, Predicted versus observed effect sizes for causal SPI1 bQTLs using the GM12878 SPI1 ChIP-seq track. Signed Pearson r = 0.55; unsigned Pearson r = 0.12. Red and blue circles highlight variants in h and i. h, Example AlphaGenome predictions for selected SPI1 bQTLs. Shown are ALT–REF differences in predicted SPI1 ChIP-seq track (GM12878) around the variants highlighted in g. i, ISM-derived sequence logos for REF and ALT alleles of example SPI1 bQTLs from h, suggesting potential impacts such as creation or disruption of SPI1 or related motifs. The putative binding factors and JASPAR matrix IDs (MA0081.2 and MA0080.5) are indicated on the right. j, CAGI5 MPRA challenge performance (average across loci; mean Pearson r). Top, zero-shot using cell-type-matched DNase; middle, LASSO regression using cell-type-matched or agnostic DNase; bottom, LASSO regression using multimodal features (DNase + RNA + histone ChIP-seq output types for AlphaGenome and Borzoi; DNase + CAGE output types for Enformer) and all cell types. TF, transcription factor.
Fig. 5 AlphaGenome accurately predicts variant effects on chromatin accessibility and SPI1 transcription factor binding. a, Schematic of the centre-mask variant scoring strategy used for accessibility and ChIP-seq predictions (Methods). b,c, Performance comparison of AlphaGenome, Borzoi and ChromBPNet on QTL causality (b; average precision) and QTL effect size (c; Pearson r) across QTL types and ancestries. d, Predicted versus observed effect sizes for causal caQTLs (African ancestry). The scatterplot displays GM12878 cell line DNase predictions. Signed Pearson r = 0.74; unsigned Pearson r = 0.45. Signed Pearson r correlation uses raw values; unsigned Pearson r uses absolute values. Red and blue circles highlight variants in e and f. e, Example ALT–REF differences in predicted DNase (GM12878) for variants in d. f, ISM-derived sequence logos for REF/ALT alleles from e, suggesting variant disruption or modulation of transcription factor binding motifs. Putative binding factors and JASPAR53 matrix IDs (MA0105.1 and MA0105.3) are indicated on the right. g, Predicted versus observed effect sizes for causal SPI1 bQTLs using the GM12878 SPI1 ChIP-seq track. Signed Pearson r = 0.55; unsigned Pearson r = 0.12. Red and blue circles highlight variants in h and i. h, Example AlphaGenome predictions for selected SPI1 bQTLs. Shown are ALT–REF differences in predicted SPI1 ChIP-seq track (GM12878) around the variants highlighted in g. i, ISM-derived sequence logos for REF and ALT alleles of example SPI1 bQTLs from h, suggesting potential impacts such as creation or disruption of SPI1 or related motifs. The putative binding factors and JASPAR matrix IDs (MA0081.2 and MA0080.5) are indicated on the right. j, CAGI5 MPRA challenge performance (average across loci; mean Pearson r). Top, zero-shot using cell-type-matched DNase; middle, LASSO regression using cell-type-matched or agnostic DNase; bottom, LASSO regression using multimodal features (DNase + RNA + histone ChIP-seq output types for AlphaGenome and Borzoi; DNase + CAGE output types for Enformer) and all cell types. TF, transcription factor.CC BY · PubMed Central
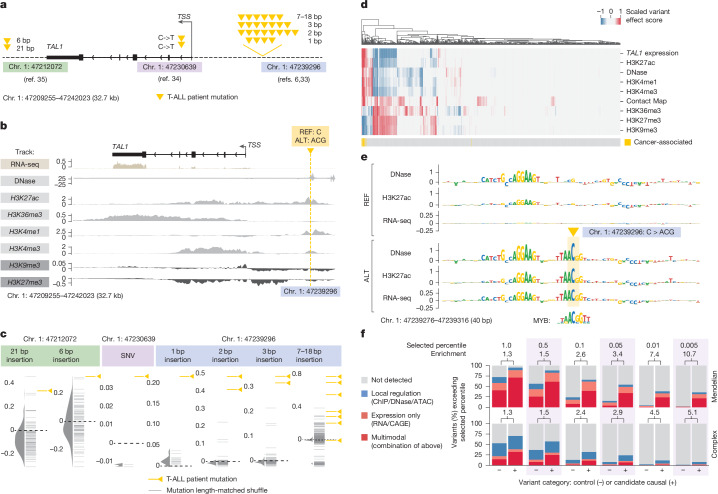
Fig. 6 Interpreting variant effects across modalities with AlphaGenome. a, Non-coding cancer mutations in T-ALL. Overview of groups of mutations affecting TAL1 in patients with T-ALL. b, Detailed ALT–REF predictions for an oncogenic insertion (chr. 1: 47239296: C>ACG) characterized in ref. 6. Shown are differences between AlphaGenome predictions between the ALT and REF sequences of the variant in CD34+ CMP tracks. The ALT sequence increases expression of the TAL1 gene 7.5 kb away. c, Predicted TAL1 expression change (ALT–REF) in CD34+ CMPs. RNA-seq variant scores for TAL1 expression in CD34+ CMPs. Oncogenic mutations (orange) are compared with randomly sampled, length-matched indels (grey). d, Multimodal heat map of predicted variant effects. Each column is a distinct variant from c. Each row is a variant effect score associated with a genome track in CD34+ CMPs, except for contact map variant effect scores, which were averaged across tissues (as there is no CD34+ CMP contact map in our data). Background mutations are included alongside oncogenic mutations. Variants were grouped by their insertion length and position (as displayed in Fig. 6c), and scores were min-max scaled. e, ISM results for DNase, H3K27ac and TAL1 RNA-seq expression prediction by AlphaGenome in CD34+ CMPs. Top, ISM on the reference sequence; bottom, ISM on the oncogenic insertion sequence (chr. 1: 47239296: C>ACG). Myb motif from a previous study6, originally from UniPROBE54. f, Multimodality in trait-altering non-coding variants. Fraction of trait-affecting variants55 (‘candidate causal’; 338 for Mendelian and 1,140 for complex traits), as well as matched control variants55 (‘control’; 3,042 and 10,260, respectively), which exceed varying quantile-score thresholds in at least one predicted track. Here, surpassing a quantile-score threshold of 1.0 implies a predicted effect in excess of 99% of common variants (Methods). Variants are categorized depending on the tracks where the threshold was passed: ‘local regulation’ (ChIP/DNase/ATAC), ‘expression only’ (RNA/CAGE) and ‘multimodal’ (combination of the above). Numbers above the bars indicate the relative enrichment of detected variants (sum of the three categories) among candidate causal variants compared with the control variants. The enrichment increases with stricter thresholds, with a reduction in recall (x axis).
Fig. 6 Interpreting variant effects across modalities with AlphaGenome. a, Non-coding cancer mutations in T-ALL. Overview of groups of mutations affecting TAL1 in patients with T-ALL. b, Detailed ALT–REF predictions for an oncogenic insertion (chr. 1: 47239296: C>ACG) characterized in ref. 6. Shown are differences between AlphaGenome predictions between the ALT and REF sequences of the variant in CD34+ CMP tracks. The ALT sequence increases expression of the TAL1 gene 7.5 kb away. c, Predicted TAL1 expression change (ALT–REF) in CD34+ CMPs. RNA-seq variant scores for TAL1 expression in CD34+ CMPs. Oncogenic mutations (orange) are compared with randomly sampled, length-matched indels (grey). d, Multimodal heat map of predicted variant effects. Each column is a distinct variant from c. Each row is a variant effect score associated with a genome track in CD34+ CMPs, except for contact map variant effect scores, which were averaged across tissues (as there is no CD34+ CMP contact map in our data). Background mutations are included alongside oncogenic mutations. Variants were grouped by their insertion length and position (as displayed in Fig. 6c), and scores were min-max scaled. e, ISM results for DNase, H3K27ac and TAL1 RNA-seq expression prediction by AlphaGenome in CD34+ CMPs. Top, ISM on the reference sequence; bottom, ISM on the oncogenic insertion sequence (chr. 1: 47239296: C>ACG). Myb motif from a previous study6, originally from UniPROBE54. f, Multimodality in trait-altering non-coding variants. Fraction of trait-affecting variants55 (‘candidate causal’; 338 for Mendelian and 1,140 for complex traits), as well as matched control variants55 (‘control’; 3,042 and 10,260, respectively), which exceed varying quantile-score thresholds in at least one predicted track. Here, surpassing a quantile-score threshold of 1.0 implies a predicted effect in excess of 99% of common variants (Methods). Variants are categorized depending on the tracks where the threshold was passed: ‘local regulation’ (ChIP/DNase/ATAC), ‘expression only’ (RNA/CAGE) and ‘multimodal’ (combination of the above). Numbers above the bars indicate the relative enrichment of detected variants (sum of the three categories) among candidate causal variants compared with the control variants. The enrichment increases with stricter thresholds, with a reduction in recall (x axis).CC BY · PubMed Central
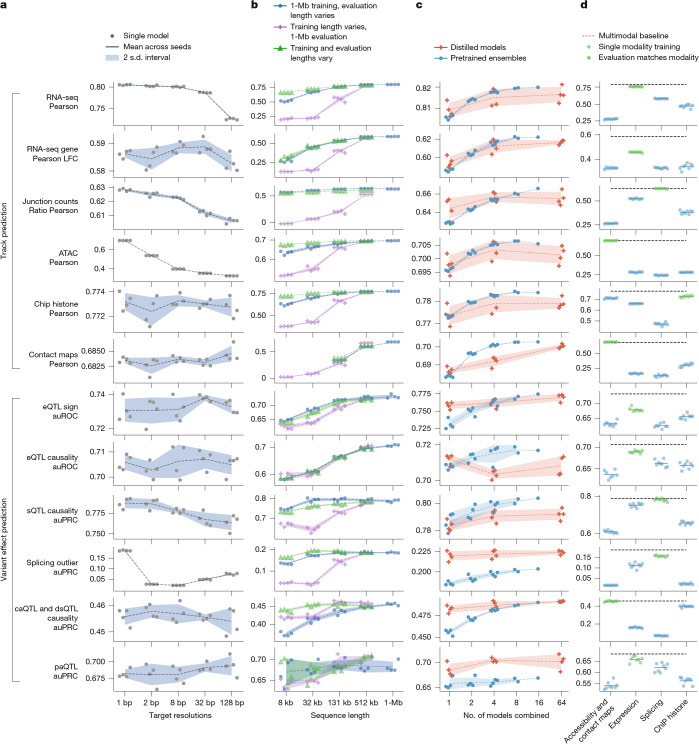
Fig. 7 Impact of resolution, sequence length, ensembling, distillation and multimodal training on AlphaGenome performance. Ablation studies evaluating key model design choices across various performance metrics (y axis). For all panels, lines represent the mean over replicate training runs with different random seeds (n = 4 unless otherwise stated), and shaded contours denote the uncertainty interval (two standard deviations). a, Impact of target resolution. Performance comparison across models trained to predict targets (DNA accessibility, gene expression and splicing) at varying resolutions (x axis; 1–128 bp). b, Impact of sequence length during training and inference. Blue dots represent a single set of models trained with 1-Mb input, evaluated using varying input sequence lengths (x axis). Purple crosses represent models trained at the sequence length indicated on the x axis but evaluated at a fixed 1-Mb input length. Green triangles represent models trained and evaluated using the same matched sequence length (x axis). c, Impact of the number of sub-models in ensembling and distillation. Performance comparison for mean ensembles of pretrained models (blue dots/contours; x axis indicates ensemble size) versus single models produced by distillation using 1, 4 or 64 teacher models (orange crosses/contours; x axis indicates number of teachers). d, Impact of multimodal learning. Performance comparison evaluating models trained only on specific modality groups (blue dots; n = 8 seeds per group, highlighted in green if the modality matches the evaluation metric) against the full multimodal model (black dashed line; n = 4 seeds average). During training for these models, we ensured that only the target modality group’s prediction heads contributed updates to the shared representations, allowing assessment of that modality group’s contribution to overall model performance. Groups shown (x axis) include models trained using gradients only from accessibility (ATAC, DNase and contact maps), expression (RNA-seq, CAGE and PRO-cap), splicing (sites, usage and junctions) or histone ChIP-seq.
Fig. 7 Impact of resolution, sequence length, ensembling, distillation and multimodal training on AlphaGenome performance. Ablation studies evaluating key model design choices across various performance metrics (y axis). For all panels, lines represent the mean over replicate training runs with different random seeds (n = 4 unless otherwise stated), and shaded contours denote the uncertainty interval (two standard deviations). a, Impact of target resolution. Performance comparison across models trained to predict targets (DNA accessibility, gene expression and splicing) at varying resolutions (x axis; 1–128 bp). b, Impact of sequence length during training and inference. Blue dots represent a single set of models trained with 1-Mb input, evaluated using varying input sequence lengths (x axis). Purple crosses represent models trained at the sequence length indicated on the x axis but evaluated at a fixed 1-Mb input length. Green triangles represent models trained and evaluated using the same matched sequence length (x axis). c, Impact of the number of sub-models in ensembling and distillation. Performance comparison for mean ensembles of pretrained models (blue dots/contours; x axis indicates ensemble size) versus single models produced by distillation using 1, 4 or 64 teacher models (orange crosses/contours; x axis indicates number of teachers). d, Impact of multimodal learning. Performance comparison evaluating models trained only on specific modality groups (blue dots; n = 8 seeds per group, highlighted in green if the modality matches the evaluation metric) against the full multimodal model (black dashed line; n = 4 seeds average). During training for these models, we ensured that only the target modality group’s prediction heads contributed updates to the shared representations, allowing assessment of that modality group’s contribution to overall model performance. Groups shown (x axis) include models trained using gradients only from accessibility (ATAC, DNase and contact maps), expression (RNA-seq, CAGE and PRO-cap), splicing (sites, usage and junctions) or histone ChIP-seq.CC BY · PubMed Central
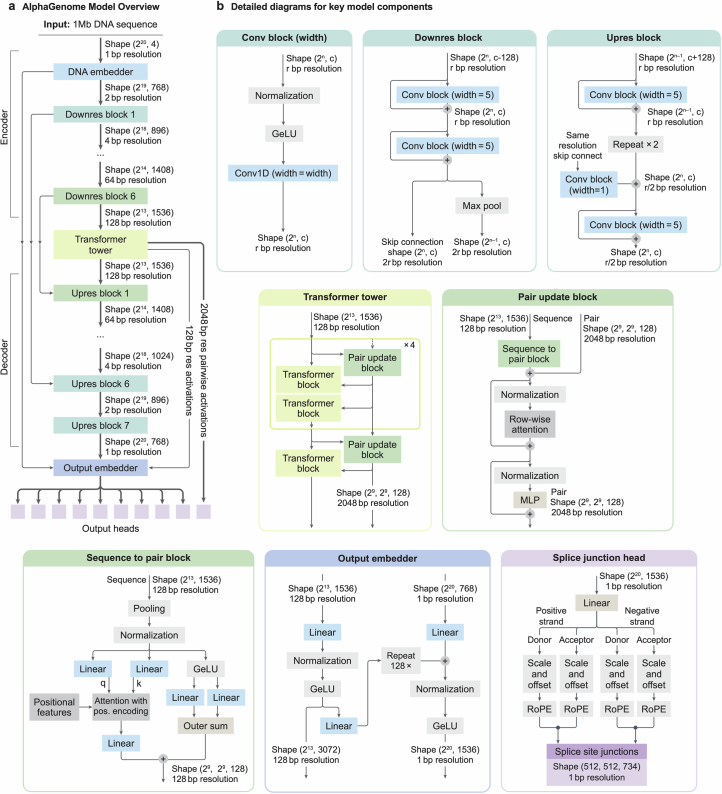
Extended Data Fig. 1 AlphaGenome model architecture. (a) The architecture follows a U-Net-like structure with an Encoder, a central Transformer Tower, and a Decoder processing a 1-Mb DNA input sequence. The Encoder uses convolutional blocks and max pooling to progressively downsample the sequence resolution (from 1 bp to 128 bp) while increasing feature channels. The Transformer Tower operates at 128 bp resolution, iteratively refining sequence representations and generating pairwise (2D) representations. The Decoder uses convolutional blocks and upsampling, incorporating skip connections (dashed lines) from corresponding Encoder stages, to restore sequence resolution up to 1 bp. An Output Embedder performs final processing before feeding representations to task-specific output heads. (b) Internal structure of key component blocks used repeatedly within the architecture overview shown in (a). Diagrams detail the layers within the convolutional blocks (Conv block, Upres block), the Transformer blocks, and the blocks responsible for generating and updating pairwise representations (Pair update block, Sequence to pair block). Tensor shapes are shown excluding the batch dimension. Abbreviations: r = log-resolution, c = channels.
Extended Data Fig. 1 AlphaGenome model architecture. (a) The architecture follows a U-Net-like structure with an Encoder, a central Transformer Tower, and a Decoder processing a 1-Mb DNA input sequence. The Encoder uses convolutional blocks and max pooling to progressively downsample the sequence resolution (from 1 bp to 128 bp) while increasing feature channels. The Transformer Tower operates at 128 bp resolution, iteratively refining sequence representations and generating pairwise (2D) representations. The Decoder uses convolutional blocks and upsampling, incorporating skip connections (dashed lines) from corresponding Encoder stages, to restore sequence resolution up to 1 bp. An Output Embedder performs final processing before feeding representations to task-specific output heads. (b) Internal structure of key component blocks used repeatedly within the architecture overview shown in (a). Diagrams detail the layers within the convolutional blocks (Conv block, Upres block), the Transformer blocks, and the blocks responsible for generating and updating pairwise representations (Pair update block, Sequence to pair block). Tensor shapes are shown excluding the batch dimension. Abbreviations: r = log-resolution, c = channels.CC BY · PubMed Central
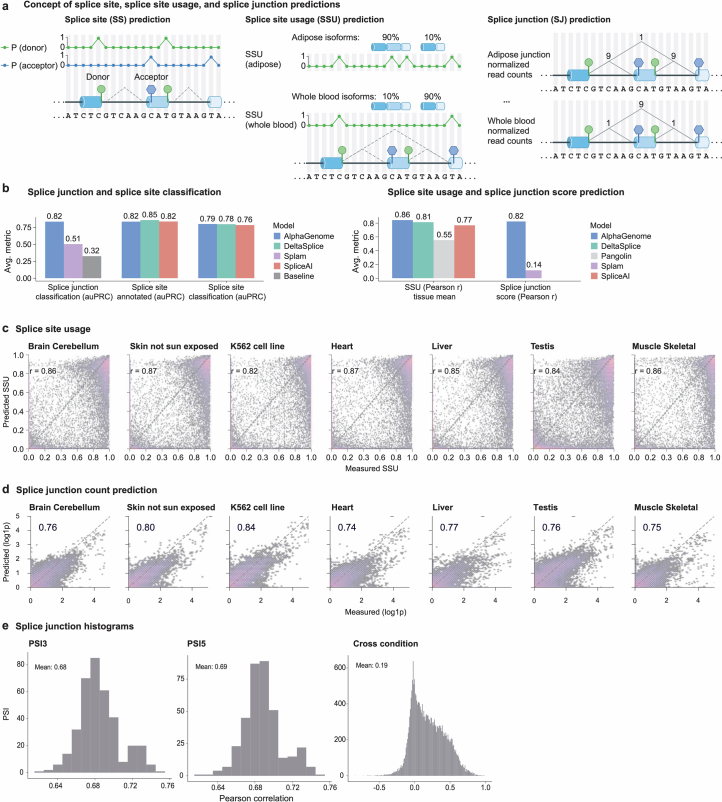
Extended Data Fig. 2 Splicing track performance. (a) Schematic overview of splice site (SS) classification, splice site usage (SSU) prediction, and splice junction (SJ) read count prediction tasks. (b) (left) Performance comparison (AUPRC) of SS classification and SJ classification against reference methods. ‘Baseline’ means the fraction of positive splice junctions in the evaluated data. Splice site classification is evaluated with both GTF (GENCODE v46) annotated splice sites only and also splice sites derived from GTEx RNA-seq data (Methods). Splice junction classification discriminates between true splice junctions observed from RNA-seq data versus false junctions not observed from RNA-seq (but where the splice sites are observed). Splice junction classification was evaluated per tissue and then the mean AUPRC across tissues were reported. (right) Performance comparison (Pearson r) of predicted vs. measured SSU and SJ counts (log(1+x) transformed). (c) Scatter plot between predicted and measured donor SSU across seven example human tissues (from GTEx). Pearson r in each tissue is displayed as text. (d) Scatter plot between predicted and measured splice junction counts across seven human tissues (from GTEx). Pearson r in each tissue is displayed as text. (e) Distribution of Pearson correlation coefficients between predicted and measured PSI3 per tissue (left), PSI5 per tissue (middle), and junction counts across tissues (measuring tissue specificity of the splice junction predictions).
Extended Data Fig. 2 Splicing track performance. (a) Schematic overview of splice site (SS) classification, splice site usage (SSU) prediction, and splice junction (SJ) read count prediction tasks. (b) (left) Performance comparison (AUPRC) of SS classification and SJ classification against reference methods. ‘Baseline’ means the fraction of positive splice junctions in the evaluated data. Splice site classification is evaluated with both GTF (GENCODE v46) annotated splice sites only and also splice sites derived from GTEx RNA-seq data (Methods). Splice junction classification discriminates between true splice junctions observed from RNA-seq data versus false junctions not observed from RNA-seq (but where the splice sites are observed). Splice junction classification was evaluated per tissue and then the mean AUPRC across tissues were reported. (right) Performance comparison (Pearson r) of predicted vs. measured SSU and SJ counts (log(1+x) transformed). (c) Scatter plot between predicted and measured donor SSU across seven example human tissues (from GTEx). Pearson r in each tissue is displayed as text. (d) Scatter plot between predicted and measured splice junction counts across seven human tissues (from GTEx). Pearson r in each tissue is displayed as text. (e) Distribution of Pearson correlation coefficients between predicted and measured PSI3 per tissue (left), PSI5 per tissue (middle), and junction counts across tissues (measuring tissue specificity of the splice junction predictions).CC BY · PubMed Central
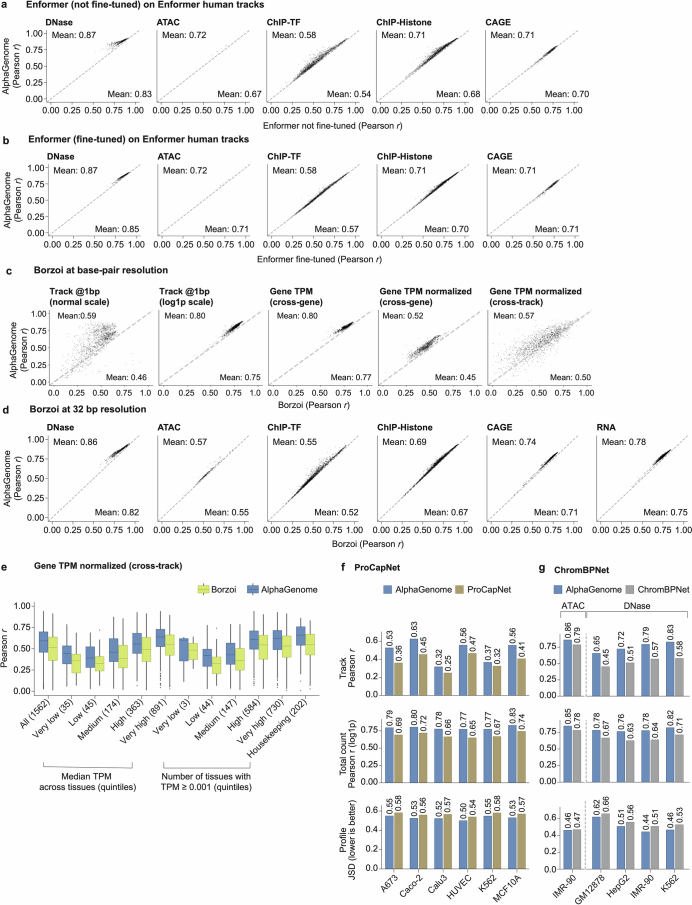
Extended Data Fig. 3 Track-level performance benchmarking. Performance comparison of AlphaGenome with Enformer and Borzoi on held-out genomic track prediction. (a, b) Comparison of AlphaGenome test set performance on Enformer human tracks (each dot is one track) against Enformer models either (a) not fine-tuned or (b) fine-tuned on human data (the main released Enformer version). AlphaGenome model was re-trained for direct comparability using matched training intervals and an additional Enformer prediction head (Methods). (c) Evaluation of RNA-seq prediction performance at base and gene resolution using the same source of RNA-seq data as Borzoi, but processed at base-resolution and not scaled (Methods). Borzoi’s 32 bp RNA-seq predictions were upsampled and unscaled to the original scale for comparison. The larger performance difference observed on the normal scale (first column) likely reflects resolution differences at exon-intron boundaries. This difference decreased when using log(1+x) transformed values (second column), suggesting better agreement on overall gene expression levels. A similar trend was observed when aggregating expression per gene (average exon coverage, third column). Cell-type specificity was evaluated by correlating quantile-normalized, mean-subtracted expression profiles across genes (fourth column) and across tracks (fifth column). (d) Test set performance comparison of AlphaGenome against Borzoi (fold 1) on Borzoi track data at 32 bp resolution (each dot is one track). AlphaGenome was fine-tuned with an additional Borzoi head at matched resolution (Methods). (e) Stratification of cell-type specific prediction accuracy. The per-gene log-fold change correlation performance (from panel c, fourth column) was stratified by gene characteristics: median expression level across tissues (Median TPM; quintile breakpoints: 5.5×10⁻⁹, 4.1×10⁻⁴, 8.1×10⁻⁴, 0.17, 4.1, 3.6×10⁴ TPM), number of tissues with the gene expressed (TPM ≥ 0.001; quintile breakpoints: 9.4×10⁻⁸, 9.4×10⁻⁴, 8.0, 52, 54, 54 tissues), and housekeeping gene status. Sample sizes in brackets are the number of genes in each category. Box plots display the median (center line), the 25th and 75th percentiles (box bounds), and the whiskers extend to 1.5 times the interquartile range from the box bounds; points beyond whiskers indicate outliers. (f, g) Performance comparison of AlphaGenome against (f) ProCapNet (on PRO-Cap data) and (g) ChromBPNet (on ATAC and DNase). Evaluation was performed on ProCapNet fold 5 and ChromBPNet fold 0 test peak regions, respectively, where regions overlapping with AlphaGenome fold 0 training intervals were excluded. Performance is quantified by track Pearson r, Pearson r on the log total count, and Jensen-Shannon distance (JSD; lower indicates better performance). AlphaGenome outperforms the baselines across all metrics, modalities and cell-lines. For (g), only tracks with matching experiment accessions between AlphaGenome and ChromBPNet training sets were considered.
Extended Data Fig. 3 Track-level performance benchmarking. Performance comparison of AlphaGenome with Enformer and Borzoi on held-out genomic track prediction. (a, b) Comparison of AlphaGenome test set performance on Enformer human tracks (each dot is one track) against Enformer models either (a) not fine-tuned or (b) fine-tuned on human data (the main released Enformer version). AlphaGenome model was re-trained for direct comparability using matched training intervals and an additional Enformer prediction head (Methods). (c) Evaluation of RNA-seq prediction performance at base and gene resolution using the same source of RNA-seq data as Borzoi, but processed at base-resolution and not scaled (Methods). Borzoi’s 32 bp RNA-seq predictions were upsampled and unscaled to the original scale for comparison. The larger performance difference observed on the normal scale (first column) likely reflects resolution differences at exon-intron boundaries. This difference decreased when using log(1+x) transformed values (second column), suggesting better agreement on overall gene expression levels. A similar trend was observed when aggregating expression per gene (average exon coverage, third column). Cell-type specificity was evaluated by correlating quantile-normalized, mean-subtracted expression profiles across genes (fourth column) and across tracks (fifth column). (d) Test set performance comparison of AlphaGenome against Borzoi (fold 1) on Borzoi track data at 32 bp resolution (each dot is one track). AlphaGenome was fine-tuned with an additional Borzoi head at matched resolution (Methods). (e) Stratification of cell-type specific prediction accuracy. The per-gene log-fold change correlation performance (from panel c, fourth column) was stratified by gene characteristics: median expression level across tissues (Median TPM; quintile breakpoints: 5.5×10⁻⁹, 4.1×10⁻⁴, 8.1×10⁻⁴, 0.17, 4.1, 3.6×10⁴ TPM), number of tissues with the gene expressed (TPM ≥ 0.001; quintile breakpoints: 9.4×10⁻⁸, 9.4×10⁻⁴, 8.0, 52, 54, 54 tissues), and housekeeping gene status. Sample sizes in brackets are the number of genes in each category. Box plots display the median (center line), the 25th and 75th percentiles (box bounds), and the whiskers extend to 1.5 times the interquartile range from the box bounds; points beyond whiskers indicate outliers. (f, g) Performance comparison of AlphaGenome against (f) ProCapNet (on PRO-Cap data) and (g) ChromBPNet (on ATAC and DNase). Evaluation was performed on ProCapNet fold 5 and ChromBPNet fold 0 test peak regions, respectively, where regions overlapping with AlphaGenome fold 0 training intervals were excluded. Performance is quantified by track Pearson r, Pearson r on the log total count, and Jensen-Shannon distance (JSD; lower indicates better performance). AlphaGenome outperforms the baselines across all metrics, modalities and cell-lines. For (g), only tracks with matching experiment accessions between AlphaGenome and ChromBPNet training sets were considered.CC BY · PubMed Central
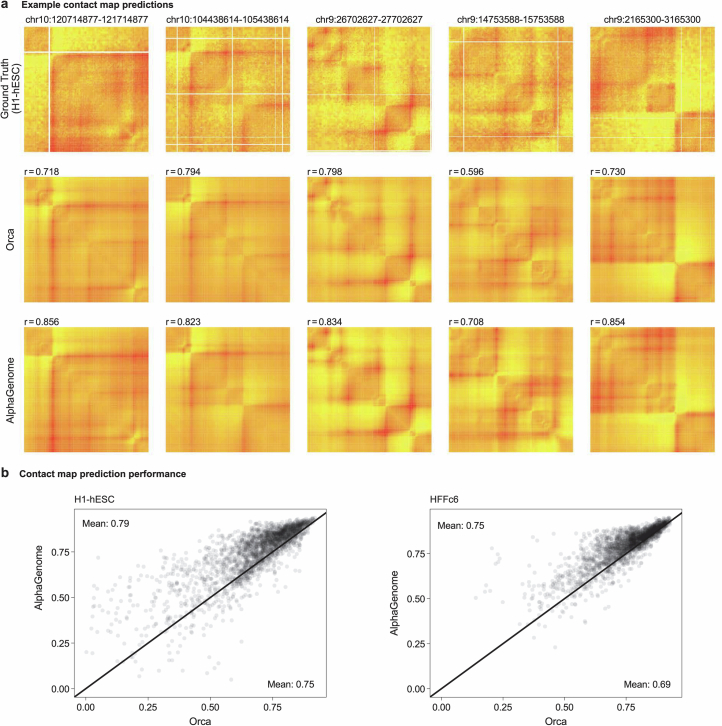
Extended Data Fig. 4 Contact map prediction and comparison with Orca. (a) Comparison of predicted chromatin contact maps for five randomly selected 1-Mb intervals from the validation set. Rows show ground truth experimental data (H1-hESC Micro-C), predictions from the baseline model Orca, and predictions from AlphaGenome. Pearson correlation coefficients (r) between prediction and ground truth are displayed in the upper right corner of each corresponding predicted map. (b) Scatterplot comparing overall contact map prediction performance of AlphaGenome and Orca across all 1-Mb test intervals, for the two cell-types predicted by Orca. Each point represents an interval, plotting the Pearson R achieved by AlphaGenome (y-axis) versus Orca (x-axis) when comparing predictions to the ground truth. Points above the diagonal indicate intervals where AlphaGenome achieved higher correlation than Orca.
Extended Data Fig. 4 Contact map prediction and comparison with Orca. (a) Comparison of predicted chromatin contact maps for five randomly selected 1-Mb intervals from the validation set. Rows show ground truth experimental data (H1-hESC Micro-C), predictions from the baseline model Orca, and predictions from AlphaGenome. Pearson correlation coefficients (r) between prediction and ground truth are displayed in the upper right corner of each corresponding predicted map. (b) Scatterplot comparing overall contact map prediction performance of AlphaGenome and Orca across all 1-Mb test intervals, for the two cell-types predicted by Orca. Each point represents an interval, plotting the Pearson R achieved by AlphaGenome (y-axis) versus Orca (x-axis) when comparing predictions to the ground truth. Points above the diagonal indicate intervals where AlphaGenome achieved higher correlation than Orca.CC BY · PubMed Central
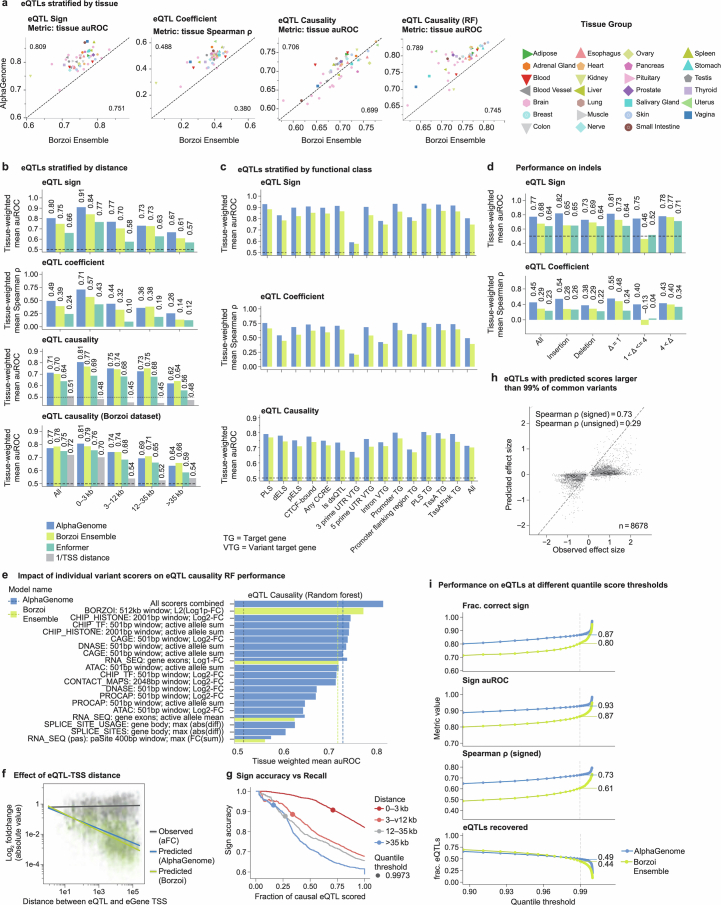
Extended Data Fig. 5 Additional eQTL analysis. Further characterization and stratification of AlphaGenome’s eQTL prediction performance. (a) Performance comparison on eQTL tasks (Coefficient Spearman R, Sign auROC, Causality auROC zero-shot, Causality RF auROC) across individual GTEx tissues (see Methods for specific scorer configurations). For zero-shot tasks, AlphaGenome’s default variant scorer is used (Methods; Fig. 4a). For the supervised causality task (‘eQTL Causality (RF)’), results use the best-performing feature set (‘All scorers combined’; e). For Borzoi comparison, the published L2_DIFF scorer across all output tracks is used. (b) Performance on eQTL tasks (Coefficient, Sign, Causality) stratified by distance from variant to target gene TSS, compared to Borzoi and a 1/distance baseline for the causality task. (c) Performance on eQTL tasks stratified by broad functional classes based on variant location. TG = Target Gene; VTG = Variant target gene. (d) Performance on indel eQTLs for the Sign and Coefficient tasks stratified by indel size, comparing AlphaGenome and Borzoi. (e) Random forest performance on the eQTL causality task using different feature sets. Horizontal bar plot compares RF performance (auROC from Fig. 4g) when trained using features derived from all scorers combined or individual modality scorers (also comparing AlphaGenome to Borzoi outputs). (f) Observed versus predicted eQTL log2 fold change plotted against variant-TSS distance (within 262 kb, ensuring target TSS is within receptive field context). Observed values are allelic log-fold changes from Mohammadi et al.56, which were used to allow direct comparison with the scale of AlphaGenome’s predicted log-fold changes (Methods). (g) Sign accuracy as well as the fraction of eQTLs that pass a certain quantile-score cutoff visualized for all possible thresholds and four eQTL distance categories. The quantile score cutoff which leads to an overall (across distance bins) sign accuracy of 90% is highlighted. At this cutoff, sign accuracy is similar across distance categories, although recall is notably lower for distal variants. (h) Scatterplot comparing observed versus predicted effect sizes for 8,678 fine-mapped eQTLs filtered for high AlphaGenome prediction scores (>99th percentile of common variants). (i) Relationship between AlphaGenome’s quantile score threshold (x-axis; Methods) and the resulting performance (y-axis) for eQTL Sign accuracy and Coefficient Spearman R tasks.
Extended Data Fig. 5 Additional eQTL analysis. Further characterization and stratification of AlphaGenome’s eQTL prediction performance. (a) Performance comparison on eQTL tasks (Coefficient Spearman R, Sign auROC, Causality auROC zero-shot, Causality RF auROC) across individual GTEx tissues (see Methods for specific scorer configurations). For zero-shot tasks, AlphaGenome’s default variant scorer is used (Methods; Fig. 4a). For the supervised causality task (‘eQTL Causality (RF)’), results use the best-performing feature set (‘All scorers combined’; e). For Borzoi comparison, the published L2_DIFF scorer across all output tracks is used. (b) Performance on eQTL tasks (Coefficient, Sign, Causality) stratified by distance from variant to target gene TSS, compared to Borzoi and a 1/distance baseline for the causality task. (c) Performance on eQTL tasks stratified by broad functional classes based on variant location. TG = Target Gene; VTG = Variant target gene. (d) Performance on indel eQTLs for the Sign and Coefficient tasks stratified by indel size, comparing AlphaGenome and Borzoi. (e) Random forest performance on the eQTL causality task using different feature sets. Horizontal bar plot compares RF performance (auROC from Fig. 4g) when trained using features derived from all scorers combined or individual modality scorers (also comparing AlphaGenome to Borzoi outputs). (f) Observed versus predicted eQTL log2 fold change plotted against variant-TSS distance (within 262 kb, ensuring target TSS is within receptive field context). Observed values are allelic log-fold changes from Mohammadi et al.56, which were used to allow direct comparison with the scale of AlphaGenome’s predicted log-fold changes (Methods). (g) Sign accuracy as well as the fraction of eQTLs that pass a certain quantile-score cutoff visualized for all possible thresholds and four eQTL distance categories. The quantile score cutoff which leads to an overall (across distance bins) sign accuracy of 90% is highlighted. At this cutoff, sign accuracy is similar across distance categories, although recall is notably lower for distal variants. (h) Scatterplot comparing observed versus predicted effect sizes for 8,678 fine-mapped eQTLs filtered for high AlphaGenome prediction scores (>99th percentile of common variants). (i) Relationship between AlphaGenome’s quantile score threshold (x-axis; Methods) and the resulting performance (y-axis) for eQTL Sign accuracy and Coefficient Spearman R tasks.CC BY · PubMed Central
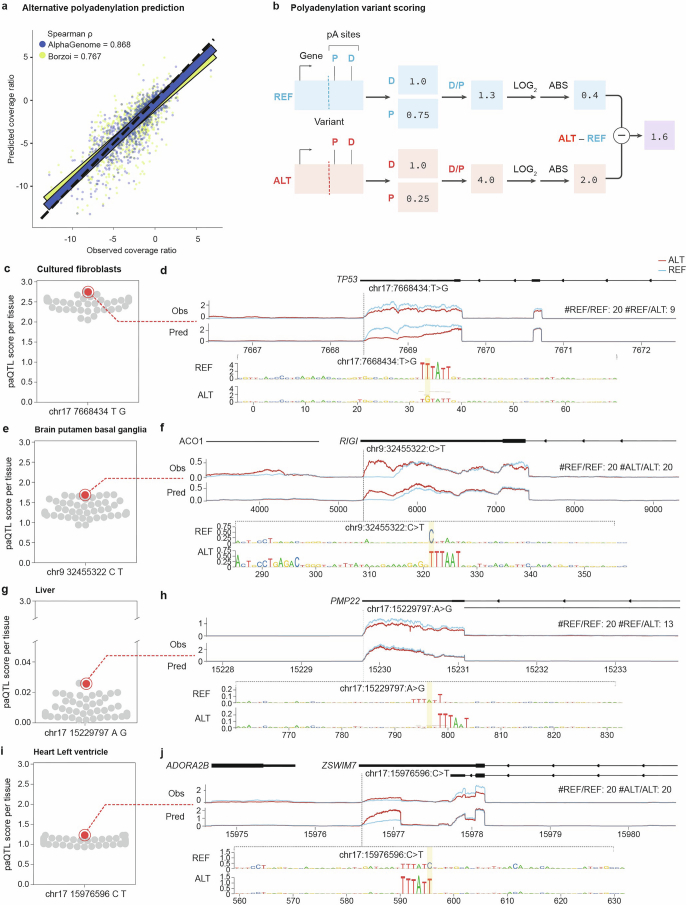
Extended Data Fig. 6 Improved prediction of 3’ UTR polyadenylation and paQTLs with AlphaGenome. (a) Polyadenylation predicted vs observed coverage ratio (COVR) for each gene’s most distal and proximal PAS for Borzoi and AlphaGenome. (b) Polyadenylation variants scoring scheme. (c,d) Example of variant disrupting a polyadenylation motif in the TP53 gene. (c) Distribution of scores for the indicated variant across GTEx tissues (gray swarmplot) with the highest and lowest scoring tissues and average score highlighted (red dots). (d) Observed and predicted RNA-seq for the tissues highlighted in (c), and in silico saturation mutagenesis scores (ISM) of the 72 bp flanking the variant. ISM clearly highlights the relevance of the polyadenylation motif exclusively in the reference background, where the variant does not compromise the motif. (e,f) As (c) and (d) but for a variant generating a new polyadenylation motif in the RIGI gene. (g,h) As (c) and (d) but for a paQTL with a low variant score. The variant disrupts the PAS but a cryptic one emerges nearby with limited effect on gene expression. (i,j) As (c) and (e) but for a failure case. AlphaGenome correctly identifies the emergence of a novel PAS but fails to correctly predict the effect on gene expression.
Extended Data Fig. 6 Improved prediction of 3’ UTR polyadenylation and paQTLs with AlphaGenome. (a) Polyadenylation predicted vs observed coverage ratio (COVR) for each gene’s most distal and proximal PAS for Borzoi and AlphaGenome. (b) Polyadenylation variants scoring scheme. (c,d) Example of variant disrupting a polyadenylation motif in the TP53 gene. (c) Distribution of scores for the indicated variant across GTEx tissues (gray swarmplot) with the highest and lowest scoring tissues and average score highlighted (red dots). (d) Observed and predicted RNA-seq for the tissues highlighted in (c), and in silico saturation mutagenesis scores (ISM) of the 72 bp flanking the variant. ISM clearly highlights the relevance of the polyadenylation motif exclusively in the reference background, where the variant does not compromise the motif. (e,f) As (c) and (d) but for a variant generating a new polyadenylation motif in the RIGI gene. (g,h) As (c) and (d) but for a paQTL with a low variant score. The variant disrupts the PAS but a cryptic one emerges nearby with limited effect on gene expression. (i,j) As (c) and (e) but for a failure case. AlphaGenome correctly identifies the emergence of a novel PAS but fails to correctly predict the effect on gene expression.CC BY · PubMed Central
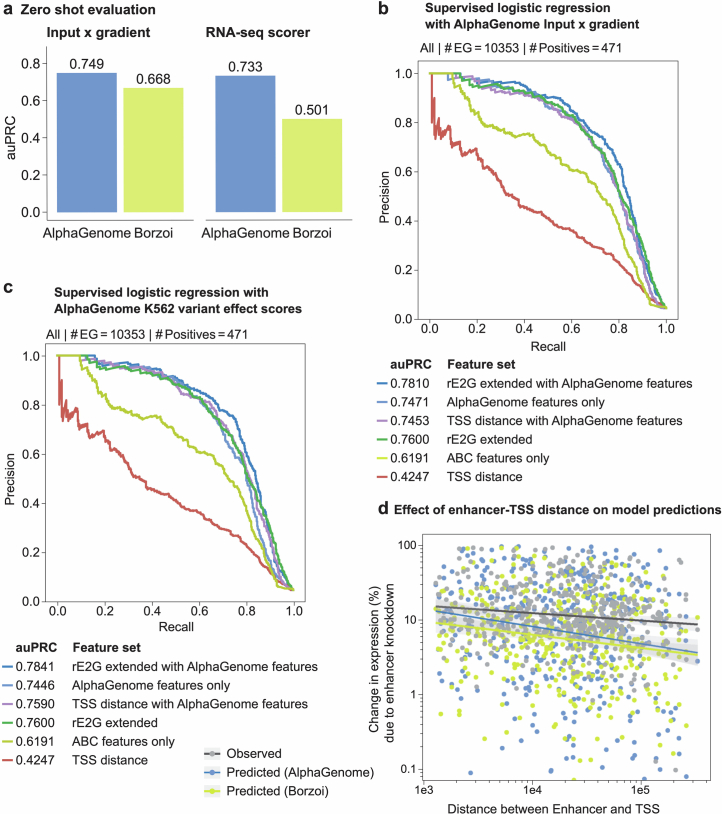
Extended Data Fig. 7 AlphaGenome improves enhancer-gene linking using input gradients and shows enhanced sensitivity to distal enhancers. (a) Zero-shot performance of AlphaGenome and Borzoi on the ENCODE-rE2G benchmark. Bars indicate the area under the precision-recall curve (auPRC) for predicting enhancer-gene links. Two scoring methods derived from each model were evaluated: input gradient scores and RNA-seq variant effect scores. (b) Impact of incorporating AlphaGenome’s input gradient score as a feature in the ENCODE-rE2G extended logistic regression model, evaluated on the ENCODE-rE2G benchmark. ENCODE-rE2G is a logistic regression model trained to predict enhancer-gene interactions from features12. Precision-recall curves are shown, colored by the feature sets used for training the regression model (auPRC values indicated in the legend). Feature sets are: ‘rE2G extended with AlphaGenome features’: All ENCODE-rE2G extended model features plus a single AlphaGenome’s input x gradient score; ‘AlphaGenome features only’: The AlphaGenome input x gradient score alone; ‘TSS distance with AlphaGenome features’: AlphaGenome input x gradient score plus the distance to TSS feature; ‘rE2G extended’: All features from the ENCODE-rE2G extended model12; ‘TSS distance’: Distance to TSS feature from12; ‘ABC features only’: Subset of ‘rE2g extended’, with only features related to the Activity-By-Contact (ABC) model12. (c) Precision-recall curves for the ENCODE-rE2G benchmark, similar to panel (b), evaluating the ENCODE-rE2G extended regression model with different feature sets. Area under the precision-recall curve (auPRC) values for the different feature sets are indicated in the legend. In this configuration, ‘AlphaGenome features’ consist of a more comprehensive set of K562 cell line-specific variant effect scores. These include Allele-Specific Activity Scores (AAS) and variant effect scores calculated as the difference between alternate (ALT) and reference (REF) allele predictions (ALT-REF Diff scores). These scores were derived from AlphaGenome for the following genomic assays: RNA-seq of the target gene, ChIP-TF EP300, ChIP-Histone H3K27ac, CAGE, PRO-cap, H1-ESC contact maps. (d) Relationship between enhancer perturbation effects (ENCODE-rE2G dataset12) and enhancer-promoter distance. The scatter plot shows experimentally observed percentage changes in gene expression upon enhancer knockout (grey points and trend line) versus the genomic distance between the enhancer and the target gene’s Transcription Start Site (TSS). Overlaid are trend lines for AlphaGenome’s (AG, dark blue) and Borzoi’s (green) predictions of these expression changes, derived from their respective model input gradient scores. Each point corresponds to a validated enhancer-gene pair. Error bars (grey) represent 95% confidence intervals from the linear regression.
Extended Data Fig. 7 AlphaGenome improves enhancer-gene linking using input gradients and shows enhanced sensitivity to distal enhancers. (a) Zero-shot performance of AlphaGenome and Borzoi on the ENCODE-rE2G benchmark. Bars indicate the area under the precision-recall curve (auPRC) for predicting enhancer-gene links. Two scoring methods derived from each model were evaluated: input gradient scores and RNA-seq variant effect scores. (b) Impact of incorporating AlphaGenome’s input gradient score as a feature in the ENCODE-rE2G extended logistic regression model, evaluated on the ENCODE-rE2G benchmark. ENCODE-rE2G is a logistic regression model trained to predict enhancer-gene interactions from features12. Precision-recall curves are shown, colored by the feature sets used for training the regression model (auPRC values indicated in the legend). Feature sets are: ‘rE2G extended with AlphaGenome features’: All ENCODE-rE2G extended model features plus a single AlphaGenome’s input x gradient score; ‘AlphaGenome features only’: The AlphaGenome input x gradient score alone; ‘TSS distance with AlphaGenome features’: AlphaGenome input x gradient score plus the distance to TSS feature; ‘rE2G extended’: All features from the ENCODE-rE2G extended model12; ‘TSS distance’: Distance to TSS feature from12; ‘ABC features only’: Subset of ‘rE2g extended’, with only features related to the Activity-By-Contact (ABC) model12. (c) Precision-recall curves for the ENCODE-rE2G benchmark, similar to panel (b), evaluating the ENCODE-rE2G extended regression model with different feature sets. Area under the precision-recall curve (auPRC) values for the different feature sets are indicated in the legend. In this configuration, ‘AlphaGenome features’ consist of a more comprehensive set of K562 cell line-specific variant effect scores. These include Allele-Specific Activity Scores (AAS) and variant effect scores calculated as the difference between alternate (ALT) and reference (REF) allele predictions (ALT-REF Diff scores). These scores were derived from AlphaGenome for the following genomic assays: RNA-seq of the target gene, ChIP-TF EP300, ChIP-Histone H3K27ac, CAGE, PRO-cap, H1-ESC contact maps. (d) Relationship between enhancer perturbation effects (ENCODE-rE2G dataset12) and enhancer-promoter distance. The scatter plot shows experimentally observed percentage changes in gene expression upon enhancer knockout (grey points and trend line) versus the genomic distance between the enhancer and the target gene’s Transcription Start Site (TSS). Overlaid are trend lines for AlphaGenome’s (AG, dark blue) and Borzoi’s (green) predictions of these expression changes, derived from their respective model input gradient scores. Each point corresponds to a validated enhancer-gene pair. Error bars (grey) represent 95% confidence intervals from the linear regression.CC BY · PubMed Central
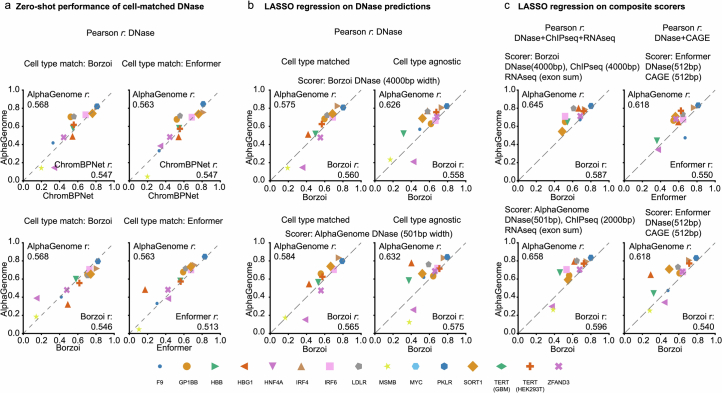
Extended Data Fig. 8 AlphaGenome performance on the CAGI5 MPRA challenge. Comparison of models predicting the effects of regulatory variants on gene expression using CAGI5 MPRA data. (a) Pairwise comparisons of zero-shot, cell-type matched performance using raw DNase model outputs. Scatter plots show per-gene or per-context Pearson correlations. AlphaGenome shows comparable or slightly improved performance compared to Enformer, ChromBPNet, and Borzoi Ensemble based on overall correlations across compared loci (details in plot annotations; cell-type matching strategy adapted from Enformer/Borzoi papers, see Methods). Note that ChromBPNet only reports performance for TERT-HEK293T, thus TERT-GBM is excluded in the AlphaGenome vs ChromBPNet comparison. (b) Pairwise comparisons of cell-type matched (see a) and cell type agnostic performance using LASSO regression on spatially summed DNase features (Methods). Comparison of the original Borzoi scorer (upper row) and AlphaGenome recommended scoring strategy (bottom row). AlphaGenome outperforms Borzoi in all settings and shows that cell type matching is not required when applying LASSO regression. (c) Pairwise comparisons of cell-type agnostic performance using LASSO regression with different input features: left column shows the composite scorer described in Borzoi (DNase + Histone ChIP-seq + RNA), right column shows the composite scorer described in Enformer (DNase + CAGE). AlphaGenome generally outperforms Enformer and Borzoi for all input feature settings.
Extended Data Fig. 8 AlphaGenome performance on the CAGI5 MPRA challenge. Comparison of models predicting the effects of regulatory variants on gene expression using CAGI5 MPRA data. (a) Pairwise comparisons of zero-shot, cell-type matched performance using raw DNase model outputs. Scatter plots show per-gene or per-context Pearson correlations. AlphaGenome shows comparable or slightly improved performance compared to Enformer, ChromBPNet, and Borzoi Ensemble based on overall correlations across compared loci (details in plot annotations; cell-type matching strategy adapted from Enformer/Borzoi papers, see Methods). Note that ChromBPNet only reports performance for TERT-HEK293T, thus TERT-GBM is excluded in the AlphaGenome vs ChromBPNet comparison. (b) Pairwise comparisons of cell-type matched (see a) and cell type agnostic performance using LASSO regression on spatially summed DNase features (Methods). Comparison of the original Borzoi scorer (upper row) and AlphaGenome recommended scoring strategy (bottom row). AlphaGenome outperforms Borzoi in all settings and shows that cell type matching is not required when applying LASSO regression. (c) Pairwise comparisons of cell-type agnostic performance using LASSO regression with different input features: left column shows the composite scorer described in Borzoi (DNase + Histone ChIP-seq + RNA), right column shows the composite scorer described in Enformer (DNase + CAGE). AlphaGenome generally outperforms Enformer and Borzoi for all input feature settings.CC BY · PubMed Central
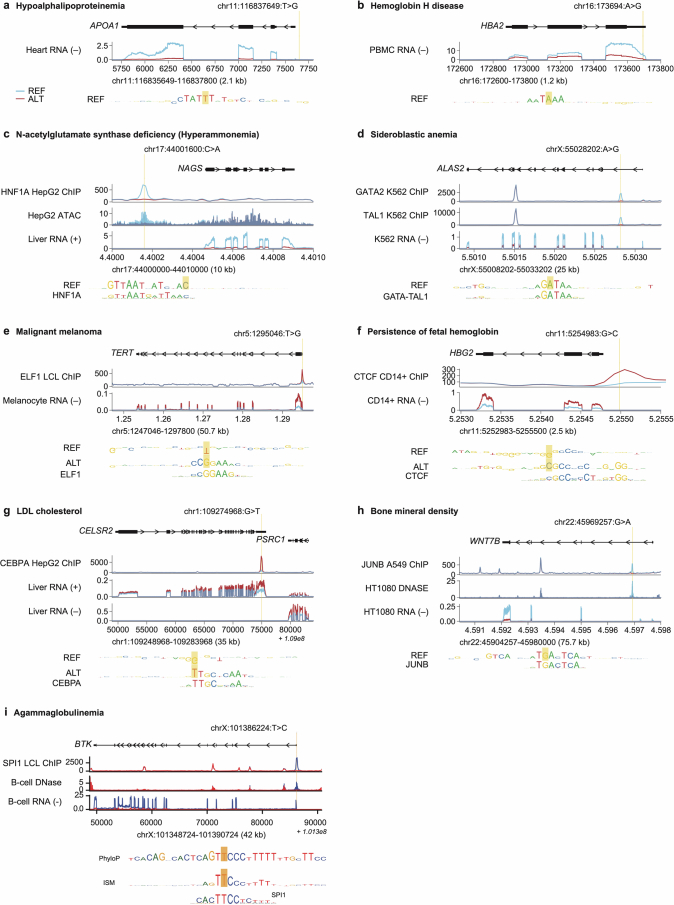
Extended Data Fig. 9 Interpreting trait-affecting variants using AlphaGenome. (a) AlphaGenome predictions for the variant chr11:116837649:T>G, previously reported to result in underexpression of APOA1 and Hypoalphalipoproteinemia57. The variant strongly reduces the predicted expression of the APOA1 transcript in heart tissue. ISM of the reference sequence suggests that the variant disrupts a TATA-like motif. (b) AlphaGenome predictions for the variant chr16:173692:A>G, previously reported to cause Hemoglobin H disease58. The model predicts that the variant strongly reduces the predicted expression of the HBA2 transcript. ISM of the reference sequence suggests that the variant disrupts the polyadenylation hexamer. (c) AlphaGenome predictions for the variant chr17:44001600:C>A, previously reported to result in reduced binding of HNF1, underexpression of NAGS and ultimately N-acetylglutamate Synthase Deficiency59. AlphaGenome predicts reduced binding of HNF1A, local DNA accessibility, as well as a strong reduction in expression of the NAGS transcript in liver and related cell types. ISM of the reference sequence suggests that the variant disrupts a HNF1 motif. (d) AlphaGenome predictions for the variant chrX:55028202:A>G, previously reported to result in reduced GATA binding and reduced expression of ALAS2, thereby possibly causing Sideroblastic Anemia60. The model predicts reduced binding of GATA factors (GATA2 shown), as well as TAL1, and drastically reduced expression of the ALAS2 transcript in K562. ISM of the reference sequence suggests that the variant disrupts a GATA-TAL composite motif. (e) AlphaGenome predictions for the variant chr5:1295046:T>G, previously reported to cause TERT overexpression associated with malignant melanoma61. AlphaGenome predicts increased binding of ETS factors (ELF1 shown) and an increase in TERT expression in melanocytes. Comparing the ISM around the reference and alternative alleles suggests that the variant creates an ETS factor binding motif. The phyloP62 score for this position is −3.29, consistent with the fact that gain-of-function variants can occur in fast-evolving parts of the genome. (f) AlphaGenome predictions for the variant chr11:5254983:G>C, previously implicated in hereditary persistence of fetal hemoglobin63. The model predicts increased CTCF binding, as well as increased HBG2 expression (shown for CD14+ monocytes). Comparing the ISM around the reference and alternative alleles suggests that the variant creates a CTCF binding motif. The phyloP score for this position is −0.67, indicating that the variant position is under relatively neutral selection (given the low magnitude of the score). (g) AlphaGenome predictions for the variant rs12740374, previously found to be associated with low-density lipoprotein cholesterol levels64. Additionally, the variant is a plasma pQTL for CELSR2, as well as a GTEx eQTL for CELSR2 and PSRC117,65. Consistent with the observed molecular QTL effects, AlphaGenome predicts increased expression of both of these genes in liver tissue. Moreover the model predicts increased CEBP binding on the alternative allele. Comparing the ISM around the reference and alternative alleles suggests that the variant creates a CEBP binding motif. The phyloP score for this position is −0.20, indicating that the variant position is under relatively neutral selection (given the low magnitude of the score). (h) AlphaGenome predictions for the variant rs570639864, previously found to be associated with reduced bone mineral density66. AlphaGenome predicts decreased binding of JUN/FOS factors (JUNB shown), as well as a strong reduction in expression of WNT7B, a gene implicated in bone formation67. ISM of the reference sequence suggests that the variant disrupts a JUN/FOS motif. (i) AlphaGenome predictions for the variant chrX:101386224:T>C, previously reported to result in a lack of functional BTK and causing X-linked Agammaglobulinemia (OMIM #300755). The model predicts reduced binding of SPI1 at the BTK promoter, diminished local DNA accessibility, as well as a reduction in expression of the BTK transcript in B & lymphoblastoid cells. ISM of the reference sequence suggests that the variant disrupts a SPI-like motif (SPI1.H13.0.PB shown). Also shown is the 100-vertebrate PhyloP conservation track, which shows high conservation around the variant.
Extended Data Fig. 9 Interpreting trait-affecting variants using AlphaGenome. (a) AlphaGenome predictions for the variant chr11:116837649:T>G, previously reported to result in underexpression of APOA1 and Hypoalphalipoproteinemia57. The variant strongly reduces the predicted expression of the APOA1 transcript in heart tissue. ISM of the reference sequence suggests that the variant disrupts a TATA-like motif. (b) AlphaGenome predictions for the variant chr16:173692:A>G, previously reported to cause Hemoglobin H disease58. The model predicts that the variant strongly reduces the predicted expression of the HBA2 transcript. ISM of the reference sequence suggests that the variant disrupts the polyadenylation hexamer. (c) AlphaGenome predictions for the variant chr17:44001600:C>A, previously reported to result in reduced binding of HNF1, underexpression of NAGS and ultimately N-acetylglutamate Synthase Deficiency59. AlphaGenome predicts reduced binding of HNF1A, local DNA accessibility, as well as a strong reduction in expression of the NAGS transcript in liver and related cell types. ISM of the reference sequence suggests that the variant disrupts a HNF1 motif. (d) AlphaGenome predictions for the variant chrX:55028202:A>G, previously reported to result in reduced GATA binding and reduced expression of ALAS2, thereby possibly causing Sideroblastic Anemia60. The model predicts reduced binding of GATA factors (GATA2 shown), as well as TAL1, and drastically reduced expression of the ALAS2 transcript in K562. ISM of the reference sequence suggests that the variant disrupts a GATA-TAL composite motif. (e) AlphaGenome predictions for the variant chr5:1295046:T>G, previously reported to cause TERT overexpression associated with malignant melanoma61. AlphaGenome predicts increased binding of ETS factors (ELF1 shown) and an increase in TERT expression in melanocytes. Comparing the ISM around the reference and alternative alleles suggests that the variant creates an ETS factor binding motif. The phyloP62 score for this position is −3.29, consistent with the fact that gain-of-function variants can occur in fast-evolving parts of the genome. (f) AlphaGenome predictions for the variant chr11:5254983:G>C, previously implicated in hereditary persistence of fetal hemoglobin63. The model predicts increased CTCF binding, as well as increased HBG2 expression (shown for CD14+ monocytes). Comparing the ISM around the reference and alternative alleles suggests that the variant creates a CTCF binding motif. The phyloP score for this position is −0.67, indicating that the variant position is under relatively neutral selection (given the low magnitude of the score). (g) AlphaGenome predictions for the variant rs12740374, previously found to be associated with low-density lipoprotein cholesterol levels64. Additionally, the variant is a plasma pQTL for CELSR2, as well as a GTEx eQTL for CELSR2 and PSRC117,65. Consistent with the observed molecular QTL effects, AlphaGenome predicts increased expression of both of these genes in liver tissue. Moreover the model predicts increased CEBP binding on the alternative allele. Comparing the ISM around the reference and alternative alleles suggests that the variant creates a CEBP binding motif. The phyloP score for this position is −0.20, indicating that the variant position is under relatively neutral selection (given the low magnitude of the score). (h) AlphaGenome predictions for the variant rs570639864, previously found to be associated with reduced bone mineral density66. AlphaGenome predicts decreased binding of JUN/FOS factors (JUNB shown), as well as a strong reduction in expression of WNT7B, a gene implicated in bone formation67. ISM of the reference sequence suggests that the variant disrupts a JUN/FOS motif. (i) AlphaGenome predictions for the variant chrX:101386224:T>C, previously reported to result in a lack of functional BTK and causing X-linked Agammaglobulinemia (OMIM #300755). The model predicts reduced binding of SPI1 at the BTK promoter, diminished local DNA accessibility, as well as a reduction in expression of the BTK transcript in B & lymphoblastoid cells. ISM of the reference sequence suggests that the variant disrupts a SPI-like motif (SPI1.H13.0.PB shown). Also shown is the 100-vertebrate PhyloP conservation track, which shows high conservation around the variant.CC BY · PubMed Central

Verification

Claims the paper makes

The claims and statistics of this paper haven’t been checked yet.

Run the check — free, no account needed. It reads the open-access text and checks the sources it cites.

A few free checks a day · papers already verified open instantly · results are public

Self-check

Percentages, sums and reported differences re-computed from the paper’s own numbers.

The self-check needs the paper’s full text.

Citations

Cites

Show all 110 references

Research works printed but not linked: 12

  1. GTEx Consortium. The GTEx Consortium atlas of genetic regulatory effects across human tissues. Science 369, 1318–1330 (Sept. 2020). Cited on pages 5, 19, 48, 49.
  2. Ioffe, S. & Szegedy, C . Batch normalization: Accelerating deep network training by reducing internal covariate shift in International conference on machine learning (2015), 448–456. Cited on page 26.
  3. Brock, A. , De, S. & Smith, S. L. Characterizing signal propagation to close the performance gap in unnormal- ized ResNets in International Conference on Learning Representations (Oct. 2020). Cited on page 26.
  4. Shazeer, N . Fast transformer decoding: One write-head is all you need. arXiv preprint arXiv:1911.02150 (2019). Cited on page 27. · arXiv
  5. Gschwind, A. R. et al. An encyclopedia of enhancer-gene regulatory interactions in the human genome. bioRxiv (2023). Cited on pages 75, 76.
  6. 10.1038/s41586023-06592-6 · DOI
  7. Ling, J. P. et al. ASCOT identifies key regulators of neuronal subtype-specific splicing. Nature communications 11, 137 (2020). Cited on page 82. · DOI · Paper page
  8. 10.1016/J.CELL.2018.12.015 · DOI · Paper page
  9. 10.1093/nar/gkw1055 · DOI
  10. Benegas, G. , Eraslan, G. & Song, Y. S . Benchmarking dna sequence models for causal regulatory variant prediction in human genetics. bioRxiv (2025). Cited on page 96. · DOI
  11. 2019, Saturation mutagenesis of twenty disease-associated regulatory elements at single base-pair resolution, Nature communications, 10, 3583, 10.1038/s41467-019-11526-w · DOI · Paper page
  12. 10.1002/humu.23797 · DOI

Cited by

Sorted by citations

See all 450

Metadata

Authors
Avsec, Ž., Latysheva, N., Cheng, J., Novati, G., Taylor, K. R., Ward, T., Bycroft, C., Nicolaisen, L., Arvaniti, E., Pan, J., Thomas, R., Dutordoir, V., Perino, M., De, S., Karollus, A., Gayoso, A., Sargeant, T., Mottram, A., Wong, L. H., Drotár, P., Kosiorek, A., Senior, A., Tanburn, R., Applebaum, T., Basu, S., Hassabis, D., & Kohli, P.
Affiliations
Google DeepMind (United Kingdom) (GB)
Corresponding author
Kohli, Pushmeet
Venue
Nature
Publisher
openRxiv
Published
2025-06-27
Volume
649
Issue
8099
Pages
1206-1218
ISSN
0028-0836 (ISSN-L)
OpenAlex
W7125967877
Cited by
395
References
110
Citations by year
2026: 352 · 2025: 43
FWCI
729.58
Type
journal article
Language
en
Open access
Locations
  • Nature (publishedVersion, cc-by)
  • bioRxiv (Cold Spring Harbor Laboratory) (acceptedVersion, cc-by-nc)
  • Europe PMC (PubMed Central) (publishedVersion, cc-by)
  • PubMed (publishedVersion)
  • PubMed Central (publishedVersion, cc-by)
Topics
  • Life Sciences › Biochemistry, Genetics and Molecular Biology › Molecular Biology › Genomics and Chromatin Dynamics
  • Life Sciences › Biochemistry, Genetics and Molecular Biology › Genetics › Genetic Associations and Epidemiology
  • Life Sciences › Biochemistry, Genetics and Molecular Biology › Genetics › Genomics and Rare Diseases
Keywords
AlphaGenome, variant effect prediction, gene expression prediction, transcription initiation, chromatin accessibility, histone modifications, transcription factor binding, chromatin contact maps, single base pair resolution, regulatory variants, human and mouse genomes
MeSH terms
Deep Learning, Animals, Chromatin, Gene Expression Regulation, Humans, Models, Genetic, Proto-Oncogene Proteins, Transcription Factors, Genetic Variation, Genome, Human, Genome, Sequence Analysis, DNA, RNA Splice Sites, Genomics, Mice

About these checks

Registry, retraction, Cites and statistics results are computed, not judged, with one exception: a printed reference that no index lists is read once by a model before it counts as a citation error. Claims are extracted by a model and kept only when their quote appears verbatim in the text; each cited source is then checked, with a model’s help, for whether it says what the claim relies on. Those verdicts can be wrong — read the claim’s quote and the cited source before relying on one.

Statistics and arithmetic are recomputed, not judged.

Confidence bands are shown only for fields calibrated on our annotated test set. None is calibrated yet, so no band is shown.

What counts as a claim ›How we measure confidence ›How we check this ›

Are you an author, or do you see a problem with this page? Request a review