

The DOI matches its Crossref record; 1 of the 1 references it cites were found in a registry or an index.
Protein Embeddings and Local Alignments
Open accessPreprint — published as 10.1016/j.csbj.2025.12.002 · Paper page
Abstract
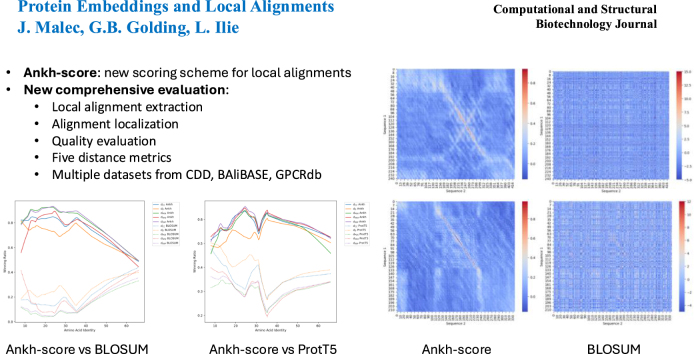
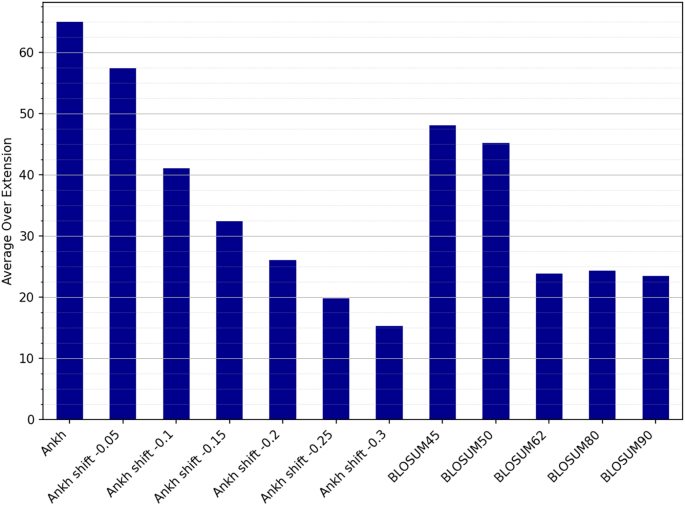
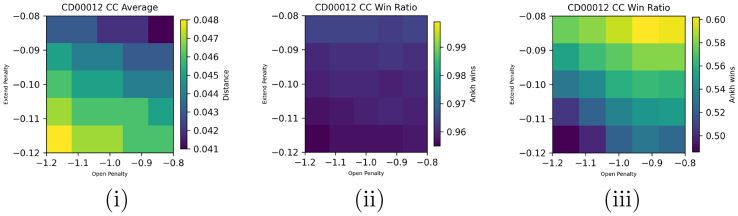
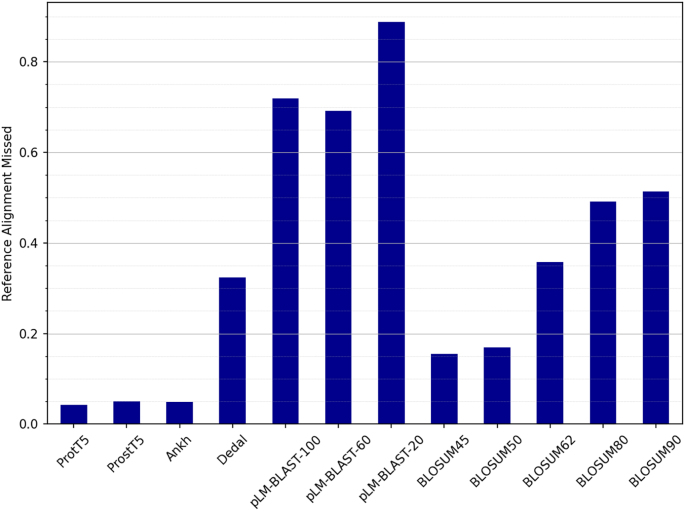
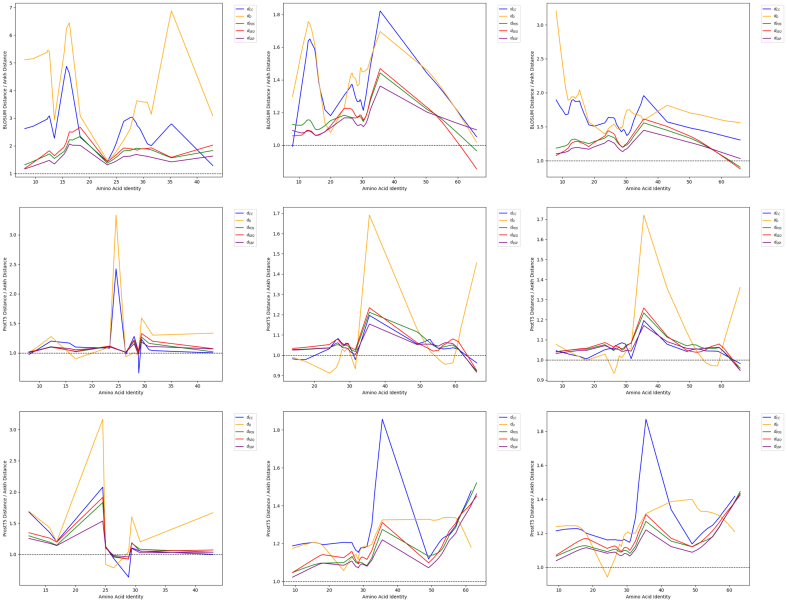
Background: The advent of protein embeddings has revolutionized bioinformatics by providing contextual representations that capture functional and evolutionary patterns. They have become, alongside sequence alignments, the cornerstone of bioinformatics. While embeddings cannot replace alignments, they can greatly help improving their quality. Our goal is replacing the BLOSUM matrices, the decades-old standard scoring system for protein alignment, with an embedding-based scoring method. Results: We introduce a new scoring function and algorithm for local alignment of protein sequences, we offer a new comprehensive framework for evaluating local alignments. The score between two residues is given by the cosine similarity of their Ankh-embedding vectors and the algorithm uses dynamic programming with affine penalty. For the evaluation, we built multiple datasets, using both natural and inserted sequences, from the Conserved Domain Database, BAL-iBASE, and GPCRdb, designed a new algorithm for local alignment extraction, localization and quality evaluation, and employed five distance metrics to evaluate the similarity with the true alignment. We performed nearly one and a half million tests to compare the new algorithm with the best BLOSUM matrices, specialized GPCRtm matrices, and top programs, such as PEbA, ProtT5-score, DEDAL, vcMSA and pLM-BLAST. Regarding the protein embedding models, Ankh not only surpasses the best combination of ProtT5 and ESM2, but appears to better understand the “language” of proteins, as it behaves much better on natural sequences compared to artificial ones obtained by inserting domains in random protein sequences. Also, while ProtT5 and ESM2 combine to produce better results, Ankh does not combine well with other embeddings. Conclusions: The new Ankh-score-based program is vastly superior to the BLOSUM matrices and clearly superior to all existing methods. New light shed on the protein embeddings can guide future improvements. In order to facilitate the use of the new method and protocol, they are freely available as a web server at e-score.csd.uwo.ca and as source code at github.com/lucian-ilie/E-score .
Overview
The claims and statistics of this paper haven’t been checked yet.
Run the check — free, no account needed. It reads the open-access text and checks the sources it cites.
Integrity signals
Registry
Cites
Statistics
Figures
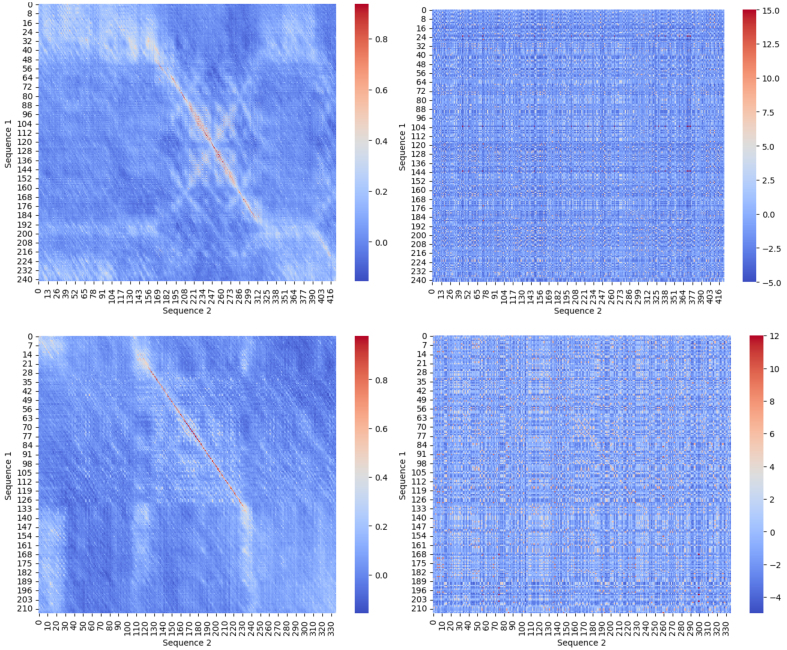
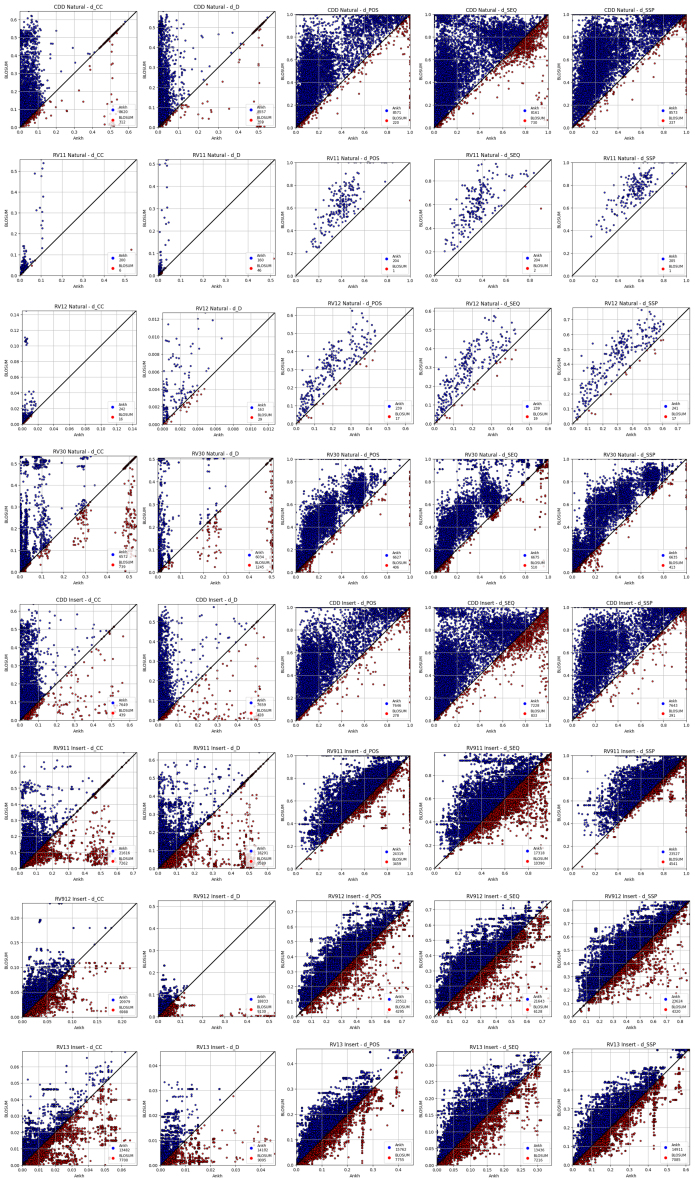
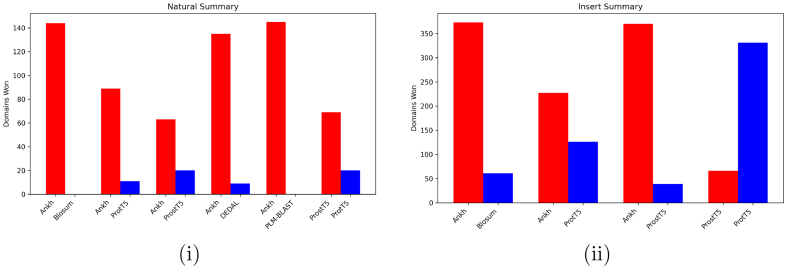
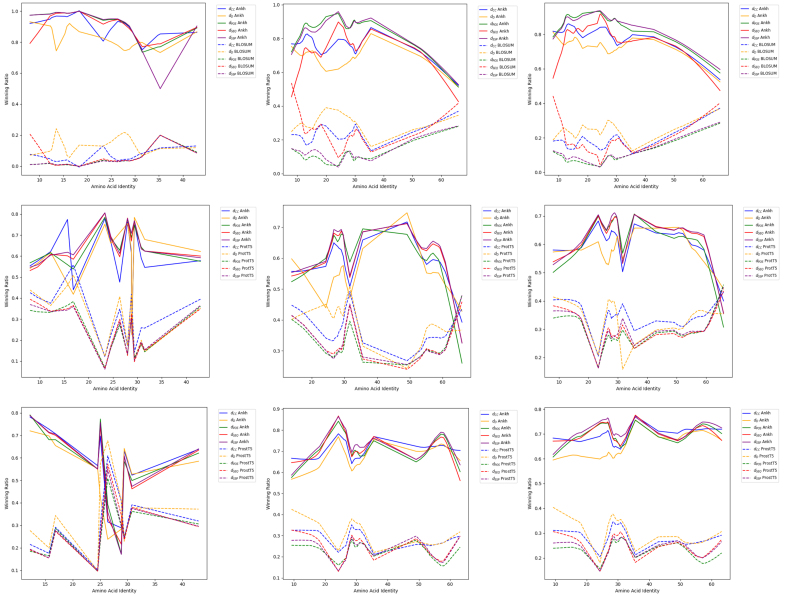
Verification
Claims the paper makes
The claims and statistics of this paper haven’t been checked yet.
Run the check — free, no account needed. It reads the open-access text and checks the sources it cites.
Self-check
Percentages, sums and reported differences re-computed from the paper’s own numbers.
The self-check needs the paper’s full text.
Citations
Cites
Highly accurate protein structure prediction with AlphaFold
Jumper, J., Evans, R., Pritzel, A., Green, T., Figurnov, M., Ronneberger, O., Tunyasuvunakool, K., Bates, R., Žídek, A., Potapenko, A., et al. (2021) · Nature · doi:10.1038/s41586-021-03819-2 · Cited by 43,764
Research works printed but not linked: 40
- 10.1038/S41586-024-07487-W · DOI · Paper page
- 10.1006/jmbi.1990.9999 · DOI · Paper page
- 10.1093/nar/25.17.3389 · DOI · Paper page
- 10.1371/journal.pone.0141287 · DOI
- 2024, Scoring alignments by embedding vector similarity, Briefings in Bioinformatics, 25, bbae178, 10.1093/bib/bbae178 · DOI
- 10.1093/bioinformatics/btr701 · DOI
- 1978, 22 a model of evolutionary change in proteins, Atlas of protein sequence and structure, 5, 345
- Devlin J , Chang MW , Lee K , Toutanova K. Bert: Pre-training of deep bidirectional transformers for language understanding. arXiv preprint arXiv:181004805. 2018;.
- Elnaggar A , Essam H , Salah-Eldin W , Moustafa W , Elkerdawy M , Rochereau C , et al. Ankh: Optimized protein language model unlocks general-purpose modelling. arXiv preprint arXiv:230106568. 2023;. · DOI
- 2021, Prottrans: Toward understanding the language of life through self-supervised learning, IEEE transactions on pattern analysis and machine intelligence, 44, 7112
- 2021, Structure-based protein function prediction using graph convolutional networks, Nature communications, 12, 3168, 10.1038/s41467-021-23303-9 · DOI
- 10.1016/0022-2836(82)90398-9 · DOI
- 10.1186/s12859-019-2669-9 · DOI
- 10.1073/pnas.89.22.10915 · DOI · Paper page
- 2024, Seq-InSite: sequence supersedes structure for protein interaction site prediction, Bioinformatics, 40, btad738, 10.1093/bioinformatics/btad738 · DOI · Paper page
- 10.1186/s12859-024-05699-5 · DOI · Paper page
- 10.1093/bioinformatics/btad579 · DOI
- 10.1093/bioinformatics/btz595 · DOI
- 10.1093/bib/bbab502 · DOI
- 2022, Protein structure prediction improves the quality of amino-acid sequence alignment, Proteins: Structure, Function, and Bioinformatics, 90, 2144, 10.1002/prot.26392 · DOI
- Liu Y , Ott M , Goyal N , Du J , Joshi M , Chen D , et al. Roberta: A robustly optimized bert pretraining approach. arXiv preprint arXiv:190711692. 2019;.
- 2023, Deep embedding and alignment of protein sequences, Nature methods, 20, 104, 10.1038/s41592-022-01700-2 · DOI · Paper page
- 10.1016/j.jmb.2023.167963 · DOI
- 10.1093/nar/gku1221 · DOI
- 10.1101/gr.277675.123 · DOI
- Mikolov T , Chen K , Corrado G , Dean J. Efficient estimation of word representations in vector space. arXiv preprint arXiv:13013781. 2013;.
- Nambiar A , Heflin M , Liu S , Maslov S , Hopkins M , Ritz A. Transforming the language of life: transformer neural networks for protein prediction tasks. In: Proceedings of the 11th ACM international conference on bioinformatics, computational biology and health informatics; 2020. p. 1–8. · DOI
- 10.1093/nar/gkab852 · DOI
- Pennington J , Socher R , Manning CD . Glove: Global vectors for word representation. In: Proceedings of the 2014 conference on empirical methods in natural language processing (EMNLP); 2014. p. 1532–1543. · DOI · Paper page
- Peters ME , Neumann M , Iyyer M , Gardner M , Clark C , Lee K , et al. Deep contextualized word representations. arXiv:180205365. 2018;. · DOI · Paper page
- Raffel C , Shazeer N , Roberts A , Lee K , Narang S , Matena M , et al. Exploring the Limits of Transfer Learning with a Unified Text-to-Text Transformer. arXiv preprint arXiv:191010683. 2020;.
- 10.1016/j.sbi.2023.102539 · DOI
- Rao RM , Liu J , Verkuil R , Meier J , Canny J , Abbeel P , et al. MSA transformer. In: International Conference on Machine Learning PMLR; 2021. p. 8844–8856. · DOI · Paper page
- 10.1073/pnas.2016239118 · DOI · Paper page
- 10.1038/s41586-019-1923-7 · DOI · Paper page
- 10.1016/0022-2836(81)90087-5 · DOI
- 2005, BAliBASE 3.0: latest developments of the multiple sequence alignment benchmark, Proteins: Structure, Function, and Bioinformatics, 61, 127, 10.1002/prot.20527 · DOI
- 10.1093/nar/gky092 · DOI
- 10.1073/pnas.1914677117 · DOI · Paper page
- Yang Z , Dai Z , Yang Y , Carbonell J , Salakhutdinov RR, L. QV. XLNet: Generalized autoregressive pretraining for language understanding. Advances in neural information processing systems. 2019;32.
Metadata
- Authors
- Malec, J., Golding, G. B., & Ilie, L.
- Affiliations
- Western University (CA)
- McMaster University (CA)
- Corresponding author
- Ilie, Lucian
- Venue
- Computational and Structural Biotechnology Journal
- Publisher
- openRxiv
- Published
- 2025-07-27
- Volume
- 31
- Pages
- 24-37
- ISSN
- 2001-0370 (ISSN-L)
- PMC
- PMC12769827
- OpenAlex
- W4417105621
- Cited by
- 5
- References
- 1
- Citations by year
- 2026: 5
- FWCI
- 1.50
- Type
- journal article
- Language
- en
- Open access
- gold
- doi.org
- Licence
- Locations
- Computational and Structural Biotechnology Journal (publishedVersion, cc-by-nc-nd)
- bioRxiv (Cold Spring Harbor Laboratory) (acceptedVersion, cc-by-nc-nd)
- PubMed (publishedVersion)
- PubMed Central (publishedVersion, cc-by-nc-nd)
- DOAJ (DOAJ: Directory of Open Access Journals) (submittedVersion)
- Funders
- Natural Sciences and Engineering Research Council (RGPIN 2021-03978, RGPIN-2020-05733)
- Topics
- Life Sciences › Biochemistry, Genetics and Molecular Biology › Molecular Biology › Genomics and Phylogenetic Studies
- Life Sciences › Biochemistry, Genetics and Molecular Biology › Molecular Biology › Machine Learning in Bioinformatics
- Life Sciences › Biochemistry, Genetics and Molecular Biology › Molecular Biology › Fractal and DNA sequence analysis
- Keywords
- protein embeddings, local alignment, protein language models, BAliBASE, GPCRdb
About these checks
Registry, retraction, Cites and statistics results are computed, not judged, with one exception: a printed reference that no index lists is read once by a model before it counts as a citation error. Claims are extracted by a model and kept only when their quote appears verbatim in the text; each cited source is then checked, with a model’s help, for whether it says what the claim relies on. Those verdicts can be wrong — read the claim’s quote and the cited source before relying on one.
Statistics and arithmetic are recomputed, not judged.
Confidence bands are shown only for fields calibrated on our annotated test set. None is calibrated yet, so no band is shown.
What counts as a claim ›How we measure confidence ›How we check this ›
Are you an author, or do you see a problem with this page? Request a review
