PreprintCited by 5RNA Research and SplicingEstrogen and related hormone effectsCancer-related molecular mechanisms research

The DOI matches its Crossref record; 1 of the 1 references it cites were found in a registry or an index.

E2-Regulated Transcriptome Complexity Revealed by Long-Read Direct RNA Sequencing: From Isoform Discovery to Truncated Proteins

Open access
Dioken, Didem Naz, Ozgul, Ibrahim, Yilmazbilek, Irem, Almeric, Elanur, Eroglu, Irem Cemile, Cicek, Mustafa, Yilmaz, Utku Cem, Karagozoglu, Deniz, Cicek, Esra, Karaca, Ezgi, Can, Tolga, Erson-Bensan, Ayse Elif·2025·RNA Biology

Preprint — published as 10.1080/15476286.2025.2563860

Abstract

Estrogen receptor alpha (ERα)-positive (ER+) breast cancers are driven by 17β-estradiol (E2) binding to ERα, which transcriptionally regulates downstream target genes. Although microarrays and conventional RNA sequencing have identified E2 target genes, pre-designed probes and short read lengths are limited in accurately capturing complex transcript structures. Long-read RNA sequencing offers a solution by spanning entire transcripts, providing a more complete view of the transcriptome. Here, we employed nanopore long-read direct RNA sequencing (DRS) complemented with 3’-end sequencing, in vitro experiments, and deep learning-based protein modeling to explore the intricate landscape of E2-responsive transcriptome and protein level implications. Our analysis revealed a range of E2-responsive non-coding and coding isoforms, including intronically polyadenylated (IPA) mRNAs. One of these IPA isoforms was detected for TLE1 (Transducin-like enhancer protein 1), which positively assists ERα-chromatin interactions for a subset of E2 target genes. The IPA isoform produces a C-terminus truncated protein, lacking the WDR interaction domain, but retains dimerization/tetramerization capacity through its intact N-terminus Q-domain. Structural modeling and protein-based assays confirmed the truncated protein’s dimerization potential and nuclear localization. Functional assays showed that overexpression of truncated TLE1 reduces the E2-induced upregulation of GREB1 , an E2-responsive gene, thereby disrupting transcriptional regulation. Importantly, a lower IPA isoform ratio is associated with worse survival in ER+ patients, highlighting clinical relevance. Our study uncovers new layers of complexity in the E2-regulated transcriptome, providing insights into truncated proteins. These findings contribute to a deeper understanding of gene regulation and may help the development of new therapeutic strategies.

Overview

The claims and statistics of this paper haven’t been checked yet.

Run the check — free, no account needed. It reads the open-access text and checks the sources it cites.

A few free checks a day · papers already verified open instantly · results are public

Integrity signals

Registry

Crossref · 10.1101/2025.07.31.667732

Cites

1 of 1 references verified0 citation errors · 0 not checkable

Statistics

Figures

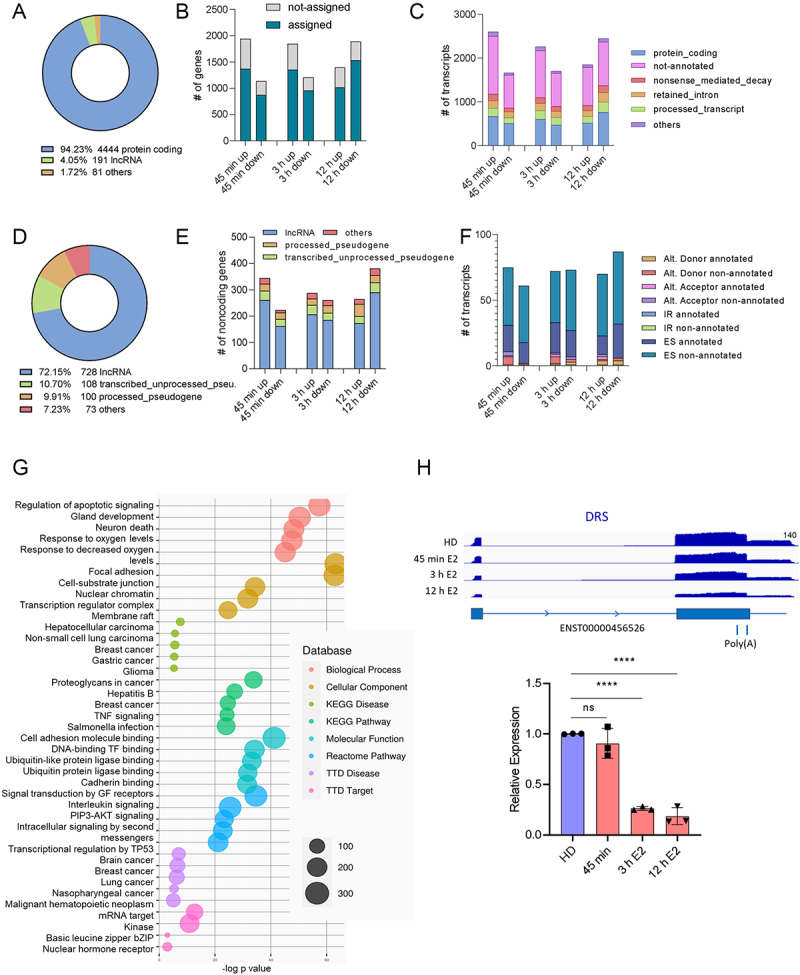
Figure 1. A. Differentially expressed gene categories (TPM > 10 at any time point, fc > 1.5, fc < 0.6) compared with the hormone-deprived control, B. The number of upregulated (fc > 1.5) and downregulated (fc < 0.6) genes at 45 min, 3 h, and 12 h of E2 treatment. Blue bars represent genes assigned to ENSEMBL genes, while grey bars indicate reads that were not assigned a gene ID, C. Upregulated and downregulated transcripts at different time points. Transcripts are classified according to ENSEMBL biotype, represented by distinct colours, D. Categories of differentially expressed non-coding transcripts (TPM > 2 at any time point), E. The number of upregulated and downregulated non-coding gene types, F. Types of splicing events for ncRnas captured by FLAIR, G. RNAenrich analysis of differentially expressed ncRNA genes, Benjamini-Hochberg (FRD) adjustment, p < 0.05), H. IGV visualization of DRS reads for lncGATA3–7 (top), RT-qPCR confirmation of lnc-GATA3–7 downregulation upon E2 stimulation compared with hormone-deprived (HD) MCF7 cells. Expression levels were normalized using RPLP0 as the reference gene (n = 3 independent E2 treatments, statistical significance was evaluated by one-way ANOVA, with **** p < 0.0001, ns: not significant).
Figure 1. A. Differentially expressed gene categories (TPM > 10 at any time point, fc > 1.5, fc < 0.6) compared with the hormone-deprived control, B. The number of upregulated (fc > 1.5) and downregulated (fc < 0.6) genes at 45 min, 3 h, and 12 h of E2 treatment. Blue bars represent genes assigned to ENSEMBL genes, while grey bars indicate reads that were not assigned a gene ID, C. Upregulated and downregulated transcripts at different time points. Transcripts are classified according to ENSEMBL biotype, represented by distinct colours, D. Categories of differentially expressed non-coding transcripts (TPM > 2 at any time point), E. The number of upregulated and downregulated non-coding gene types, F. Types of splicing events for ncRnas captured by FLAIR, G. RNAenrich analysis of differentially expressed ncRNA genes, Benjamini-Hochberg (FRD) adjustment, p < 0.05), H. IGV visualization of DRS reads for lncGATA3–7 (top), RT-qPCR confirmation of lnc-GATA3–7 downregulation upon E2 stimulation compared with hormone-deprived (HD) MCF7 cells. Expression levels were normalized using RPLP0 as the reference gene (n = 3 independent E2 treatments, statistical significance was evaluated by one-way ANOVA, with **** p < 0.0001, ns: not significant).CC BY-NC · PubMed Central
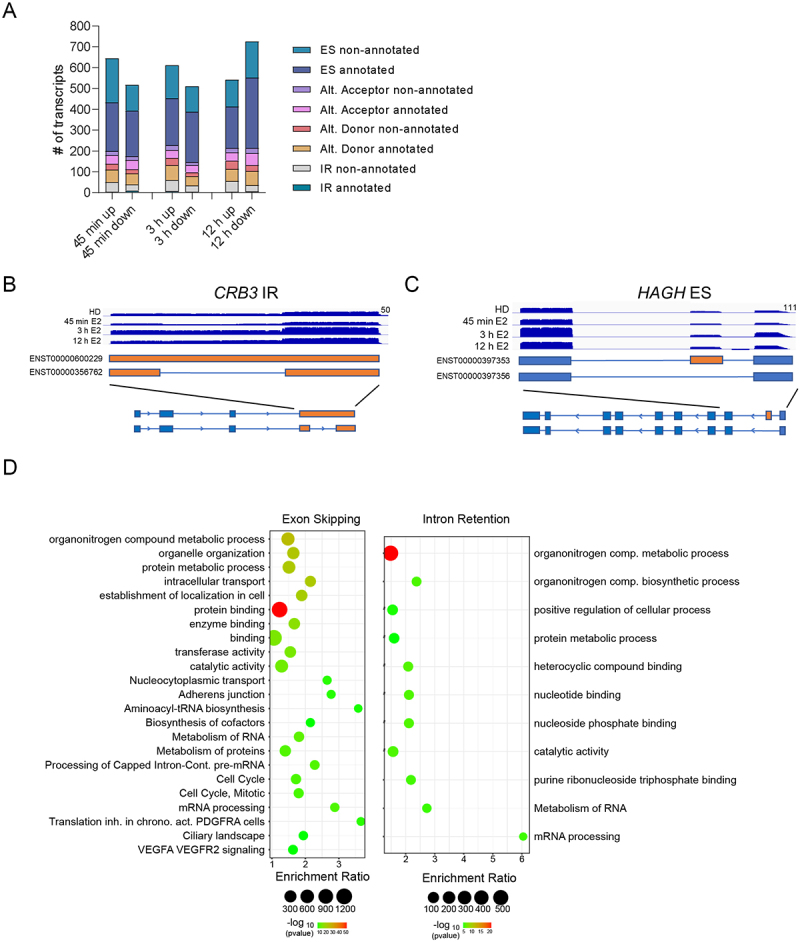
Figure 2. A. Number of up or down-regulated alternative transcripts upon E2 stimulation. Events are indicated in the key and as coloured bars, B. IGV visualization of DRS reads capturing an isoform with intron retention (IR) for CRB3, C. IGV visualization of DRS reads capturing an isoform with exon skipping (ES) for HAGH, D. Gene ontology enrichment analysis for ES and IR groups. Enriched biological processes and molecular functions are shown as bubble plots. The x-axis represents the enrichment ratio; the y-axis lists the top enriched terms. The size of each bubble corresponds to the number of genes associated with the term, and the colour represents the significance level (-log10 of the p-value).
Figure 2. A. Number of up or down-regulated alternative transcripts upon E2 stimulation. Events are indicated in the key and as coloured bars, B. IGV visualization of DRS reads capturing an isoform with intron retention (IR) for CRB3, C. IGV visualization of DRS reads capturing an isoform with exon skipping (ES) for HAGH, D. Gene ontology enrichment analysis for ES and IR groups. Enriched biological processes and molecular functions are shown as bubble plots. The x-axis represents the enrichment ratio; the y-axis lists the top enriched terms. The size of each bubble corresponds to the number of genes associated with the term, and the colour represents the significance level (-log10 of the p-value).CC BY-NC · PubMed Central
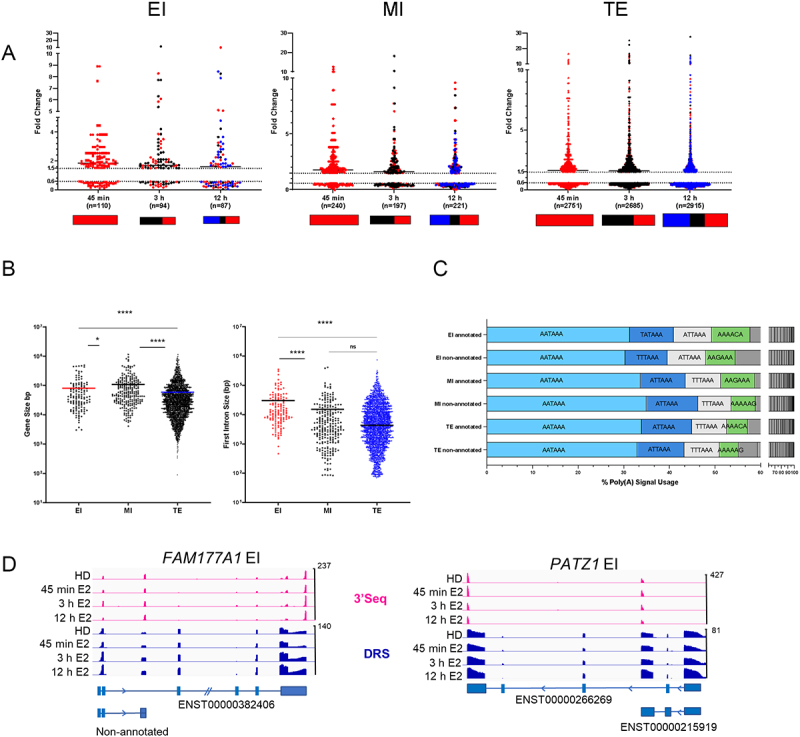
Figure 3. A. EI, MI, and TE groups of upregulated ( > 1.5 Fold) and downregulated ( < 0.6 Fold) transcripts identified by DRS. Red, black, and blue dots/boxes indicate transcripts significantly altered at 45 min, 3 h, and 12 h, B. Gene size (left) and early intron (first or second introns) size (right) of upregulated EI, MI, and TE genes. Horizontal bars indicate median values (Kruskal-Wallis, multiple pairwise comparisons, *p < 0.05, ****p < 0.0001, ns: not significant), C. One or more common polyadenylation signals were detected for the annotated and non-annotated EI, MI, and TE genes, D. IGV display of DRS and 3’seq reads showing IPA and FL transcripts of FAM177A1 and PATZ1.
Figure 3. A. EI, MI, and TE groups of upregulated ( > 1.5 Fold) and downregulated ( < 0.6 Fold) transcripts identified by DRS. Red, black, and blue dots/boxes indicate transcripts significantly altered at 45 min, 3 h, and 12 h, B. Gene size (left) and early intron (first or second introns) size (right) of upregulated EI, MI, and TE genes. Horizontal bars indicate median values (Kruskal-Wallis, multiple pairwise comparisons, *p < 0.05, ****p < 0.0001, ns: not significant), C. One or more common polyadenylation signals were detected for the annotated and non-annotated EI, MI, and TE genes, D. IGV display of DRS and 3’seq reads showing IPA and FL transcripts of FAM177A1 and PATZ1.CC BY-NC · PubMed Central
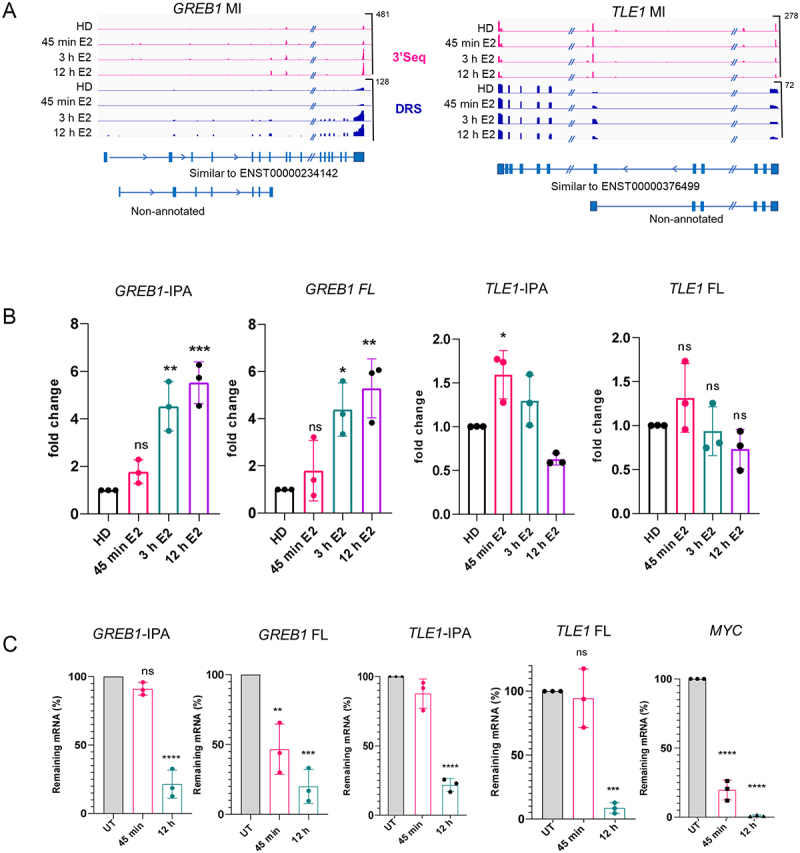
Figure 4. A. IGV display of 3’seq and DRS reads and transcripts defined by FLAIR. In addition to the full-length mRNAs, intronically terminated isoforms of GREB1 and TLE1 were detected, B. RT-qPCR for the expression of IPA and FL isoforms of GREB1 and TLE1 upon E2 stimulation relative to hormone-deprived (HD) MCF7 cells. Expression levels of isoforms were normalized to the expression of the reference gene, RPLP0. Normalized expression in HD cells was set to 1. Data represent three independent E2 treatments. One-way ANOVA with Tukey’s multiple comparison test was used, ns: not significant, *p < 0.05, **p < 0.01, ***p < 0.001, c. Stabilities of IPA and FL isoforms detected after actinomycin D (10 µg/ml) treatment. RT-qPCR results show the remaining mRNA levels (normalized to RPLP0) at 45 min and 12 h of actinomycin D treatment. MYC is a short-lived mRNA and was used as a positive control for treatment. Data represent the mean (SD) of three independent treatments. One-way ANOVA with Tukey’s multiple comparison test was used, ns: not significant, **p < 0.01, ***p < 0.001 and ****p < 0.0001.
Figure 4. A. IGV display of 3’seq and DRS reads and transcripts defined by FLAIR. In addition to the full-length mRNAs, intronically terminated isoforms of GREB1 and TLE1 were detected, B. RT-qPCR for the expression of IPA and FL isoforms of GREB1 and TLE1 upon E2 stimulation relative to hormone-deprived (HD) MCF7 cells. Expression levels of isoforms were normalized to the expression of the reference gene, RPLP0. Normalized expression in HD cells was set to 1. Data represent three independent E2 treatments. One-way ANOVA with Tukey’s multiple comparison test was used, ns: not significant, *p < 0.05, **p < 0.01, ***p < 0.001, c. Stabilities of IPA and FL isoforms detected after actinomycin D (10 µg/ml) treatment. RT-qPCR results show the remaining mRNA levels (normalized to RPLP0) at 45 min and 12 h of actinomycin D treatment. MYC is a short-lived mRNA and was used as a positive control for treatment. Data represent the mean (SD) of three independent treatments. One-way ANOVA with Tukey’s multiple comparison test was used, ns: not significant, **p < 0.01, ***p < 0.001 and ****p < 0.0001.CC BY-NC · PubMed Central
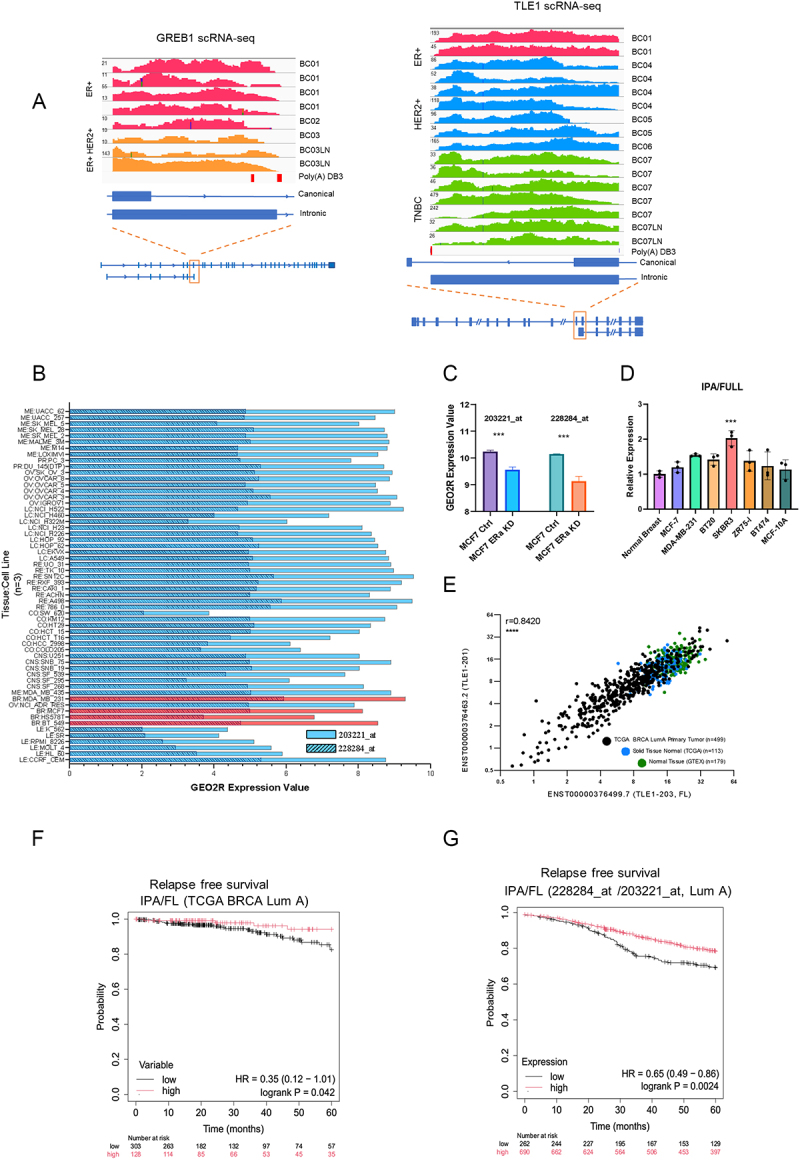
Figure 5. A. Analysis of single-cell RNA sequencing data of GSE75688 verified the expression of IPA isoforms of TLE1 and GREB1 in breast cancer cells representing subtypes, B. GEO2R expression data for TLE1-IPA (228284_at probe set) and FL isoforms (203221_at probe set) in NCI-60 cancer cell line data (GSE32474, GPL570). Red bars indicate breast cancer cell lines, C. Probe sets specific to IPA (228284_at) and FL (203221_at) in control cells compared with ER knockdown (KD) MCF7 cells (GSE27473) (***p < 0.001, students t-test), D. IPA/FL ratios were determined in breast cancer cell lines by RT-qPCR (n = 3 technical replicates). IPA and FL expression levels were normalized to RPLP0. IPA/FL ratio was normalized to normal breast cDNA sample (from OriGene TissueScan cDNA tissue array) (***p < 0.001, one-way ANOVA), E. TCGA breast cancer dataset showing a positive correlation between the levels of the FL and IPA isoforms of TLE1, F. Kaplan-Meier relapse-free survival curves comparing high- and low-ratio of ENST00000376463.2/ENST00000376499.7 (IPA/FL) TLE1 in TCGA LumA breast cancers (BRCA). High-ratio patients (red) showed better relapse-free survival compared to low-ratio patients (black) (HR = 0.35, log-rank p = 0.042), G. Kaplan–Meier relapse-free survival analysis of LumA breast cancers, classified according to the St. Gallen criteria, was performed using microarray data from the KM-plotter database. Patients were stratified based on the expression ratio of the 228284_at probe set (IPA isoform) to the 203221_at probe set (FL isoform). High-ratio group (red) exhibited better relapse-free survival compared to the low-ratio group (black) (HR = 0.65, log-rank p = 0.0024). Patient numbers and at-risk counts are displayed on the plot.
Figure 5. A. Analysis of single-cell RNA sequencing data of GSE75688 verified the expression of IPA isoforms of TLE1 and GREB1 in breast cancer cells representing subtypes, B. GEO2R expression data for TLE1-IPA (228284_at probe set) and FL isoforms (203221_at probe set) in NCI-60 cancer cell line data (GSE32474, GPL570). Red bars indicate breast cancer cell lines, C. Probe sets specific to IPA (228284_at) and FL (203221_at) in control cells compared with ER knockdown (KD) MCF7 cells (GSE27473) (***p < 0.001, students t-test), D. IPA/FL ratios were determined in breast cancer cell lines by RT-qPCR (n = 3 technical replicates). IPA and FL expression levels were normalized to RPLP0. IPA/FL ratio was normalized to normal breast cDNA sample (from OriGene TissueScan cDNA tissue array) (***p < 0.001, one-way ANOVA), E. TCGA breast cancer dataset showing a positive correlation between the levels of the FL and IPA isoforms of TLE1, F. Kaplan-Meier relapse-free survival curves comparing high- and low-ratio of ENST00000376463.2/ENST00000376499.7 (IPA/FL) TLE1 in TCGA LumA breast cancers (BRCA). High-ratio patients (red) showed better relapse-free survival compared to low-ratio patients (black) (HR = 0.35, log-rank p = 0.042), G. Kaplan–Meier relapse-free survival analysis of LumA breast cancers, classified according to the St. Gallen criteria, was performed using microarray data from the KM-plotter database. Patients were stratified based on the expression ratio of the 228284_at probe set (IPA isoform) to the 203221_at probe set (FL isoform). High-ratio group (red) exhibited better relapse-free survival compared to the low-ratio group (black) (HR = 0.65, log-rank p = 0.0024). Patient numbers and at-risk counts are displayed on the plot.CC BY-NC · PubMed Central
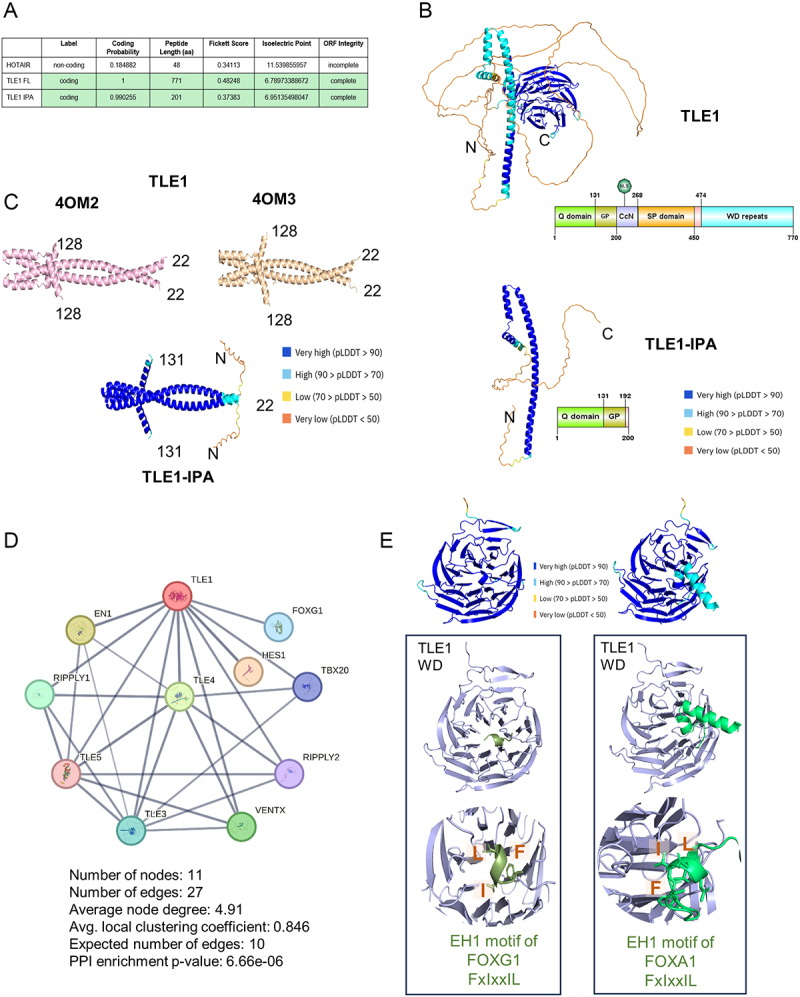
Figure 6. A. Coding potential of TLE1-IPA isoform is similar to TLE1 FL. HOTAIR is a non-coding RNA, calculated by CPC2. B. AF2 protein models of TLE1 and TLE1-IPA, coloured according to AF2 pLDDT confidence scores. Protein domain organizations are provided below, C. Available PDB structures of the TLE1 dimers. The left panel (pink) represents the A and C chains of 40 M2 PDB, and the right panel (wheat) shows the A and C chains of 40 M3 PDB (crystal structure of TLE1 N-terminal Q-domain dimers), the middle panel shows the AF2 model of TLE1 IPA dimers. The pLDDT confidence scores are shown, D. Protein-protein interaction network based on experimental evidence for TLE1. Figure created in the STRING database (STRING consortium 2024), E. FOXG1 is an interactor of TLE1. The left panel shows the predicted model of the canonical TLE1 WDR domain (light blue) and EH1 motif of FOXG1 (green) (18–24) interaction by enhanced AF2 sampling. The confidence scores of the models are presented as colour-coded pLDDT scores. The right panel shows the predicted model of the TLE1 WDR domain (light blue) and FOXA1(lime green) (395–425) harbouring the EH1 motif.
Figure 6. A. Coding potential of TLE1-IPA isoform is similar to TLE1 FL. HOTAIR is a non-coding RNA, calculated by CPC2. B. AF2 protein models of TLE1 and TLE1-IPA, coloured according to AF2 pLDDT confidence scores. Protein domain organizations are provided below, C. Available PDB structures of the TLE1 dimers. The left panel (pink) represents the A and C chains of 40 M2 PDB, and the right panel (wheat) shows the A and C chains of 40 M3 PDB (crystal structure of TLE1 N-terminal Q-domain dimers), the middle panel shows the AF2 model of TLE1 IPA dimers. The pLDDT confidence scores are shown, D. Protein-protein interaction network based on experimental evidence for TLE1. Figure created in the STRING database (STRING consortium 2024), E. FOXG1 is an interactor of TLE1. The left panel shows the predicted model of the canonical TLE1 WDR domain (light blue) and EH1 motif of FOXG1 (green) (18–24) interaction by enhanced AF2 sampling. The confidence scores of the models are presented as colour-coded pLDDT scores. The right panel shows the predicted model of the TLE1 WDR domain (light blue) and FOXA1(lime green) (395–425) harbouring the EH1 motif.CC BY-NC · PubMed Central
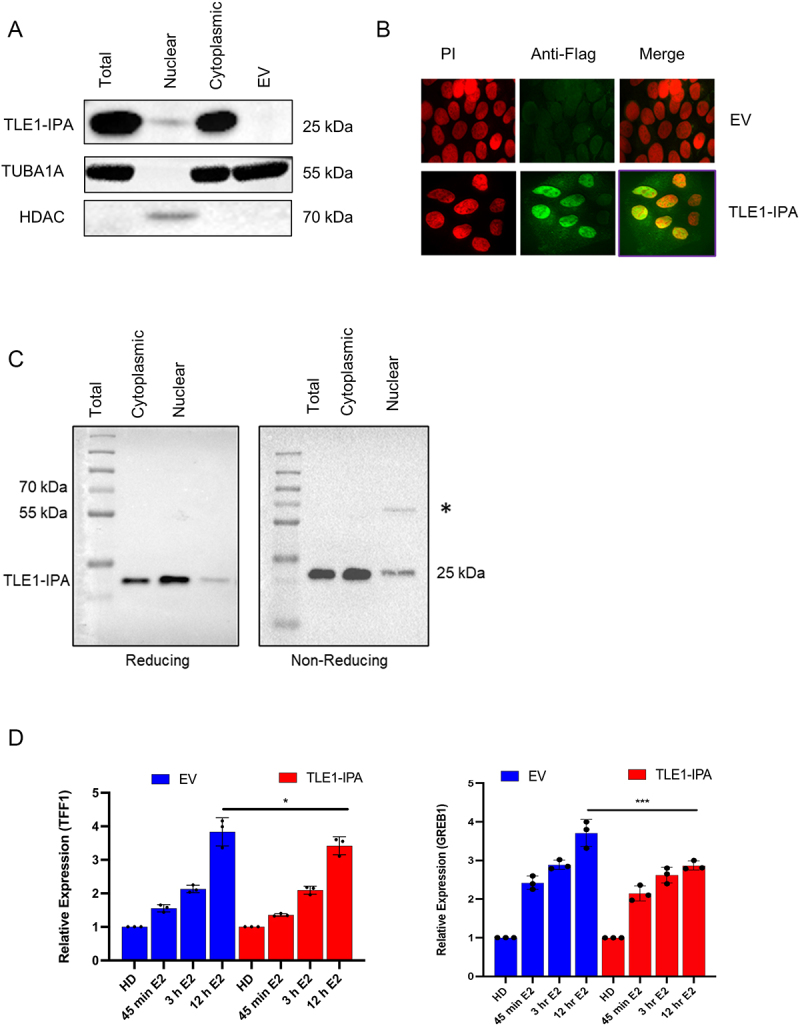
Figure 7. A. Western blot showing expression of C-term truncated, N-Flag-TLE1-IPA in total, nuclear and cytoplasmic lysates of transfected MCF7 cells. The expected product size for TLE1-IPA is 25 kDa. TUBA1A (55 kDa) and HDAC (68 kDa) levels were used as cytoplasmic and nuclear protein controls. EV: empty pcDNA3.1 (-) vector, B. ICC for TLE1 IPA. Flag primary and Alexa Fluor 488 secondary antibodies were used to detect 3X-Flag-TLE1-IPA in transfected MCF7 cells. Propidium iodide was used for nuclear staining. Images were taken with ANDOR AMH200 DSD2 spinning disc microscope (100X) EV: empty vector-transfected cells, C. Reducing and non-reducing western blot for the C-term truncated N-Flag-TLE1-IPA protein. Flag antibody (Sigma F1804) was used to detect 3X-Flag-TLE1-IPA protein (Expected size: 25 kDa), D. RT-qPCR showing E2-induced upregulation of TFF1 and GREB1 in MCF7 cells stably expressing TLE1-IPA compared with control cells (EV: empty vector). Both sets were hormone-deprived (HD) for 72 hours. Cells were then treated with E2 for the indicated time points. The expression of TFF1 and GREB1 was normalized to the expression of the reference gene, RPLP0. Expression in HD cells was set to 1 (n = 3 independent E2 treatments, one-way ANOVA; *p < 0.05, ***p < 0.001).
Figure 7. A. Western blot showing expression of C-term truncated, N-Flag-TLE1-IPA in total, nuclear and cytoplasmic lysates of transfected MCF7 cells. The expected product size for TLE1-IPA is 25 kDa. TUBA1A (55 kDa) and HDAC (68 kDa) levels were used as cytoplasmic and nuclear protein controls. EV: empty pcDNA3.1 (-) vector, B. ICC for TLE1 IPA. Flag primary and Alexa Fluor 488 secondary antibodies were used to detect 3X-Flag-TLE1-IPA in transfected MCF7 cells. Propidium iodide was used for nuclear staining. Images were taken with ANDOR AMH200 DSD2 spinning disc microscope (100X) EV: empty vector-transfected cells, C. Reducing and non-reducing western blot for the C-term truncated N-Flag-TLE1-IPA protein. Flag antibody (Sigma F1804) was used to detect 3X-Flag-TLE1-IPA protein (Expected size: 25 kDa), D. RT-qPCR showing E2-induced upregulation of TFF1 and GREB1 in MCF7 cells stably expressing TLE1-IPA compared with control cells (EV: empty vector). Both sets were hormone-deprived (HD) for 72 hours. Cells were then treated with E2 for the indicated time points. The expression of TFF1 and GREB1 was normalized to the expression of the reference gene, RPLP0. Expression in HD cells was set to 1 (n = 3 independent E2 treatments, one-way ANOVA; *p < 0.05, ***p < 0.001).CC BY-NC · PubMed Central

Verification

Claims the paper makes

The claims and statistics of this paper haven’t been checked yet.

Run the check — free, no account needed. It reads the open-access text and checks the sources it cites.

A few free checks a day · papers already verified open instantly · results are public

Self-check

Percentages, sums and reported differences re-computed from the paper’s own numbers.

The self-check needs the paper’s full text.

Citations

Cites

Show all 1 references

Research works printed but not linked: 56

  1. 10.1016/j.mce.2013.06.021 · DOI
  2. 10.1016/j.cell.2011.03.042 · DOI
  3. 10.1158/0008-5472.CAN-23-0539 · DOI
  4. 10.1038/nrg3052 · DOI · Paper page
  5. 10.1373/clinchem.2008.112797 · DOI · Paper page
  6. 10.1038/s41598-021-04007-y · DOI
  7. 10.1093/bioinformatics/btq033 · DOI · Paper page
  8. 10.1186/gb-2008-9-9-r137 · DOI · Paper page
  9. 10.1101/gr.10.7.1001 · DOI
  10. 10.1101/gad.17268411 · DOI
  11. 10.1093/nar/gkz918 · DOI · Paper page
  12. 10.1038/s41467-020-15171-6 · DOI
  13. 10.1093/bioinformatics/btad421 · DOI
  14. 10.1073/pnas.0506580102 · DOI · Paper page
  15. 10.1007/s10529-006-9127-2 · DOI
  16. 10.1038/ncomms15081 · DOI · Paper page
  17. 10.1158/1078-0432.CCR-15-0335 · DOI
  18. 10.1261/rna.056895.116 · DOI
  19. 10.1371/journal.pone.0020610 · DOI
  20. 10.1093/nar/gkx428 · DOI
  21. 10.1093/nar/gkac1052 · DOI · Paper page
  22. 10.1093/nar/28.1.235 · DOI · Paper page
  23. 10.1038/s41592-022-01488-1 · DOI · Paper page
  24. 10.1101/2024.10.07.616947 · DOI · Paper page
  25. 10.1093/nar/gkac373 · DOI
  26. 10.1016/j.cell.2011.04.016 · DOI
  27. 10.1080/15476286.2023.2242649 · DOI
  28. 10.1186/s13059-016-0932-1 · DOI
  29. 10.1002/ijc.32185 · DOI
  30. 10.1038/s41580-022-00566-8 · DOI
  31. 10.1038/oncsis.2017.24 · DOI
  32. 10.1074/jbc.M403470200 · DOI
  33. 10.1002/bies.201400138 · DOI
  34. 10.1093/nargab/lqaa073 · DOI
  35. 10.1007/s10549-005-1483-4 · DOI
  36. 10.1073/pnas.1018863108 · DOI
  37. 10.1128/MCB.14.3.2119 · DOI
  38. 10.1002/embj.201387188 · DOI
  39. 10.1097/00002030-199104000-00009 · DOI
  40. 10.1016/j.sbi.2023.102594 · DOI
  41. 10.1093/bioinformatics/btad573 · DOI · Paper page
  42. 10.1093/nar/gks1230 · DOI
  43. 10.1126/sciadv.abe2470 · DOI
  44. 10.1093/nargab/lqab028 · DOI
  45. 10.1038/s41467-024-48117-3 · DOI
  46. 10.1007/s00262-023-03543-y · DOI
  47. 10.1016/j.cell.2009.06.016 · DOI · Paper page
  48. 10.1126/science.1155390 · DOI · Paper page
  49. 10.1101/gr.5532707 · DOI
  50. 10.1016/j.neo.2017.04.008 · DOI
  51. 10.1038/s12276-024-01289-w · DOI
  52. 10.1016/j.molcel.2011.08.009 · DOI
  53. 10.1158/1541-7786.MCR-15-0489 · DOI
  54. 10.1002/wrna.1692 · DOI
  55. 10.1002/prot.26284 · DOI
  56. 10.1016/j.tig.2019.05.005 · DOI

Metadata

Authors
Dioken, D. N., Ozgul, I., Yilmazbilek, I., Almeric, E., Eroglu, I. C., Cicek, M., Yilmaz, U. C., Karagozoglu, D., Cicek, E., Karaca, E., Can, T., & Erson-Bensan, A. E.
Affiliations
  • Middle East Technical University (TR)
  • Dokuz Eylül University (TR)
  • Colorado School of Mines (US)
Venue
RNA Biology
Publisher
openRxiv
Published
2025-08-02
Volume
22
Issue
1
Pages
1-21
ISSN
1547-6286 (ISSN-L)
OpenAlex
W4414326541
Cited by
5
References
1
Citations by year
2026: 4 · 2025: 1
FWCI
1.50
Type
journal article
Language
en
Open access
Locations
  • RNA Biology (publishedVersion, cc-by-nc)
  • bioRxiv (Cold Spring Harbor Laboratory) (acceptedVersion)
  • Europe PMC (PubMed Central) (publishedVersion, cc-by-nc)
  • PubMed (publishedVersion)
  • PubMed Central (publishedVersion, cc-by-nc)
  • DOAJ (DOAJ: Directory of Open Access Journals) (submittedVersion, cc-by-sa)
  • OpenMETU (Middle East Technical University) (submittedVersion, cc-by-nc-nd)
Funders
TUBITAK (120Z464)
Topics
  • Life Sciences › Biochemistry, Genetics and Molecular Biology › Molecular Biology › RNA Research and Splicing
  • Life Sciences › Biochemistry, Genetics and Molecular Biology › Endocrinology › Estrogen and related hormone effects
  • Life Sciences › Biochemistry, Genetics and Molecular Biology › Cancer Research › Cancer-related molecular mechanisms research
Keywords
estrogen receptor alpha, estradiol, estrogen receptor-positive breast cancer, alternative splicing, TLE1, truncated protein, protein dimerization, TFF1, GREB1, nanopore sequencing, 3' end sequencing, patient survival
MeSH terms
Breast Neoplasms, Estradiol, Female, Humans, RNA, Messenger, Gene Expression Regulation, Neoplastic, Sequence Analysis, RNA, Protein Isoforms, Gene Expression Profiling, Cell Line, Tumor, Estrogen Receptor alpha, Transcriptome

About these checks

Registry, retraction, Cites and statistics results are computed, not judged, with one exception: a printed reference that no index lists is read once by a model before it counts as a citation error. Claims are extracted by a model and kept only when their quote appears verbatim in the text; each cited source is then checked, with a model’s help, for whether it says what the claim relies on. Those verdicts can be wrong — read the claim’s quote and the cited source before relying on one.

Statistics and arithmetic are recomputed, not judged.

Confidence bands are shown only for fields calibrated on our annotated test set. None is calibrated yet, so no band is shown.

What counts as a claim ›How we measure confidence ›How we check this ›

Are you an author, or do you see a problem with this page? Request a review

How to cite

Cite CoChat for the checks on this page, and the paper for its own findings.

This page
CoChat. (2026). Citation check: E2-Regulated Transcriptome Complexity Revealed by Long-Read Direct RNA Sequencing: From Isoform Discovery to Truncated Proteins. https://app.cochat.ai/papers/10.1101/2025.07.31.667732
The paper
Dioken, D. N., Ozgul, I., Yilmazbilek, I., Almeric, E., Eroglu, I. C., Cicek, M., Yilmaz, U. C., Karagozoglu, D., Cicek, E., Karaca, E., Can, T., & Erson-Bensan, A. E. (2025). E2-Regulated Transcriptome Complexity Revealed by Long-Read Direct RNA Sequencing: From Isoform Discovery to Truncated Proteins. RNA Biology. https://doi.org/10.1101/2025.07.31.667732