Cited by 98

The DOI matches its Crossref record; 9 of the 9 references it cites were found in a registry or an index.

ERG promotes the maintenance of hematopoietic stem cells by restricting their differentiation

Knudsen, Kasper Jermiin, Rehn, Matilda, Hasemann, Marie Sigurd, Rapin, Nicolas, Bagger, Frederik Otzen, Ohlsson, Ewa, Willer, Anton, Frank, Anne-Katrine, Søndergaard, Elisabeth, Jendholm, Johan, Thorén, Lina, Lee, Julie, Rak, Justyna, Theilgaard-Mönch, Kim, Porse, Bo Torben·2015·Genes & Development

Abstract

The balance between self-renewal and differentiation is crucial for the maintenance of hematopoietic stem cells (HSCs). Whereas numerous gene regulatory factors have been shown to control HSC self-renewal or drive their differentiation, we have relatively few insights into transcription factors that serve to restrict HSC differentiation. In the present work, we identify ETS (E-twenty-six)-related gene (ERG) as a critical factor protecting HSCs from differentiation. Specifically, loss of Erg accelerates HSC differentiation by >20-fold, thus leading to rapid depletion of immunophenotypic and functional HSCs. Molecularly, we could demonstrate that ERG, in addition to promoting the expression of HSC self-renewal genes, also represses a group of MYC targets, thereby explaining why Erg loss closely mimics Myc overexpression. Consistently, the BET domain inhibitor CPI-203, known to repress Myc expression, confers a partial phenotypic rescue. In summary, ERG plays a critical role in coordinating the balance between self-renewal and differentiation of HSCs.

Overview

The claims and statistics of this paper haven’t been checked yet.

Run the check — free, no account needed. It reads the open-access text and checks the sources it cites.

A few free checks a day · papers already verified open instantly · results are public

Integrity signals

Registry

Crossref · 10.1101/gad.268409.115

Cites

9 of 9 references verified0 citation errors · 0 not checkable

Statistics

Figures

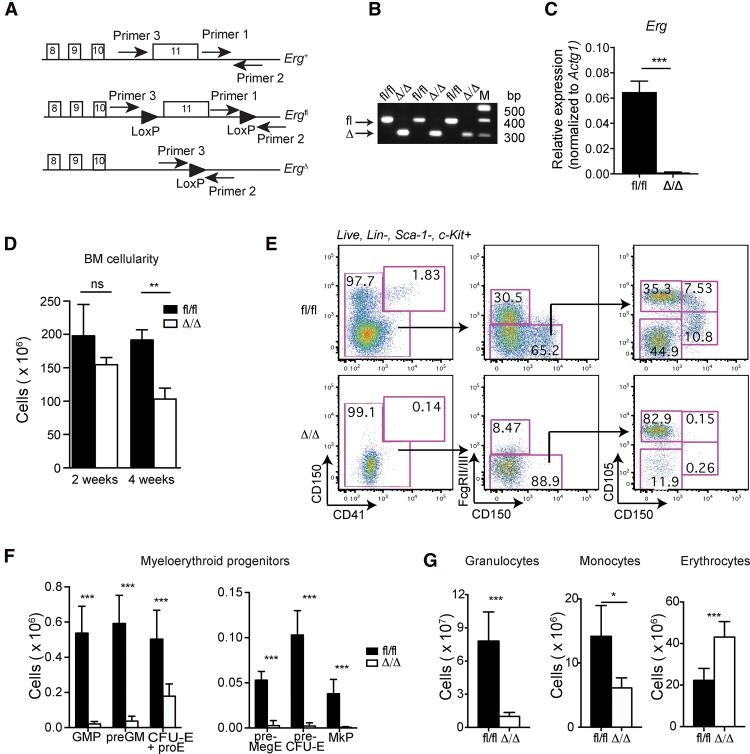
Figure 1. Conditional deletion of Erg results in loss of myeloid cells. (A) Schematic drawing of the conditional Erg knockout mouse model. (B) PCR-based genotyping of BM cells derived from pIpC-injected Ergfl/fl;±Mx1Cre animals illustrating the floxed (fl) and deleted (Δ) Erg alleles 2 wk after initiating pIpC injections. We estimate deletion frequencies of >99%. (C) The expression of Erg mRNA in MPPs derived from Ergfl/fl (n = 3) and ErgΔ/Δ (n = 3) BM 2 wk after initiating pIpC injections. The expression level of the full-length Erg transcript is reduced by >100-fold in ErgΔ/Δ MPPs. (D) BM (2× femur, tibia, and ilium) cell numbers in Ergfl/fl (n = 6) and ErgΔ/Δ (n = 6) mice 2 and 4 wk after pIpC treatment. (E) The distribution of myeloid progenitors in Ergfl/fl and ErgΔ/Δ mice was analyzed by FACS. (F) Quantification of the data in E. Ergfl/fl, n = 6; ErgΔ/Δ, n = 7). (G) The distribution of mature myeloid cells in Ergfl/fl (n = 6) and ErgΔ/Δ (n = 7) mice was analyzed by FACS. Data are represented as mean + SD. (*) P < 0.05; (**) P < 0.01; (***) P < 0.001; (ns) not significant. (GMP) Granulocyte–macrophage progenitor; (preGM) pregranulocyte–macrophage; (CFU-E) erythroid colony-forming unit; (pro-E) proerythroblast; (preCFU-E) pre-erythroid colony-forming unit; (preMegE) premegakaryoblast–erythroid progenitor; (MkP) megakaryocyte progenitor. See also Supplemental Figure S1.
Figure 1. Conditional deletion of Erg results in loss of myeloid cells. (A) Schematic drawing of the conditional Erg knockout mouse model. (B) PCR-based genotyping of BM cells derived from pIpC-injected Ergfl/fl;±Mx1Cre animals illustrating the floxed (fl) and deleted (Δ) Erg alleles 2 wk after initiating pIpC injections. We estimate deletion frequencies of >99%. (C) The expression of Erg mRNA in MPPs derived from Ergfl/fl (n = 3) and ErgΔ/Δ (n = 3) BM 2 wk after initiating pIpC injections. The expression level of the full-length Erg transcript is reduced by >100-fold in ErgΔ/Δ MPPs. (D) BM (2× femur, tibia, and ilium) cell numbers in Ergfl/fl (n = 6) and ErgΔ/Δ (n = 6) mice 2 and 4 wk after pIpC treatment. (E) The distribution of myeloid progenitors in Ergfl/fl and ErgΔ/Δ mice was analyzed by FACS. (F) Quantification of the data in E. Ergfl/fl, n = 6; ErgΔ/Δ, n = 7). (G) The distribution of mature myeloid cells in Ergfl/fl (n = 6) and ErgΔ/Δ (n = 7) mice was analyzed by FACS. Data are represented as mean + SD. (*) P < 0.05; (**) P < 0.01; (***) P < 0.001; (ns) not significant. (GMP) Granulocyte–macrophage progenitor; (preGM) pregranulocyte–macrophage; (CFU-E) erythroid colony-forming unit; (pro-E) proerythroblast; (preCFU-E) pre-erythroid colony-forming unit; (preMegE) premegakaryoblast–erythroid progenitor; (MkP) megakaryocyte progenitor. See also Supplemental Figure S1.CC BY-NC · PubMed Central
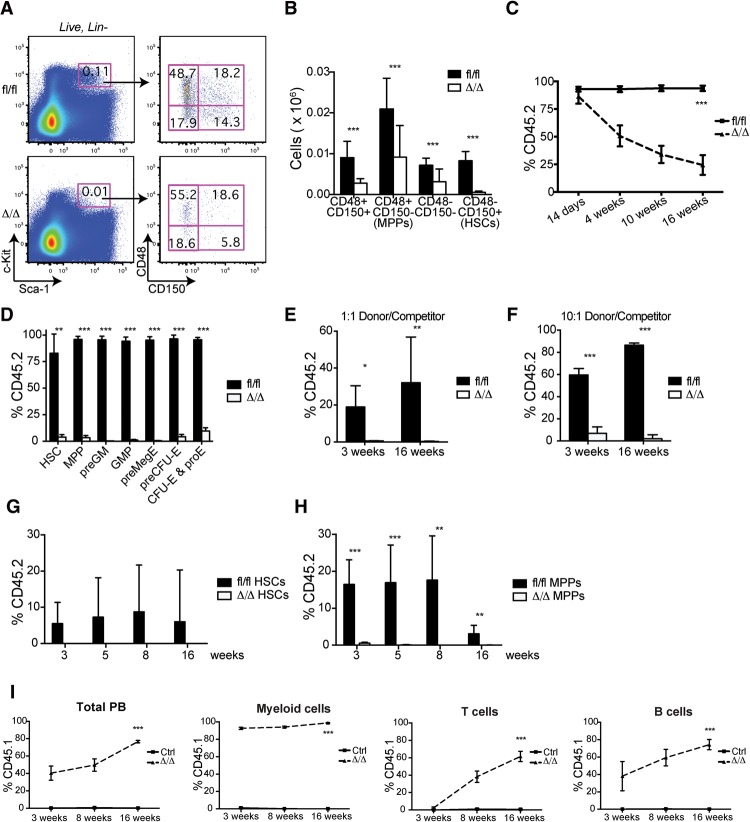
Figure 2. ERG maintains HSC numbers and function. (A) FACS analysis showing the distribution of stem and progenitor cells in Ergfl/fl and ErgΔ/Δ mice 2 wk after Erg deletion. (B) Quantification of the data in A: Total numbers of stem and progenitor cells per 2× femur, tibia, and ilium. Ergfl/fl, n = 6; ErgΔ/Δ, n = 7. (C) Analysis of donor cell contribution to the PB from CD45.1 recipients transplanted with Ergfl/fl or Ergfl/fl; Mx1Cre BM (CD45.2) in a 10:1 ratio with competitor BM. The recipient mice were treated with pIpC following transplantation to induce Erg deletion in the donor cell compartment. The indicated time is relative to Erg deletion. Ergfl/fl, n = 9; ErgΔ/Δ, n = 12. (D) Analysis of BM from mice in C at 20 wk after deletion of Erg. Ergfl/fl, n = 3; ErgΔ/Δ, n = 3. (E) Analysis of PB from CD45.1 recipients transplanted with Ergfl/fl (n = 6) or ErgΔ/Δ (n = 6) BM (CD45.2) in a 1:1 ratio with competitor BM (CD45.1). (F) As in E but using a 10:1 donor:competitor ratio. (G) Analysis of donor cell contributions to PB from CD45.1 recipients competitively transplanted with 30 Ergfl/fl (n = 13) or ErgΔ/Δ (n = 2) HSCs (CD45.2). (H) Analysis of donor cell reconstitution in PB from CD45.1 recipients competitively transplanted with 150 Ergfl/fl (n = 7) or ErgΔ/Δ (n = 8) MPPs (CD45.2). (I) Analysis of PB from Ergfl/fl (n = 5; pIpC injected), Ergfl/fl; Mx1Cre (n = 2; not injected with pIpC), and ErgΔ/Δ (n = 4; pIpC injected) mice transplanted with wild-type CD45.1 BM. Ctrl represents pooled data from Ergfl/fl and Ergfl/fl; Mx1Cre. Data are represented as mean + SD. (*) P < 0.05; (**) P < 0.01; (***) P < 0.001. See also Supplemental Figures S2 and S3.
Figure 2. ERG maintains HSC numbers and function. (A) FACS analysis showing the distribution of stem and progenitor cells in Ergfl/fl and ErgΔ/Δ mice 2 wk after Erg deletion. (B) Quantification of the data in A: Total numbers of stem and progenitor cells per 2× femur, tibia, and ilium. Ergfl/fl, n = 6; ErgΔ/Δ, n = 7. (C) Analysis of donor cell contribution to the PB from CD45.1 recipients transplanted with Ergfl/fl or Ergfl/fl; Mx1Cre BM (CD45.2) in a 10:1 ratio with competitor BM. The recipient mice were treated with pIpC following transplantation to induce Erg deletion in the donor cell compartment. The indicated time is relative to Erg deletion. Ergfl/fl, n = 9; ErgΔ/Δ, n = 12. (D) Analysis of BM from mice in C at 20 wk after deletion of Erg. Ergfl/fl, n = 3; ErgΔ/Δ, n = 3. (E) Analysis of PB from CD45.1 recipients transplanted with Ergfl/fl (n = 6) or ErgΔ/Δ (n = 6) BM (CD45.2) in a 1:1 ratio with competitor BM (CD45.1). (F) As in E but using a 10:1 donor:competitor ratio. (G) Analysis of donor cell contributions to PB from CD45.1 recipients competitively transplanted with 30 Ergfl/fl (n = 13) or ErgΔ/Δ (n = 2) HSCs (CD45.2). (H) Analysis of donor cell reconstitution in PB from CD45.1 recipients competitively transplanted with 150 Ergfl/fl (n = 7) or ErgΔ/Δ (n = 8) MPPs (CD45.2). (I) Analysis of PB from Ergfl/fl (n = 5; pIpC injected), Ergfl/fl; Mx1Cre (n = 2; not injected with pIpC), and ErgΔ/Δ (n = 4; pIpC injected) mice transplanted with wild-type CD45.1 BM. Ctrl represents pooled data from Ergfl/fl and Ergfl/fl; Mx1Cre. Data are represented as mean + SD. (*) P < 0.05; (**) P < 0.01; (***) P < 0.001. See also Supplemental Figures S2 and S3.CC BY-NC · PubMed Central
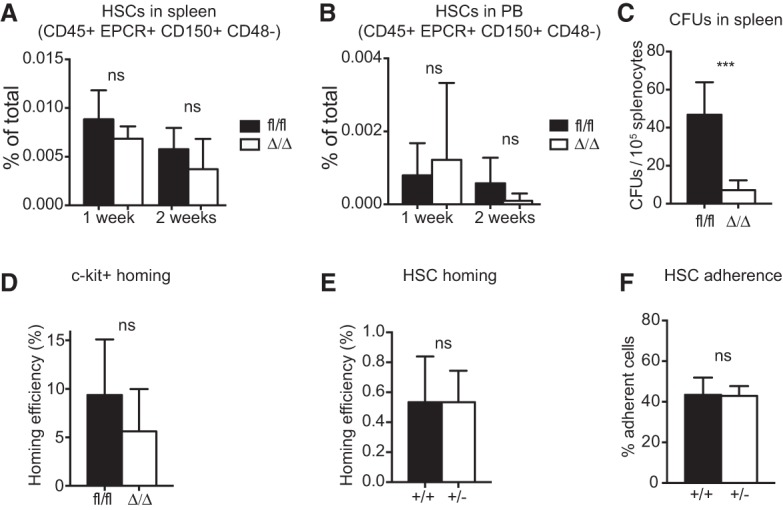
Figure 3. The impact of ERG on HSC localization, migration, and adhesion properties. (A) FACS analysis was used to determine HSC (Lineage− EPCR+ CD45+ CD150+ CD48−) numbers in the spleens of Ergfl/fl (n = 3–4) and ErgΔ/Δ (n = 2–5) mice 1 and 2 wk after Erg deletion. (B) FACS analysis was used to determine HSC (Lineage− EPCR+ CD45+ CD150+ CD48−) numbers in the PB of Ergfl/fl (n = 4–7) and ErgΔ/Δ (n = 4–6) mice 1 and 2 wk after Erg deletion. (C) CFUs in M3434 semisolid medium of splenocytes from Ergfl/fl (n = 6) and ErgΔ/Δ (n = 6) mice. (D) Homing analysis of Ergfl/fl (n = 13) and ErgΔ/Δ (n = 11) c-Kit+ BM cells 3 h after intravenous injection of 10,000 carboxyfluorescein succinimidyl ester (CFSE)-labeled cells per irradiated recipient. (E) Homing analysis of Erg+/+ (n = 5) and Erg+/− (n = 5) HSCs (LSK CD150+ CD48−) 12 h after intravenous injection of 3000 CFSE-labeled HSCs per irradiated recipient. (F) In vitro adhesion of Erg+/+ (n = 10) and Erg+/− (n = 9) GFP+ HSCs (LSK CD150+ CD48−) to FBMD-1stromal cells following a180° flip. Data are represented as mean + SD. (ns) Not significant; (***) P < 0.001. See also Supplemental Figure S3.
Figure 3. The impact of ERG on HSC localization, migration, and adhesion properties. (A) FACS analysis was used to determine HSC (Lineage− EPCR+ CD45+ CD150+ CD48−) numbers in the spleens of Ergfl/fl (n = 3–4) and ErgΔ/Δ (n = 2–5) mice 1 and 2 wk after Erg deletion. (B) FACS analysis was used to determine HSC (Lineage− EPCR+ CD45+ CD150+ CD48−) numbers in the PB of Ergfl/fl (n = 4–7) and ErgΔ/Δ (n = 4–6) mice 1 and 2 wk after Erg deletion. (C) CFUs in M3434 semisolid medium of splenocytes from Ergfl/fl (n = 6) and ErgΔ/Δ (n = 6) mice. (D) Homing analysis of Ergfl/fl (n = 13) and ErgΔ/Δ (n = 11) c-Kit+ BM cells 3 h after intravenous injection of 10,000 carboxyfluorescein succinimidyl ester (CFSE)-labeled cells per irradiated recipient. (E) Homing analysis of Erg+/+ (n = 5) and Erg+/− (n = 5) HSCs (LSK CD150+ CD48−) 12 h after intravenous injection of 3000 CFSE-labeled HSCs per irradiated recipient. (F) In vitro adhesion of Erg+/+ (n = 10) and Erg+/− (n = 9) GFP+ HSCs (LSK CD150+ CD48−) to FBMD-1stromal cells following a180° flip. Data are represented as mean + SD. (ns) Not significant; (***) P < 0.001. See also Supplemental Figure S3.CC BY-NC · PubMed Central
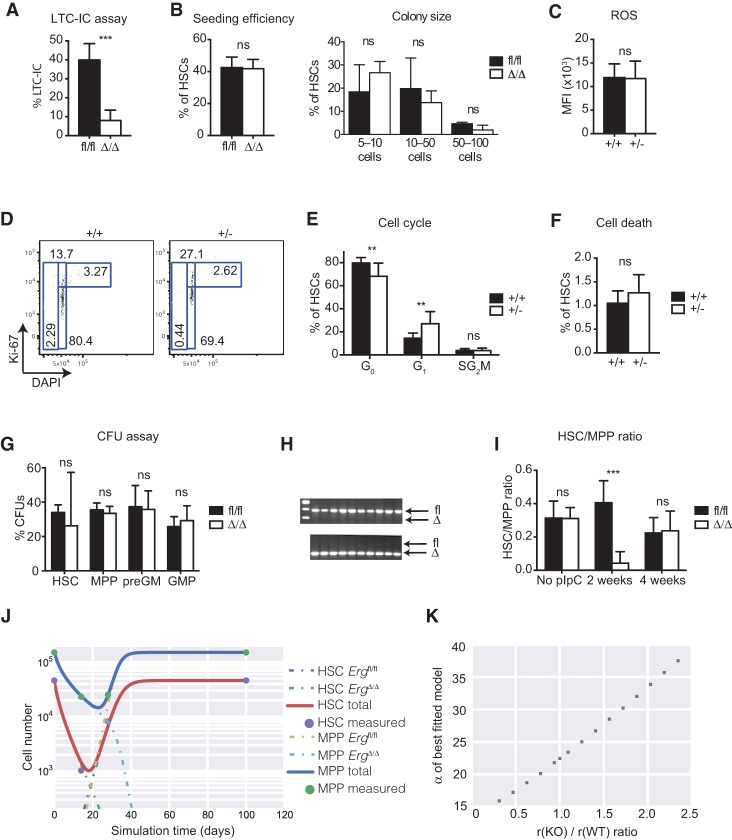
Figure 4. Loss of Erg results in differentiation of the HSCs. (A) LTC-IC assay of sorted Ergfl/fl (n = 220 HSCs from four mice) and ErgΔ/Δ (n = 168 HSCs from six mice) HSCs (Lineage− EPCR+ CD45+ CD150+ CD48−). Sorted HSCs were cultured on FBMD-1 stromal cells for 5 wk, and LTC-IC capacity was evaluated by counting colonies arising after an additional week of culture in semisolid M3434 medium. (B) Colony-forming ability (seeding efficiency [left panel] and colony size [right panel]) of single-sorted, in vitro excised Ergfl/fl (n = 330 HSCs from five mice) and ErgΔ/Δ (n = 330 HSCs from six mice) HSCs (LSK CD150+ CD48−) cultured in SFEM supplemented with cytokines for 8 d. (C) ROS levels in Erg+/+ (n = 4) and Erg+/− (n = 4) HSCs were measured by CM-H2DCFDA staining followed by FACS analysis. (MFI) Mean fluorescence intensity. (D) FACS analysis of cells stained with Ki67 and DAPI to analyze cell cycle distribution and cell death in Erg+/+ (n = 10) and Erg+/− (n = 13) HSCs. (E) Quantification of the cell cycle data in D. (F) Quantification of the cell death data in D. (G) CFU assays (in M3434 semisolid medium) of sorted stem and progenitor cells from Ergfl/fl (HSCs, n = 6; MPPs, n = 2; preGMs, n = 6; GMPs, n = 2), and ErgΔ/Δ (HSCs, n = 8; MPPs, n = 2; preGMs, n = 8; GMPs, n = 2). (H) Genotyping of colonies from CFU assays in G. (Top gel) Ergfl/fl. (Bottom gel) ErgΔ/Δ. (I) Numbers of HSCs and MPPs at different time points after pIpC injection were determined by FACS analysis. The graph illustrates HSC/MPP ratios at different time points after pIpC injections in Ergfl/fl (No pIpC, n = 4; 2 wk, n = 6; 4 wk, n = 7) and ErgΔ/Δ (No pIpC, n = 3; 2 wk, n = 7; 4 wk, n = 5) BM. (J) Mathematical modeling of the data in I showing the changes in HSC and MPP numbers in ErgΔ/Δ BM. Please note that the model takes into account that the deletion is <100%, leading to the emergence of escaper cells (HSC Ergfl/fl and MPP Ergfl/fl). The experimental data are depicted by circles. (K) α of the relative differentiation rates of knockout/wild-type HSCs of the best-fitted model, plotted as a function of the relative proliferation rates of knockout/wild-type HSCs. See the Supplemental Material for further details of the analyses. Data are represented as mean + SD. (**) P < 0.01; (***) P < 0.001; (ns) not significant. See also Supplemental Figure S4.
Figure 4. Loss of Erg results in differentiation of the HSCs. (A) LTC-IC assay of sorted Ergfl/fl (n = 220 HSCs from four mice) and ErgΔ/Δ (n = 168 HSCs from six mice) HSCs (Lineage− EPCR+ CD45+ CD150+ CD48−). Sorted HSCs were cultured on FBMD-1 stromal cells for 5 wk, and LTC-IC capacity was evaluated by counting colonies arising after an additional week of culture in semisolid M3434 medium. (B) Colony-forming ability (seeding efficiency [left panel] and colony size [right panel]) of single-sorted, in vitro excised Ergfl/fl (n = 330 HSCs from five mice) and ErgΔ/Δ (n = 330 HSCs from six mice) HSCs (LSK CD150+ CD48−) cultured in SFEM supplemented with cytokines for 8 d. (C) ROS levels in Erg+/+ (n = 4) and Erg+/− (n = 4) HSCs were measured by CM-H2DCFDA staining followed by FACS analysis. (MFI) Mean fluorescence intensity. (D) FACS analysis of cells stained with Ki67 and DAPI to analyze cell cycle distribution and cell death in Erg+/+ (n = 10) and Erg+/− (n = 13) HSCs. (E) Quantification of the cell cycle data in D. (F) Quantification of the cell death data in D. (G) CFU assays (in M3434 semisolid medium) of sorted stem and progenitor cells from Ergfl/fl (HSCs, n = 6; MPPs, n = 2; preGMs, n = 6; GMPs, n = 2), and ErgΔ/Δ (HSCs, n = 8; MPPs, n = 2; preGMs, n = 8; GMPs, n = 2). (H) Genotyping of colonies from CFU assays in G. (Top gel) Ergfl/fl. (Bottom gel) ErgΔ/Δ. (I) Numbers of HSCs and MPPs at different time points after pIpC injection were determined by FACS analysis. The graph illustrates HSC/MPP ratios at different time points after pIpC injections in Ergfl/fl (No pIpC, n = 4; 2 wk, n = 6; 4 wk, n = 7) and ErgΔ/Δ (No pIpC, n = 3; 2 wk, n = 7; 4 wk, n = 5) BM. (J) Mathematical modeling of the data in I showing the changes in HSC and MPP numbers in ErgΔ/Δ BM. Please note that the model takes into account that the deletion is <100%, leading to the emergence of escaper cells (HSC Ergfl/fl and MPP Ergfl/fl). The experimental data are depicted by circles. (K) α of the relative differentiation rates of knockout/wild-type HSCs of the best-fitted model, plotted as a function of the relative proliferation rates of knockout/wild-type HSCs. See the Supplemental Material for further details of the analyses. Data are represented as mean + SD. (**) P < 0.01; (***) P < 0.001; (ns) not significant. See also Supplemental Figure S4.CC BY-NC · PubMed Central
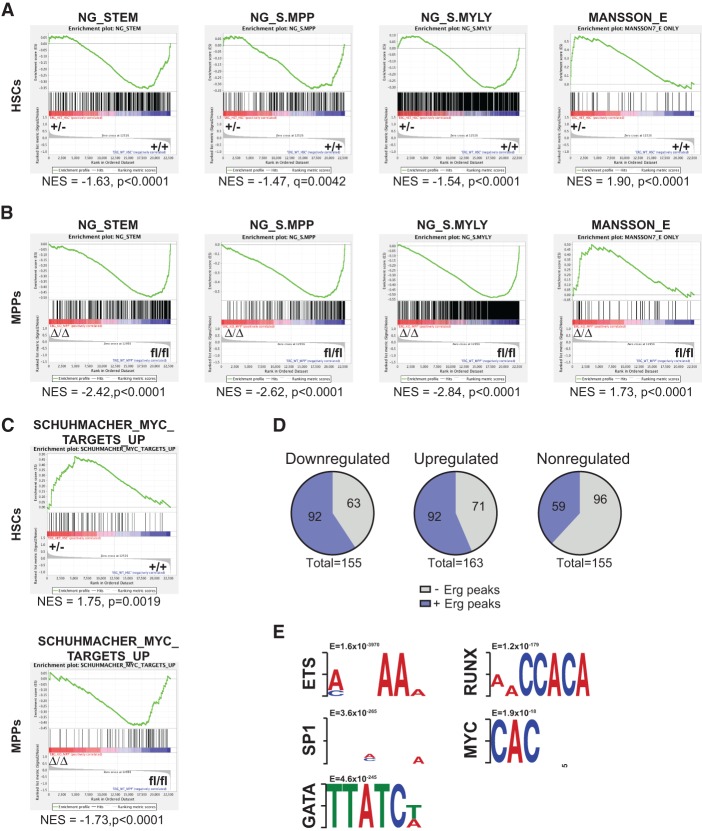
Figure 5. ERG regulates distinct transcriptional programs in HSCs (A) HSCs (LSK CD150+ CD48−) were sorted from Erg+/− and Erg+/+ mice for microarray analysis, and the resulting gene expression data were used for GSEA using selected hematopoietic signatures. (B) GSEA of ErgΔ/Δ versus Ergfl/fl MPPs using selected hematopoietic signatures. (C) GSEA illustrating the selective up-regulation of MYC target genes in Erg+/− HSCs. (D) Binding of ERG to transcription start sites (TSSs; ±800 base pairs [bp]) of genes that are down-regulated, up-regulated, or nonregulated in Erg+/− versus Erg+/+ HSCs. ChIP-seq (chromatin immunoprecipitation [ChIP] combined with deep sequencing) data originate from HPC-7 cells (Wilson et al. 2010). (E) DREME motif analysis identifying transcription factor-binding sites enriched near ERG-bound regions.
Figure 5. ERG regulates distinct transcriptional programs in HSCs (A) HSCs (LSK CD150+ CD48−) were sorted from Erg+/− and Erg+/+ mice for microarray analysis, and the resulting gene expression data were used for GSEA using selected hematopoietic signatures. (B) GSEA of ErgΔ/Δ versus Ergfl/fl MPPs using selected hematopoietic signatures. (C) GSEA illustrating the selective up-regulation of MYC target genes in Erg+/− HSCs. (D) Binding of ERG to transcription start sites (TSSs; ±800 base pairs [bp]) of genes that are down-regulated, up-regulated, or nonregulated in Erg+/− versus Erg+/+ HSCs. ChIP-seq (chromatin immunoprecipitation [ChIP] combined with deep sequencing) data originate from HPC-7 cells (Wilson et al. 2010). (E) DREME motif analysis identifying transcription factor-binding sites enriched near ERG-bound regions.CC BY-NC · PubMed Central
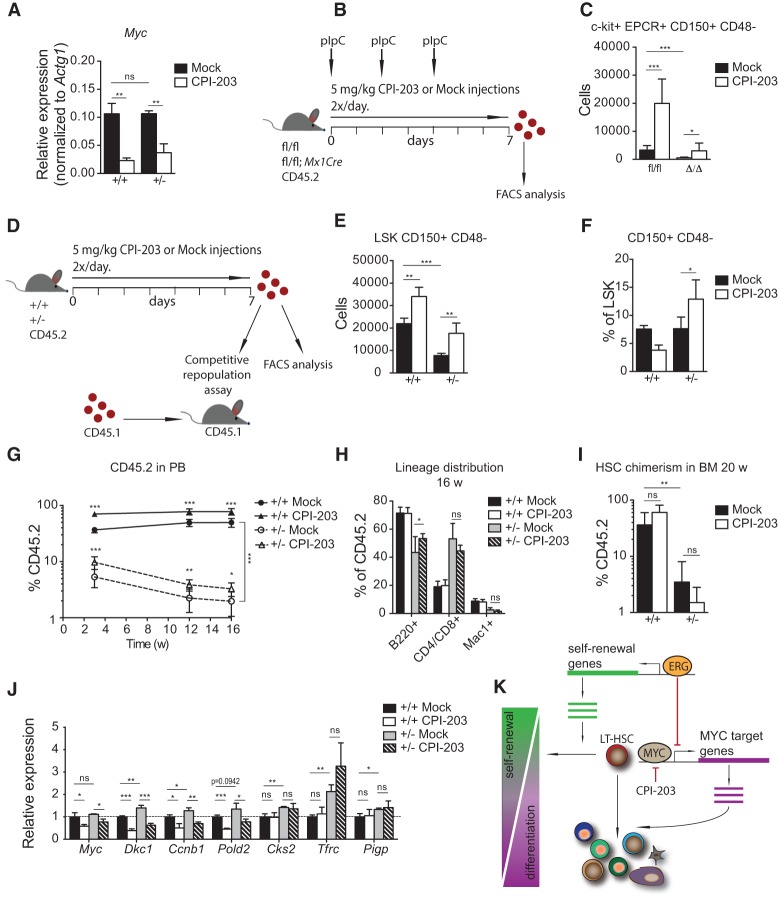
Figure 6. The HSC maintenance defect in Erg-deficient mice can be rescued by modulation of Myc activity. (A) qRT–PCR analysis of Myc mRNA expression in LSK CD150+ CD48− HSCs from Erg+/+ (n = 3) and Erg+/− (n = 3) mice following 24 h of treatment with CPI-203 in vitro. (B) Schematic overview of pIpC and CPI-203 administration in Ergfl/fl and Ergfl/fl; Mx1Cre mice. (C) FACS analysis was used to determine total numbers of Lin− c-Kit+ EPCR+ CD150+ CD48− HSCs in 2× femur, tibia, and ilium of Ergfl/fl and ErgΔ/Δ mice (n = 7–10) after 1 wk of CPI-203 treatment. (D) Schematic overview of CPI-203 administration and analyses performed in Erg+/+ and Erg+/− mice. (E) FACS analysis was used to determine total numbers of LSK CD150+ CD48− HSCs in 2× femur, tibia, and ilium of Erg+/+ (n = 3–4) and Erg+/− mice (n = 4) following 1 wk of CPI-203 treatment. (F) The percentage of CD150+ CD48− cells within the LSK compartment in Erg+/+ (n = 3–4) and Erg+/− (n = 4) mice following 1 wk of CPI-203 treatment. (G) BM cells from CPI-203-treated Erg+/+ (n = 3–4) and Erg+/− (n = 4) mice were used as input for the competitive repopulation assay, and contributions to the PB were measured in recipients (n = 7–12) at 3, 12, and 16 wk after transplantation. (H) Distribution of B cells, T cells, and myeloid cells within the donor cell compartment in PB 16 wk after transplantation. (I) Donor cell chimerism within the LSK CD150+ CD48− HSC compartment in BM 20 wk after transplantation. (J) qRT–PCR analysis of Myc and MYC target gene mRNA expression in c-Kit+ cells from Erg+/+ (n = 3) and Erg+/− (n = 3) mice following 24 h of treatment with CPI-203 in vitro. Gene expression is normalized to Actg1 and Erg+/+ mock for each gene. (K) Model of ERG as a key regulator of HSC self-renewal versus differentiation. Data are represented as mean + SD. (w) Weeks. (ns) Not significant; (*) P < 0.05; (**) P < 0.01; (***) P < 0.001.
Figure 6. The HSC maintenance defect in Erg-deficient mice can be rescued by modulation of Myc activity. (A) qRT–PCR analysis of Myc mRNA expression in LSK CD150+ CD48− HSCs from Erg+/+ (n = 3) and Erg+/− (n = 3) mice following 24 h of treatment with CPI-203 in vitro. (B) Schematic overview of pIpC and CPI-203 administration in Ergfl/fl and Ergfl/fl; Mx1Cre mice. (C) FACS analysis was used to determine total numbers of Lin− c-Kit+ EPCR+ CD150+ CD48− HSCs in 2× femur, tibia, and ilium of Ergfl/fl and ErgΔ/Δ mice (n = 7–10) after 1 wk of CPI-203 treatment. (D) Schematic overview of CPI-203 administration and analyses performed in Erg+/+ and Erg+/− mice. (E) FACS analysis was used to determine total numbers of LSK CD150+ CD48− HSCs in 2× femur, tibia, and ilium of Erg+/+ (n = 3–4) and Erg+/− mice (n = 4) following 1 wk of CPI-203 treatment. (F) The percentage of CD150+ CD48− cells within the LSK compartment in Erg+/+ (n = 3–4) and Erg+/− (n = 4) mice following 1 wk of CPI-203 treatment. (G) BM cells from CPI-203-treated Erg+/+ (n = 3–4) and Erg+/− (n = 4) mice were used as input for the competitive repopulation assay, and contributions to the PB were measured in recipients (n = 7–12) at 3, 12, and 16 wk after transplantation. (H) Distribution of B cells, T cells, and myeloid cells within the donor cell compartment in PB 16 wk after transplantation. (I) Donor cell chimerism within the LSK CD150+ CD48− HSC compartment in BM 20 wk after transplantation. (J) qRT–PCR analysis of Myc and MYC target gene mRNA expression in c-Kit+ cells from Erg+/+ (n = 3) and Erg+/− (n = 3) mice following 24 h of treatment with CPI-203 in vitro. Gene expression is normalized to Actg1 and Erg+/+ mock for each gene. (K) Model of ERG as a key regulator of HSC self-renewal versus differentiation. Data are represented as mean + SD. (w) Weeks. (ns) Not significant; (*) P < 0.05; (**) P < 0.01; (***) P < 0.001.CC BY-NC · PubMed Central
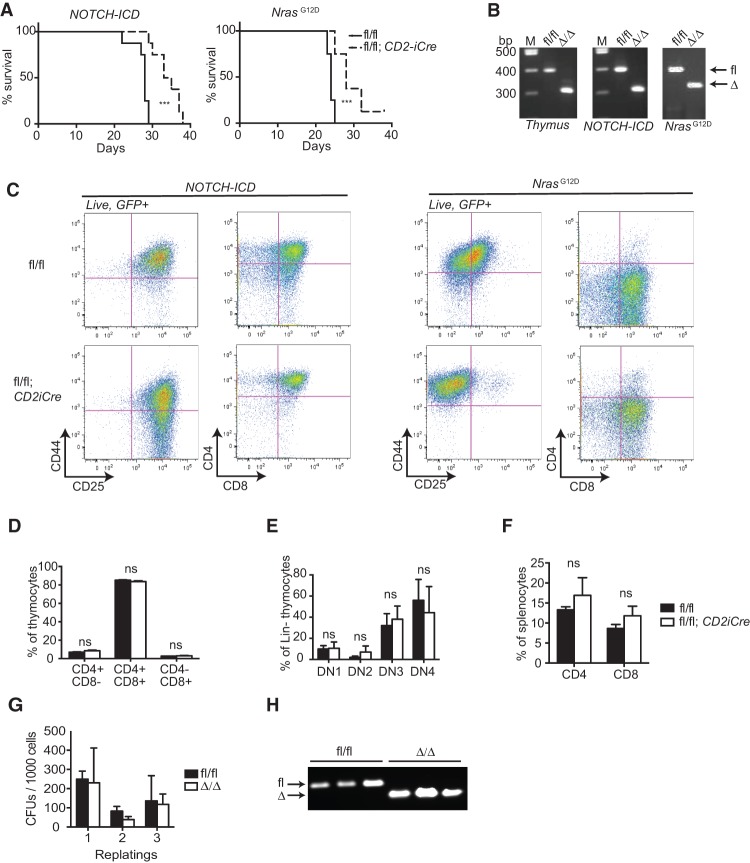
Figure 7. ERG is dispensable for both lymphoid and myeloid transformation. (A) Survival curves of recipients transplanted with Ergfl/fl (n = 8–12) or Ergfl/fl; CD2iCre (n = 8) BM cells transduced with NOTCH-ICD-expressing or NrasG12D-expressing retrovira. (B) Genotyping of thymi from normal Ergfl/fl and Ergfl/fl; CD2iCre (Δ/Δ) mice as well as from T-ALLs developing in Ergfl/fl (fl/fl) or Ergfl/fl; CD2iCre (Δ/Δ) mice. (C) FACS analysis of splenocytes derived from moribund recipients of BM cells transduced with NOTCH-ICD-expressing or NrasG12D-expressing retrovirus (GFP+). (D) FACS analysis was performed to quantify numbers of double-positive and single-positive thymocytes in normal Ergfl/fl (n = 4) and Ergfl/fl; CD2iCre (n = 4) mice. (E) Quantification of thymic progenitors in Ergfl/fl (n = 4) and Ergfl/fl; CD2iCre (n = 4) mice. (F) FACS analysis of mature CD4-expressing and CD8-expressing splenocytes in Ergfl/fl (n = 4) and Ergfl/fl; CD2iCre (n = 4) mice. (G) Serial replating of MLL-ENL transformed Ergfl/fl (n = 3) and ErgΔ/Δ (n = 3) BM cells. (H) Genotyping of the cells from G. Data are represented as mean + SD. (ns) Not significant; (***) P < 0.001. (M) Marker; (DN) double negative.
Figure 7. ERG is dispensable for both lymphoid and myeloid transformation. (A) Survival curves of recipients transplanted with Ergfl/fl (n = 8–12) or Ergfl/fl; CD2iCre (n = 8) BM cells transduced with NOTCH-ICD-expressing or NrasG12D-expressing retrovira. (B) Genotyping of thymi from normal Ergfl/fl and Ergfl/fl; CD2iCre (Δ/Δ) mice as well as from T-ALLs developing in Ergfl/fl (fl/fl) or Ergfl/fl; CD2iCre (Δ/Δ) mice. (C) FACS analysis of splenocytes derived from moribund recipients of BM cells transduced with NOTCH-ICD-expressing or NrasG12D-expressing retrovirus (GFP+). (D) FACS analysis was performed to quantify numbers of double-positive and single-positive thymocytes in normal Ergfl/fl (n = 4) and Ergfl/fl; CD2iCre (n = 4) mice. (E) Quantification of thymic progenitors in Ergfl/fl (n = 4) and Ergfl/fl; CD2iCre (n = 4) mice. (F) FACS analysis of mature CD4-expressing and CD8-expressing splenocytes in Ergfl/fl (n = 4) and Ergfl/fl; CD2iCre (n = 4) mice. (G) Serial replating of MLL-ENL transformed Ergfl/fl (n = 3) and ErgΔ/Δ (n = 3) BM cells. (H) Genotyping of the cells from G. Data are represented as mean + SD. (ns) Not significant; (***) P < 0.001. (M) Marker; (DN) double negative.CC BY-NC · PubMed Central

Verification

Claims the paper makes

The claims and statistics of this paper haven’t been checked yet.

Run the check — free, no account needed. It reads the open-access text and checks the sources it cites.

A few free checks a day · papers already verified open instantly · results are public

Claims other papers make about this one

Each is checked against this paper’s own text: does it say what the citing paper says it does?

Self-check

Percentages, sums and reported differences re-computed from the paper’s own numbers.

The self-check needs the paper’s full text.

Citations

Cites

Show all 9 references

Research works printed but not linked: 32

  1. 10.1093/bioinformatics/btr261 · DOI
  2. 10.1200/JCO.2006.06.1580 · DOI
  3. 10.1073/pnas.1213454109 · DOI
  4. 10.1038/ng.1009 · DOI · Paper page
  5. 10.1172/JCI35090 · DOI
  6. 10.1182/blood-2013-01-477133 · DOI
  7. 10.1093/bioinformatics/btr064 · DOI · Paper page
  8. 10.1371/journal.pgen.1004079 · DOI
  9. 10.4049/jimmunol.180.7.4402 · DOI
  10. 10.1016/j.immuni.2004.11.004 · DOI · Paper page
  11. 10.1016/j.cell.2013.05.041 · DOI
  12. 10.1073/pnas.1112317108 · DOI · Paper page
  13. 10.1073/pnas.0907623106 · DOI
  14. 10.1038/ni.1617 · DOI
  15. 10.1093/bioinformatics/btr189 · DOI
  16. 10.1016/j.immuni.2007.02.013 · DOI
  17. 10.1200/JCO.2005.03.6137 · DOI
  18. 10.1200/JCO.2007.10.8720 · DOI
  19. 10.1182/blood-2011-03-344739 · DOI
  20. 10.1084/jem.20130932 · DOI
  21. 10.1016/j.ccr.2011.06.003 · DOI · Paper page
  22. 10.1182/blood-2004-08-2989 · DOI
  23. 10.1038/nrurol.2012.10 · DOI
  24. 10.1016/j.stem.2012.08.006 · DOI
  25. 10.1158/0008-5472.CAN-09-0075 · DOI
  26. 10.1093/nar/gkh012 · DOI
  27. 10.1101/gad.2009211 · DOI
  28. 10.1182/blood-2010-11-320515 · DOI
  29. 10.1371/journal.pbio.0020301 · DOI
  30. 10.1038/ni.2572 · DOI
  31. 10.1101/gad.313104 · DOI · Paper page
  32. 10.1101/gad.1771409 · DOI

Cited by

See all 98

Metadata

Authors
Knudsen, K. J., Rehn, M., Hasemann, M. S., Rapin, N., Bagger, F. O., Ohlsson, E., Willer, A., Frank, A.-K., Søndergaard, E., Jendholm, J., Thorén, L., Lee, J., Rak, J., Theilgaard-Mönch, K., & Porse, B. T.
Venue
Genes & Development
Published
2015-09-15
Volume
29
Issue
18
Pages
1915-1929
ISSN
  • 0890-9369
  • 1549-5477
Cited by
98
References
9
Language
en
Funders
  • Danish Cancer Society (A1007, DP08059)
  • Lundbeck Foundation (26130, 29367)
  • NovoNordisk Foundation (34220, Centre grant)
  • Novo Nordisk Foundation (35247)

About these checks

Registry, retraction, Cites and statistics results are computed, not judged, with one exception: a printed reference that no index lists is read once by a model before it counts as a citation error. Claims are extracted by a model and kept only when their quote appears verbatim in the text; each cited source is then checked, with a model’s help, for whether it says what the claim relies on. Those verdicts can be wrong — read the claim’s quote and the cited source before relying on one.

Statistics and arithmetic are recomputed, not judged.

Confidence bands are shown only for fields calibrated on our annotated test set. None is calibrated yet, so no band is shown.

What counts as a claim ›How we measure confidence ›How we check this ›

Are you an author, or do you see a problem with this page? Request a review

How to cite

Cite CoChat for the checks on this page, and the paper for its own findings.

This page
CoChat. (2026). Citation check: ERG promotes the maintenance of hematopoietic stem cells by restricting their differentiation. https://app.cochat.ai/papers/10.1101/gad.268409.115
The paper
Knudsen, K. J., Rehn, M., Hasemann, M. S., Rapin, N., Bagger, F. O., Ohlsson, E., Willer, A., Frank, A.-K., Søndergaard, E., Jendholm, J., Thorén, L., Lee, J., Rak, J., Theilgaard-Mönch, K., & Porse, B. T. (2015). ERG promotes the maintenance of hematopoietic stem cells by restricting their differentiation. Genes & Development. https://doi.org/10.1101/gad.268409.115