

The DOI matches its Crossref record; 42 of the 42 references it cites were found in a registry or an index.
Protein aggregation mediates stoichiometry of protein complexes in aneuploid cells
Open accessAbstract
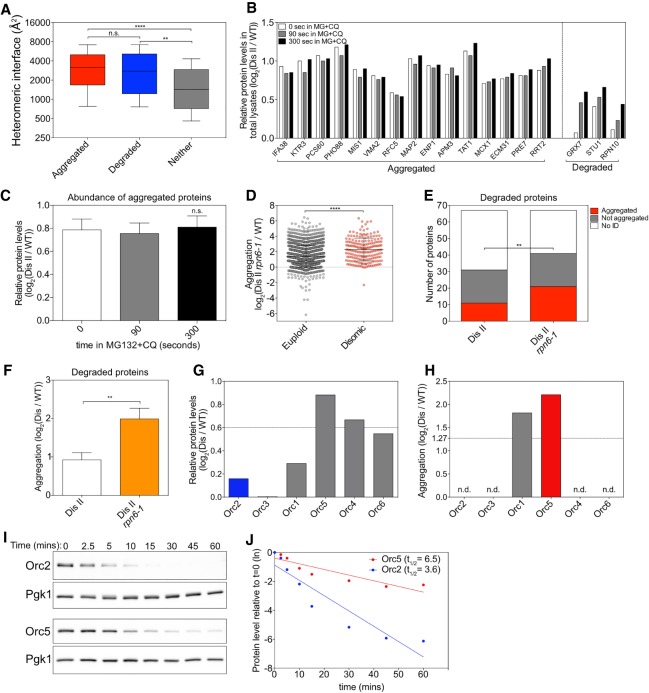
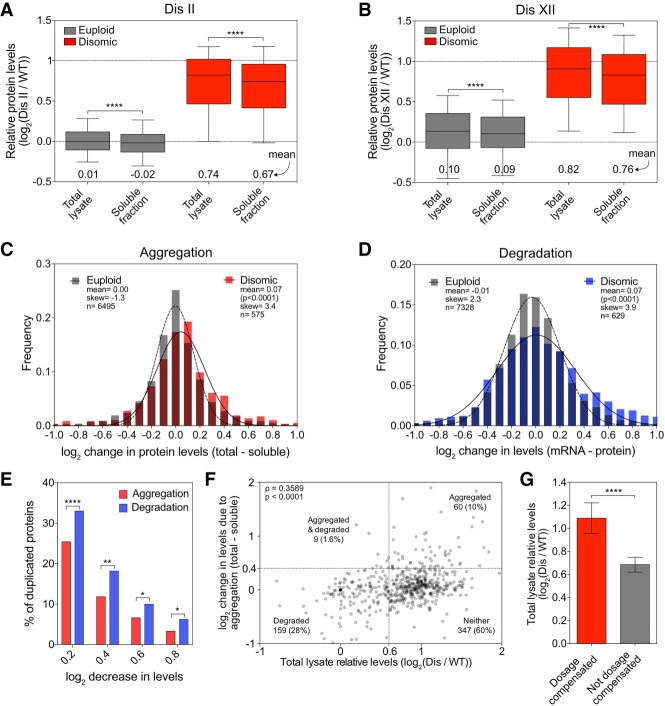
Aneuploidy, a condition characterized by chromosome gains and losses, causes reduced fitness and numerous cellular stresses, including increased protein aggregation. Here, we identify protein complex stoichiometry imbalances as a major cause of protein aggregation in aneuploid cells. Subunits of protein complexes encoded on excess chromosomes aggregate in aneuploid cells, which is suppressed when expression of other subunits is coordinately altered. We further show that excess subunits are either degraded or aggregate and that protein aggregation is nearly as effective as protein degradation at lowering levels of excess proteins. Our study explains why proteotoxic stress is a universal feature of the aneuploid state and reveals protein aggregation as a form of dosage compensation to cope with disproportionate expression of protein complex subunits.
Overview
The claims and statistics of this paper haven’t been checked yet.
Run the check — free, no account needed. It reads the open-access text and checks the sources it cites.
Integrity signals
Registry
Cites
Statistics
Figures
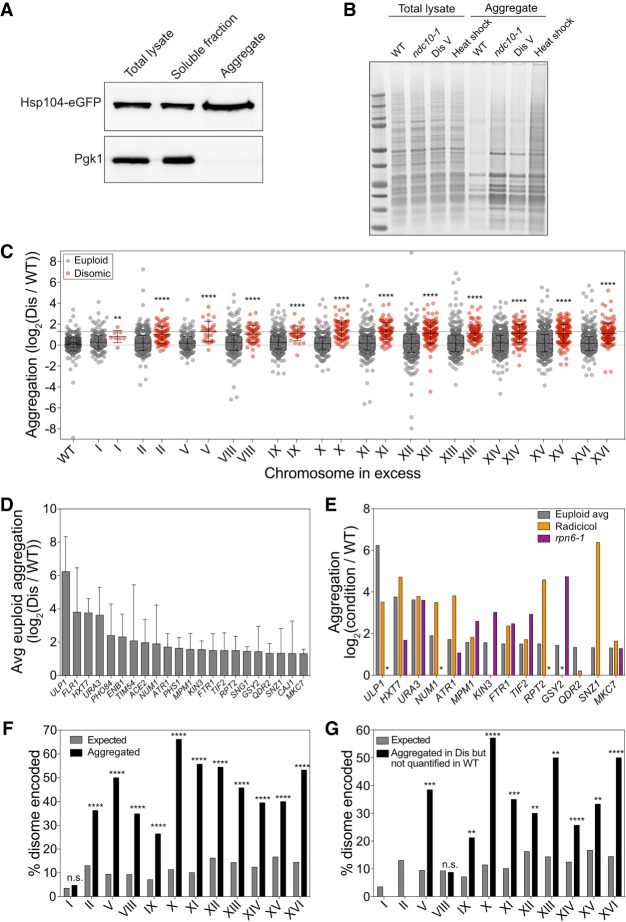
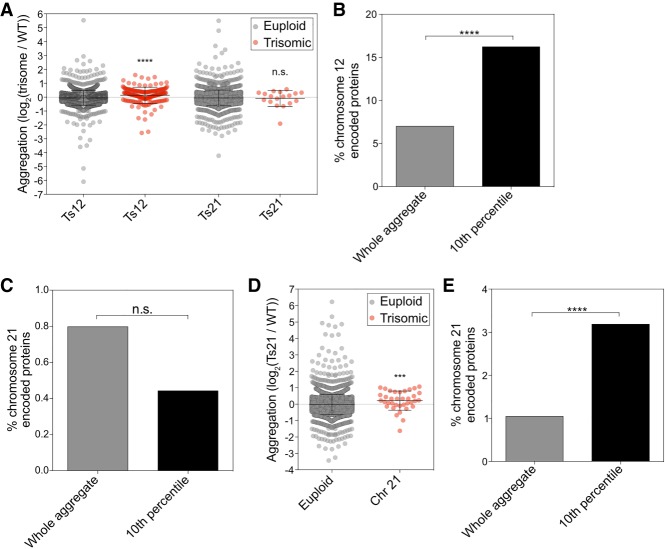
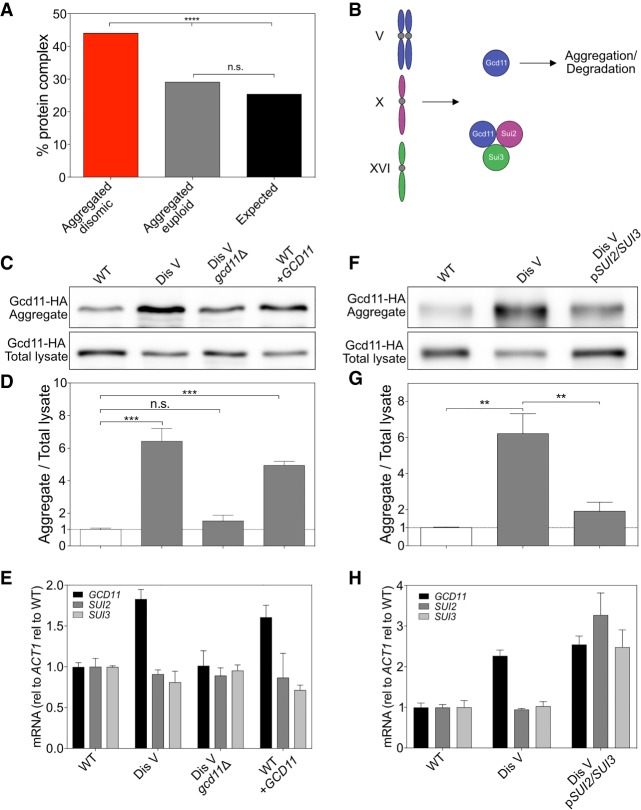
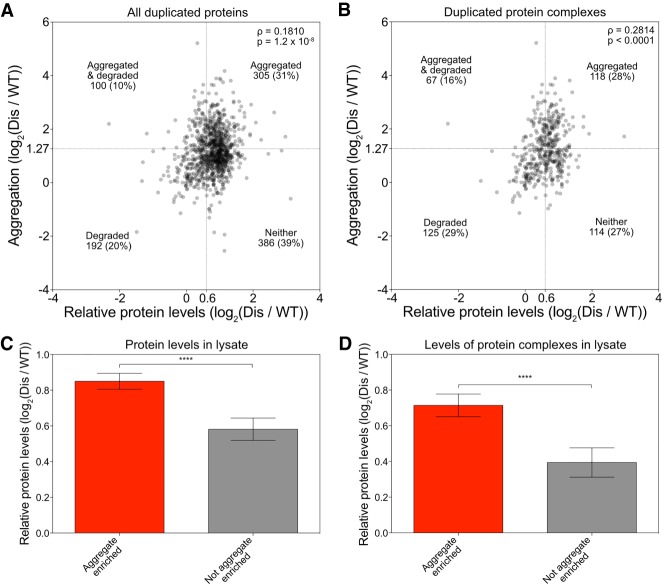
Verification
Claims the paper makes
The claims and statistics of this paper haven’t been checked yet.
Run the check — free, no account needed. It reads the open-access text and checks the sources it cites.
Claims other papers make about this one
Each is checked against this paper’s own text: does it say what the citing paper says it does?
The source backs part of the claim, not all of it — or backs it for a different population, condition or comparison.
In the citing paper
“We conclude that the reduction of Exo9 and EXOSC10 protein abundance across all subunits is caused by orphan protein decay because of the increased production of the unstable, and likely unusable, short EXOSC3 proteoform107–109.”
From EXOSC3 G191 Variants Trigger System-Wide Recalibration of RNA Processing Machinery (2026) · cites this paper as [108]
Experimental — accuracy not yet measured
Self-check
Percentages, sums and reported differences re-computed from the paper’s own numbers.
The self-check needs the paper’s full text.
Citations
Cites
Fiji: an open-source platform for biological-image analysis
Schindelin, J., Arganda-Carreras, I., Frise, E., Kaynig, V., Longair, M., Pietzsch, T., Preibisch, S., Rueden, C., Saalfeld, S., Schmid, B., et al. (2012) · Nature Methods · doi:10.1038/nmeth.2019 · Cited by 66,890
Overview of the CCP 4 suite and current developments
Winn, M. D., Ballard, C. C., Cowtan, K. D., Dodson, E. J., Emsley, P., Evans, P. R., Keegan, R. M., Krissinel, E. B., Leslie, A. G. W., McCoy, A., et al. (2011) · Acta Crystallographica Section D Biological Crystallography · doi:10.1107/s0907444910045749 · Cited by 12,353
Enzymatic assembly of DNA molecules up to several hundred kilobases
Gibson, D. G., Young, L., Chuang, R.-Y., Venter, J. C., Hutchison, C. A., & Smith, H. O. (2009) · Nature Methods · doi:10.1038/nmeth.1318 · Cited by 10,088
Biomolecular condensates: organizers of cellular biochemistry
Banani, S. F., Lee, H. O., Hyman, A. A., & Rosen, M. K. (2017) · Nature Reviews Molecular Cell Biology · doi:10.1038/nrm.2017.7 · Cited by 6,058
Ong, S.-E., Blagoev, B., Kratchmarova, I., Kristensen, D. B., Steen, H., Pandey, A., & Mann, M. (2002) · Molecular & Cellular Proteomics · doi:10.1074/mcp.m200025-mcp200 · Cited by 5,574
In-gel digestion for mass spectrometric characterization of proteins and proteomes
Shevchenko, A., Tomas, H., Havli, J., Olsen, J. V., & Mann, M. (2006) · Nature Protocols · doi:10.1038/nprot.2006.468 · Cited by 4,947
Elias, J. E., & Gygi, S. P. (2007) · Nature Methods · doi:10.1038/nmeth1019 · Cited by 3,925
2016 update of the PRIDE database and its related tools
Vizcaíno, J. A., Csordás, A., del‐Toro, N., Dianes, J. A., Griss, J., Lavidas, I., Mayer, G., Pérez‐Riverol, Y., Reisinger, F., Ternent, T., et al. (2015) · Nucleic Acids Research · doi:10.1093/nar/gkv1145 · Cited by 3,466
Bähler, J., Wu, J., Longtine, M. S., Shah, N. G., Mckenzie, A., Steever, A. B., Wach, A., Philippsen, P., & Pringle, J. R. (1998) · Yeast · doi:10.1002/(sici)1097-0061(199807)14:10 · Cited by 2,208
A tissue-specific atlas of mouse protein phosphorylation and expression
Huttlin, E. L., Jedrychowski, M. P., Elias, J. E., Goswami, T., Rad, R., Beausoleil, S. A., Villén, J., Haas, W., Sowa, M. E., & Gygi, S. P. (2010) · Cell · doi:10.1016/j.cell.2010.12.001 · Cited by 1,778
Research works printed but not linked: 1
- Guthrie C , Fink GR . 1991. Methods in enzymology: molecular biology of Saccharomyces cerevisiae. Academic Press, San Diego.
Cited by
Sorted by citations
mRNAs, proteins and the emerging principles of gene expression control
Buccitelli, C., & Selbach, M. (2020) · Nature Reviews Genetics · doi:10.1038/s41576-020-0258-4 · Cited by 1,243
Karagöz, G. E., Acosta‐Alvear, D., & Walter, P. (2019) · Cold Spring Harbor Perspectives in Biology · doi:10.1101/cshperspect.a033886 · Cited by 306
DNA Replication Stress and Chromosomal Instability: Dangerous Liaisons
Wilhelm, T., Said, M., & Naim, V. (2020) · Genes · doi:10.3390/genes11060642 · Cited by 161
Effects of aneuploidy on cell behaviour and function
Li, R., & Zhu, J. (2022) · Nature Reviews Molecular Cell Biology · doi:10.1038/s41580-021-00436-9 · Cited by 147
The epithelial–mesenchymal plasticity landscape: principles of design and mechanisms of regulation
Haerinck, J., Goossens, S., & Berx, G. (2023) · Nature Reviews Genetics · doi:10.1038/s41576-023-00601-0 · Cited by 142
Epigenetic dysregulation from chromosomal transit in micronuclei
Agustinus, A. S., Al-Rawi, D. H., Dameracharla, B., Raviram, R., Jones, B. S. C. L., Stransky, S., Scipioni, L., Luebeck, J., Bona, M. D., Norkūnaitė, D., et al. (2023) · Nature · doi:10.1038/s41586-023-06084-7 · Cited by 130
Keeping the Proportions of Protein Complex Components in Check
Taggart, J., Zauber, H., Selbach, M., Li, G., & McShane, E. (2020) · Cell Systems · doi:10.1016/j.cels.2020.01.004 · Cited by 98
RNA-binding and prion domains: the Yin and Yang of phase separation
Lorenzo-Gotor, N., Armaos, A., Calloni, G., Torrent, M., Vabulas, R. M., de Groot, N. S., & Tartaglia, G. G. (2020) · Nucleic Acids Research · doi:10.1093/nar/gkaa681 · Cited by 82
Natural proteome diversity links aneuploidy tolerance to protein turnover
Muenzner, J., Trébulle, P., Agostini, F., Zauber, H., Messner, C. B., Steger, M., Kilian, C., Lau, K., Barthel, N., Lehmann, A., et al. (2024) · Nature · doi:10.1038/s41586-024-07442-9 · Cited by 81
Extensive protein dosage compensation in aneuploid human cancersPreprint
Schukken, K. M., & Sheltzer, J. M. (2022) · Genome Research · doi:10.1101/gr.276378.121 · Cited by 79
Meiotic and mitotic aneuploidies drive arrest of in vitro fertilized human preimplantation embryos
McCoy, R. C., Summers, M. C., McCollin, A., Ottolini, C. S., Ahuja, K. K., & Handyside, A. H. (2023) · Genome Medicine · doi:10.1186/s13073-023-01231-1 · Cited by 77
Proteotoxic Stress and Cell Death in Cancer Cells
Brancolini, C., & Iuliano, L. (2020) · Cancers · doi:10.3390/cancers12092385 · Cited by 73
The genetic basis of aneuploidy tolerance in wild yeast
Hose, J., Escalante, L. E., Clowers, K. J., Dutcher, H. A., Robinson, D., Bouriakov, V., Coon, J. J., Shishkova, E., & Gasch, A. P. (2020) · eLife · doi:10.7554/elife.52063 · Cited by 72
“Amyloid‐beta accumulation cycle” as a prevention and/or therapy target for Alzheimer's disease
Rao, C. V., Asch, A. S., Carr, D. J. J., & Yamada, H. Y. (2020) · Aging Cell · doi:10.1111/acel.13109 · Cited by 69
Functional interdependence of N6-methyladenosine methyltransferase complex subunits in Arabidopsis
Shen, L. (2023) · The Plant Cell · doi:10.1093/plcell/koad070 · Cited by 69
Consequences of aneuploidy in human fibroblasts with trisomy 21
Hwang, S., Cavaliere, P., Li, R., Zhu, L. J., Dephoure, N., & Torres, E. M. (2021) · Proceedings of the National Academy of Sciences · doi:10.1073/pnas.2014723118 · Cited by 67
Orphan quality control shapes network dynamics and gene expression
Mark, K. G., Kolla, S., Aguirre, J. D., Garshott, D. M., Schmitt, S., Haakonsen, D. L., Xu, C., Kater, L., Kempf, G., Martínez-González, B., et al. (2023) · Cell · doi:10.1016/j.cell.2023.06.015 · Cited by 61
Krivega, M., Stiefel, C. M., Karbassi, S., Andersen, L. L., Chunduri, N. K., Donnelly, N., Pichlmair, A., & Štorchová, Z. (2021) · Communications Biology · doi:10.1038/s42003-021-02278-9 · Cited by 49
All Creatures Great and Small: New Approaches for Understanding Down Syndrome Genetics
Moyer, A. J., Gardiner, K., & Reeves, R. H. (2021) · Trends in Genetics · doi:10.1016/j.tig.2020.09.017 · Cited by 49
Expression attenuation as a mechanism of robustness against gene duplication
Ascencio, D., Diss, G., Gagnon‐Arsenault, I., Dubé, A. K., DeLuna, A., & Landry, C. R. (2021) · Proceedings of the National Academy of Sciences · doi:10.1073/pnas.2014345118 · Cited by 51
Aneuploidy as a driver of human cancer
Sdeor, E., Okada, H., Saad, R., Ben-Yishay, T., & Ben‐David, U. (2024) · Nature Genetics · doi:10.1038/s41588-024-01916-2 · Cited by 55
Genetic variation in aneuploidy prevalence and tolerance across Saccharomyces cerevisiae lineages
da Costa, E. S. F., Hose, J., Bensasson, D., & Gasch, A. P. (2021) · Genetics · doi:10.1093/genetics/iyab015 · Cited by 44
Identification of a quality-control factor that monitors failures during proteasome assembly
Zavodszky, E., Peak-Chew, S.-Y., Juszkiewicz, S., Narvaez, A. J., & Hegde, R. S. (2021) · Science · doi:10.1126/science.abc6500 · Cited by 45
Knopf, J. D., Landscheidt, N., Pegg, C. L., Schulz, B. L., Kühnle, N., Chao, C.-W., Huck, S., & Lemberg, M. K. (2020) · Journal of Cell Science · doi:10.1242/jcs.243790 · Cited by 41
Quality control of protein complex composition
Padovani, C., Jevtić, P., & Rapé, M. (2022) · Molecular Cell · doi:10.1016/j.molcel.2022.02.029 · Cited by 46
Genome instability and loss of protein homeostasis: converging paths to neurodegeneration?
Ainslie, A. P., Huiting, W., Barazzuol, L., & Bergink, S. (2021) · Open Biology · doi:10.1098/rsob.200296 · Cited by 42
Aggregation and disaggregation features of the human proteome
Määttä, T. A., Rettel, M., Sridharan, S., Helm, D., Kurzawa, N., Stein, F., & Savitski, M. M. (2020) · Molecular Systems Biology · doi:10.15252/msb.20209500 · Cited by 34
Targeting chromosomal instability in patients with cancer
Al-Rawi, D. H., Lettera, E., Li, J., Bona, M. D., & Bakhoum, S. F. W. (2024) · Nature Reviews Clinical Oncology · doi:10.1038/s41571-024-00923-w · Cited by 41
Physiological Functions of Intracellular Protein Degradation
McShane, E., & Selbach, M. (2022) · Annual Review of Cell and Developmental Biology · doi:10.1146/annurev-cellbio-120420-091943 · Cited by 41
The Role of Structural Variation in Adaptation and Evolution of Yeast and Other Fungi
Gorkovskiy, A., & Verstrepen, K. J. (2021) · Genes · doi:10.3390/genes12050699 · Cited by 44
The environmental stress response causes ribosome loss in aneuploid yeast cells
Terhorst, A., Sandikci, A., Keller, A., Whittaker, C. A., Dunham, M. J., & Amon, A. (2020) · Proceedings of the National Academy of Sciences · doi:10.1073/pnas.2005648117 · Cited by 33
Self-citationMechanism of orphan subunit recognition during assembly quality control
Yagita, Y., Zavodszky, E., Peak-Chew, S.-Y., & Hegde, R. S. (2023) · Cell · doi:10.1016/j.cell.2023.06.016 · Cited by 30
Larrimore, K. E., Barattin-Voynova, N. S., Reid, D. W., & Ng, D. (2020) · BMC Biology · doi:10.1186/s12915-020-00852-x · Cited by 34
A novel p53 regulator, C16ORF72/TAPR1, buffers against telomerase inhibition
Benslimane, Y., Sánchez‐Osuna, M., Coulombe‐Huntington, J., Bertomeu, T., Henry, D., Huard, C., Bonneil, É., Thibault, P., Tyers, M., & Harrington, L. A. (2021) · Aging Cell · doi:10.1111/acel.13331 · Cited by 30
The impact of monosomies, trisomies and segmental aneuploidies on chromosomal stability
Hintzen, D. C., Soto, M., Schubert, M., Bakker, B., Spierings, D. C. J., Szuhai, K., Lansdorp, P. M., Kluin, R. J. C., Foijer, F., Medema, R. H., et al. (2022) · PLoS ONE · doi:10.1371/journal.pone.0268579 · Cited by 29
Regin, M., Spits, C., & Sermon, K. (2022) · Molecular Human Reproduction · doi:10.1093/molehr/gaac011 · Cited by 30
Patterns of Aneuploidy and Signaling Consequences in Cancer
Zhakula-Kostadinova, N., & Taylor, A. M. (2024) · Cancer Research · doi:10.1158/0008-5472.can-24-0169 · Cited by 31
Qin, C., Xiang, Y., Liu, J., Zhang, R., Liu, Z., Li, T., Sun, Z., Ouyang, X., Zong, Y., Zhang, H. M., et al. (2023) · Nature Communications · doi:10.1038/s41467-023-37244-y · Cited by 27
Genomic instability and cancer: lessons from Drosophila
Gerlach, S. U., & Herranz, H. (2020) · Open Biology · doi:10.1098/rsob.200060 · Cited by 27
Exploiting aneuploidy-imposed stresses and coping mechanisms to battle cancer
Zhou, L., Jilderda, L. J., & Foijer, F. (2020) · Open Biology · doi:10.1098/rsob.200148 · Cited by 30
Consequences of gaining an extra chromosome
Torres, E. M. (2023) · Chromosome Research · doi:10.1007/s10577-023-09732-w · Cited by 29
Co-Operation between Aneuploidy and Metabolic Changes in Driving Tumorigenesis
Newman, D. L., & Gregory, S. L. (2019) · International Journal of Molecular Sciences · doi:10.3390/ijms20184611 · Cited by 24
Rojas, J., Hose, J., Dutcher, H. A., Place, M., Wolters, J. F., Hittinger, C. T., & Gasch, A. P. (2024) · Cell Genomics · doi:10.1016/j.xgen.2024.100656 · Cited by 22
Multilayered regulation of proteome stoichiometry
Ishikawa, K. (2021) · Current Genetics · doi:10.1007/s00294-021-01205-z · Cited by 21
A hierarchical assembly pathway directs the unique subunit arrangement of TRiC/CCT
Moreira, K. E., Collier, M. P., Leitner, A., Li, K. H., Lachapel, I. L. S., McCarthy, F., Opoku-Nsiah, K., Morales-Polanco, F., Barbosa, N., Gestaut, D. R., et al. (2023) · Molecular Cell · doi:10.1016/j.molcel.2023.07.031 · Cited by 23
Architecture of the UBR4 complex, a giant E4 ligase central to eukaryotic protein quality control
Grabarczyk, D. B., Ehrmann, J. F., Murphy, P. V., Yang, W. S., Kurzbauer, R., Bell, L., Deszcz, L., Neuhold, J., Schleiffer, A., Shulkina, A., et al. (2025) · Science · doi:10.1126/science.adv9309 · Cited by 20
Distinct mechanisms mediate X chromosome dosage compensation in Anopheles and Drosophila
Valsecchi, C. I. K., Marois, É., Basilicata, M. F., Georgiev, P., & Akhtar, A. (2021) · Life Science Alliance · doi:10.26508/lsa.202000996 · Cited by 21
Quality control of mislocalized and orphan proteins
Kong, K.-Y. E., Coelho, J. P. L., Feige, M. J., & Khmelinskii, A. (2021) · Experimental Cell Research · doi:10.1016/j.yexcr.2021.112617 · Cited by 21
Convergence of orphan quality control pathways at a ubiquitin chain-elongating ligase
Roas, S. C., Yagita, Y., Murphy, P. V., Kurzbauer, R., Clausen, T., Zavodszky, E., & Hegde, R. S. (2025) · Molecular Cell · doi:10.1016/j.molcel.2025.01.002 · Cited by 22
The good, the bad, and the ugly: Evolutionary and pathological aspects of gene dosage alterations
Basilicata, M. F., & Valsecchi, C. I. K. (2021) · PLoS Genetics · doi:10.1371/journal.pgen.1009906 · Cited by 19
Dörig, C., Marulli, C., Peskett, T. R., Volkmar, N., Pantolini, L., Studer, G., Paleari, C., Frommelt, F., Schwede, T. F., de Souza, N., et al. (2024) · Nature Biotechnology · doi:10.1038/s41587-024-02432-8 · Cited by 20
A compendium of Amplification-Related Gain Of Sensitivity genes in human cancer
Rendo, V., Schubert, M., Khuu, N., Rodríguez, M. F. S. P., Whyte, D., Ling, X., van den Brink, A., Huang, K., Swift, M. L., He, Y. J., et al. (2025) · Nature Communications · doi:10.1038/s41467-025-56301-2 · Cited by 20
Proteotoxicity caused by perturbed protein complexes underlies hybrid incompatibility in yeast
Swamy, K. B. S., Lee, H., Ladra, C., Liu, C.-F. J., Chao, J.-C., Chen, Y.-Y., & Leu, J. (2022) · Nature Communications · doi:10.1038/s41467-022-32107-4 · Cited by 18
Bravo‐Estupiñan, D. M., Aguilar‐Guerrero, K., Quirós, S., Acón, M., Marín‐Müller, C., Ibáñez-Hernández, M. Á., & Mora-Rodríguez, R. A. (2023) · Cancer Medicine · doi:10.1002/cam4.6719 · Cited by 16
Khan, A. H., Gu, X., Patel, R. J., Chuphal, P., Viana, M. P., Brown, A. I., Zid, B. M., & Tsuboi, T. (2024) · Nature Communications · doi:10.1038/s41467-024-52183-y · Cited by 17
Huiting, W., & Bergink, S. (2020) · Genome Instability & Disease · doi:10.1007/s42764-020-00027-6 · Cited by 17
MYC dosage compensation is mediated by miRNA-transcription factor interactions in aneuploid cancer
Acón, M., Geiß, C., Torres-Calvo, J., Bravo‐Estupiñan, D. M., Oviedo, G., Arias-Arias, J. L., Rojas-Matey, L. A., Baéz, E., Vásquez-Vargas, G., Oses-Vargas, Y., et al. (2021) · iScience · doi:10.1016/j.isci.2021.103407 · Cited by 16
Regulation of protein complex partners as a compensatory mechanism in aneuploid tumors
Senger, G., Santaguida, S., & Schaefer, M. H. (2022) · eLife · doi:10.7554/elife.75526 · Cited by 15
Self-citationRecent insights into the evolution of mutation rates in yeast
Melde, R. H., Bao, K. H., & Sharp, N. P. (2022) · Current Opinion in Genetics & Development · doi:10.1016/j.gde.2022.101953 · Cited by 14
Amponsah, P. S., Boekenkamp, J.-E., Kurpa, O., Lenhard, S., Myronova, A., Velazquez, D. O. V., Hirschelmann, C., Behrends, C., Herrmann, J. M., Räschle, M., et al. (2025) · Nature Communications · doi:10.1038/s41467-025-60857-4 · Cited by 15
Selection forces underlying aneuploidy patterns in cancer
Klockner, T. C., & Campbell, C. S. (2024) · Molecular & Cellular Oncology · doi:10.1080/23723556.2024.2369388 · Cited by 12
Kane, A. J., Brennan, C. M., Xu, A. E., Solís, E. J., Terhorst, A., Denic, V., & Amon, A. (2021) · Molecular Biology of the Cell · doi:10.1091/mbc.e21-03-0104 · Cited by 12
Self-citationApoptosis as a Barrier against CIN and Aneuploidy
Weiss, J. G., Villunger, A., Gallob, F., & Rieder, P. (2022) · Cancers · doi:10.3390/cancers15010030 · Cited by 11
M1BP is an essential transcriptional activator of oxidative metabolism during Drosophila development
Poliacikova, G., Barthez, M., Rival, T., Aouane, A., Luis, N. M., Richard, F., Daian, F., Brouilly, N., Schnorrer, F., Maurel-Zaffran, C., et al. (2023) · Nature Communications · doi:10.1038/s41467-023-38986-5 · Cited by 12
Dutcher, H. A., Hose, J., Howe, H., Rojas, J., & Gasch, A. P. (2024) · PLoS Genetics · doi:10.1371/journal.pgen.1011454 · Cited by 9
Targeting vulnerabilities of aneuploid cells for cancer therapy
Zerbib, J., Bloomberg, A., & Ben‐David, U. (2025) · Trends in cancer · doi:10.1016/j.trecan.2025.04.005 · Cited by 12
Nondiploid cancer cells: Stress, tolerance and therapeutic inspirations
Du, M., Zhang, S., Liu, X., Xu, C., & Zhang, X. (2022) · Biochimica et Biophysica Acta (BBA) - Reviews on Cancer · doi:10.1016/j.bbcan.2022.188794 · Cited by 10
Ishikawa, K., Ishihara, A., & Moriya, H. (2020) · PLoS Genetics · doi:10.1371/journal.pgen.1009091 · Cited by 11
Dual contributions of Xrp1 to genome integrity through the DNA damage response and cell competition
Khan, C., Rusan, N. M., & Baker, N. E. (2026) · PLoS Genetics · doi:10.1371/journal.pgen.1012309 · Cited by 11
Understanding How Genetic Mutations Collaborate with Genomic Instability in Cancer
Jilderda, L. J., Zhou, L., & Foijer, F. (2021) · Cells · doi:10.3390/cells10020342 · Cited by 9
Consequences of mitotic failure – The penalties and the rewards
Štorchová, Z. (2021) · Seminars in Cell and Developmental Biology · doi:10.1016/j.semcdb.2021.03.007 · Cited by 9
When Down Is Up: Heterochromatin, Nuclear Organization and X Upregulation
Makki, R., & Meller, V. H. (2021) · Cells · doi:10.3390/cells10123416 · Cited by 9
O’Meara, M. J., Rapala, J. R., Nichols, C. B., Alexandre, C., Billmyre, R. B., Steenwyk, J. L., Alspaugh, J. A., & O’Meara, T. R. (2024) · PLoS Genetics · doi:10.1371/journal.pgen.1011158 · Cited by 8
Hou, N., He, J., Bao, C., Zhi, F., Shen, X., Liu, Y., Li, C., Fan, T., Yang, X., Chu, B., et al. (2025) · Advanced Science · doi:10.1002/advs.202504405 · Cited by 8
Aneuploidy confers a unique transcriptional and phenotypic profile to Candida albicans
Mackey, A. I., Fillinger, R. J., Hendricks, P. S., Thomson, G. J., Cuomo, C. A., Bennett, R. J., & Anderson, M. Z. (2025) · Nature Communications · doi:10.1038/s41467-025-58457-3 · Cited by 8
Zhang, M., Trushina, N. K., Lang, T., Hahn, M., Pasmanik‐Chor, M., & Sharon, A. (2023) · mBio · doi:10.1128/mbio.01077-23 · Cited by 8
Characterizing chromosomal instability-driven cancer evolution and cell fitness at a glance
Tijhuis, A. E., & Foijer, F. (2024) · Journal of Cell Science · doi:10.1242/jcs.260199 · Cited by 8
Reduction of chromosomal instability and inflammation is a common aspect of adaptation to aneuploidy
Hintzen, D. C., Schubert, M., Soto, M., Medema, R. H., & Raaijmakers, J. A. (2024) · EMBO Reports · doi:10.1038/s44319-024-00252-0 · Cited by 8
Transcriptomic and proteomic ramifications of segmental amplification in Escherichia coli
Fritts, R. K., Ebmeier, C. C., & Copley, S. D. (2025) · Proceedings of the National Academy of Sciences · doi:10.1073/pnas.2422424122 · Cited by 8
The proteostasis burden of aneuploidy
Amponsah, P. S., & Štorchová, Z. (2025) · Biological Chemistry · doi:10.1515/hsz-2024-0163 · Cited by 7
Aneuploidy-induced cellular behaviors: Insights from Drosophila
Joy, J., Fusari, E., & Milán, M. (2024) · Developmental Cell · doi:10.1016/j.devcel.2023.12.009 · Cited by 6
TanGIBLE: A selective probe for evaluating hydrophobicity-exposed defective proteins in live cells
Iwasa, Y., Miyata, S., Tomita, T., Yokota, N., Miyauchi, M., Mori, R., Matsushita, S., Suzuki, R., Saeki, Y., & Kawahara, H. (2024) · The Journal of Cell Biology · doi:10.1083/jcb.202109010 · Cited by 6
Monosomies, trisomies and segmental aneuploidies differentially affect chromosomal stabilityPreprint
Hintzen, D. C., Soto, M., Schubert, M., Bakker, B., Spierings, D. C. J., Szuhai, K., Lansdorp, P. M., Foijer, F., Medema, R. H., & Raaijmakers, J. A. (2021) · bioRxiv (Cold Spring Harbor Laboratory) · doi:10.1101/2021.08.31.458318 · Cited by 5
Umlai, U. I., Haris, B., Hussain, K., & Jithesh, P. V. (2022) · Frontiers in Endocrinology · doi:10.3389/fendo.2021.783235 · Cited by 3
Dosage compensation plans: protein aggregation provides additional insurance against aneuploidyPreprint
Samant, R. S., Masto, V. B., & Frydman, J. (2019) · Genes & Development · doi:10.1101/gad.329383.119 · Cited by 4
Li, M., Yang, J., Xiao, R., Liu, Y., Hu, J., Li, T., Wu, P., Mei-li, Z., Huang, Y., Sun, Y., et al. (2024) · Cell Proliferation · doi:10.1111/cpr.13639 · Cited by 3
Preserve or destroy: Orphan protein proteostasis and the heat shock response
Ali, A., Paracha, S., & Pincus, D. (2024) · The Journal of Cell Biology · doi:10.1083/jcb.202407123 · Cited by 4
Protein buffering of aneuploidy is driven by coordinated factors identified through machine learning
Heller, E. M., Barthel, K., Räschle, M., Schukken, K. M., Sheltzer, J. M., & Štorchová, Z. (2026) · Molecular Systems Biology · doi:10.1038/s44320-026-00187-9 · Cited by 4
Meiotic and mitotic aneuploidies drive arrest of in vitro fertilized human preimplantation embryosPreprint
McCoy, R. C., Summers, M. C., McCollin, A., Ottolini, C. S., Ahuja, K. K., & Handyside, A. H. (2022) · bioRxiv (Cold Spring Harbor Laboratory) · doi:10.1101/2022.07.03.498614 · Cited by 2
A compendium of Amplification-Related Gain Of Sensitivity (ARGOS) genes in human cancerPreprint
Rendo, V., Schubert, M., Khuu, N., Rodríguez, M. F. S. P., Huang, K., Swift, M. L., He, Y. J., Zerbib, J., Smith, R., Raaijmakers, J. A., et al. (2023) · bioRxiv (Cold Spring Harbor Laboratory) · doi:10.1101/2023.12.16.571980 · Cited by 2
EXOSC3 G191 Variants Trigger System-Wide Recalibration of RNA Processing Machinery
Wijeratne, H. R. S., Runnebohm, A. M., Barron, M. P., Hampton, A. J., Li, R., Peck Justice, S. A., Lenceski, S. H., Rooney, J. D., Smith-Kinnaman, W. R., Chang, G. S., et al. (2026) · doi:10.64898/2026.01.26.701775 · Cited by 1
“Before indexing, a FASTA reference genome was made by concatenating the Ensembl import GRCh38 version 108 with the ERCC Spike-In sequences.”
Al-Mufti, Y., Cranwell, S., & Samant, R. S. (2022) · Elsevier eBooks · doi:10.1016/b978-0-323-91617-2.00004-3 · Cited by 1
Energetics of whole genome doubling and genomic instability
Beck, R. J., Tagal, V., Amin, S. B., Bakhoum, S. F., Maley, C. C., Verhaak, R. G. W., Gomes, A. P., & Andor, N. (2025) · Cancer Letters · doi:10.1016/j.canlet.2025.217878 · Cited by 3
Impact of Chromosomal Instability and Aneuploidy in Cancer Development
Mennie, A. K., Dhital, B., & Ly, P. (2025) · Annual Review of Cancer Biology · doi:10.1146/annurev-cancerbio-071124-101613 · Cited by 3
Developmental tolerance and disease implications of aneuploidy
Fusari, E., & Milán, M. (2026) · Current Biology · doi:10.1016/j.cub.2026.01.056 · Cited by 1
Complex networks of miRNA-transcription factors mediate gene dosage compensation in aneuploid cancerPreprint
Acón, M., Oviedo, G., Baéz, E., Vásquez-Vargas, G., Guevara-Coto, J. A., Segura-Castillo, A., Siles-Canales, F., Quirós-Barrantes, S., Mendes, P., & Mora-Rodríguez, R. A. (2020) · bioRxiv (Cold Spring Harbor Laboratory) · doi:10.1101/2020.01.31.928507 · Cited by 1
The transcriptomic and proteomic ramifications of segmental amplificationPreprint
Fritts, R. K., Ebmeier, C. C., & Copley, S. D. (2023) · bioRxiv (Cold Spring Harbor Laboratory) · doi:10.1101/2023.11.21.568005 · Cited by 1
Structural basis for co-translational assembly of homo-oligomeric proteins in cis and in transPreprint
Koubek, J., Filbeck, S., Fixen, G., Kopetschke, S., Schmitt, J. L., Pfeffer, S., Kramer, G., & Bukau, B. (2025) · bioRxiv (Cold Spring Harbor Laboratory) · doi:10.1101/2025.11.12.687954 · Cited by 1
Ribosome Quality Control Mitigates Proteotoxic Stress in Aneuploid CellsPreprint
Viganò, S., Ippolito, M. R., Scorzoni, S., Barrio, L., Loffreda, A., Rodriguez‐Muñoz, M., Donzel, D., Eliezer, Y., Vaites, L. P., Paulo, J. A., et al. (2026) · bioRxiv (Cold Spring Harbor Laboratory) · doi:10.64898/2026.01.19.700285 · Cited by 1
Self-citationExpression attenuation as a mechanism of robustness to gene duplication in protein complexesPreprint
Ascencio, D., Diss, G., Gagnon‐Arsenault, I., Dubé, A. K., DeLuna, A., & Landry, C. R. (2020) · bioRxiv (Cold Spring Harbor Laboratory) · doi:10.1101/2020.07.09.195990
Metadata
- Authors
- Brennan, C. M., Vaites, L. P., Wells, J. N., Santaguida, S., Paulo, J. A., Storchova, Z., Harper, J. W., Marsh, J. A., & Amon, A.
- Affiliations
- Howard Hughes Medical Institute (US)
- Harvard University (US)
- Western General Hospital (GB)
- ORCID
- Venue
- Genes & Development
- Publisher
- Cold Spring Harbor Laboratory
- Published
- 2019-06-13
- Volume
- 33
- Issue
- 15-16
- Pages
- 1031-1047
- ISSN
- 0890-9369 (ISSN-L)
- 1549-5477
- PMC
- PMC6672052
- OpenAlex
- W2953356987
- Cited by
- 109
- References
- 42
- Citations by year
- 2026: 10 · 2025: 15 · 2024: 16 · 2023: 14 · 2022: 14 · 2021: 18 · 2020: 19 · 2019: 3
- Type
- posted content
- Language
- en
- Open access
- hybrid
- doi.org
- Licence
- cc-by-nc
- Locations
- Genes & Development (publishedVersion, cc-by-nc)
- PubMed Central (publishedVersion, cc-by-nc)
- PubMed (publishedVersion)
- Edinburgh Research Explorer (University of Edinburgh) (acceptedVersion, other-oa)
- Archivio Istituzionale della Ricerca (Universita Degli Studi Di Milano) (submittedVersion, other-oa)
- DSpace@MIT (Massachusetts Institute of Technology) (submittedVersion, cc-by-nc)
- HighWire Press Open Archive (submittedVersion)
- Funders
- National Institutes of Health (CA206157, GM118066)
- Medical Research Council Career Development Award (MR/M02122X/1)
- American Italian Cancer Foundation
- Marie Curie Actions
- Italian Association for Cancer Research
- Koch Institute Quinquennial Cancer Research Fellowship
- Topics
- Life Sciences › Biochemistry, Genetics and Molecular Biology › Cell Biology › Microtubule and mitosis dynamics
- Life Sciences › Biochemistry, Genetics and Molecular Biology › Molecular Biology › Heat shock proteins research
- Life Sciences › Biochemistry, Genetics and Molecular Biology › Molecular Biology › Ubiquitin and proteasome pathways
- Keywords
- aneuploidy, protein aggregation, protein complex stoichiometry, proteotoxic stress, dosage compensation, protein degradation
- MeSH terms
- Aneuploidy, Cytosol, Dosage Compensation, Genetic, Humans, Saccharomyces cerevisiae, Protein Subunits, Saccharomyces cerevisiae Proteins, Multiprotein Complexes, Proteolysis, Protein Aggregation, Pathological, Protein Aggregates
About these checks
Registry, retraction, Cites and statistics results are computed, not judged, with one exception: a printed reference that no index lists is read once by a model before it counts as a citation error. Claims are extracted by a model and kept only when their quote appears verbatim in the text; each cited source is then checked, with a model’s help, for whether it says what the claim relies on. Those verdicts can be wrong — read the claim’s quote and the cited source before relying on one.
Statistics and arithmetic are recomputed, not judged.
Confidence bands are shown only for fields calibrated on our annotated test set. None is calibrated yet, so no band is shown.
What counts as a claim ›How we measure confidence ›How we check this ›
Are you an author, or do you see a problem with this page? Request a review
