

The DOI matches its Crossref record; 58 of the 59 references it cites were found in a registry or an index.
DNA methylation contributes to natural human variation
Open accessAbstract
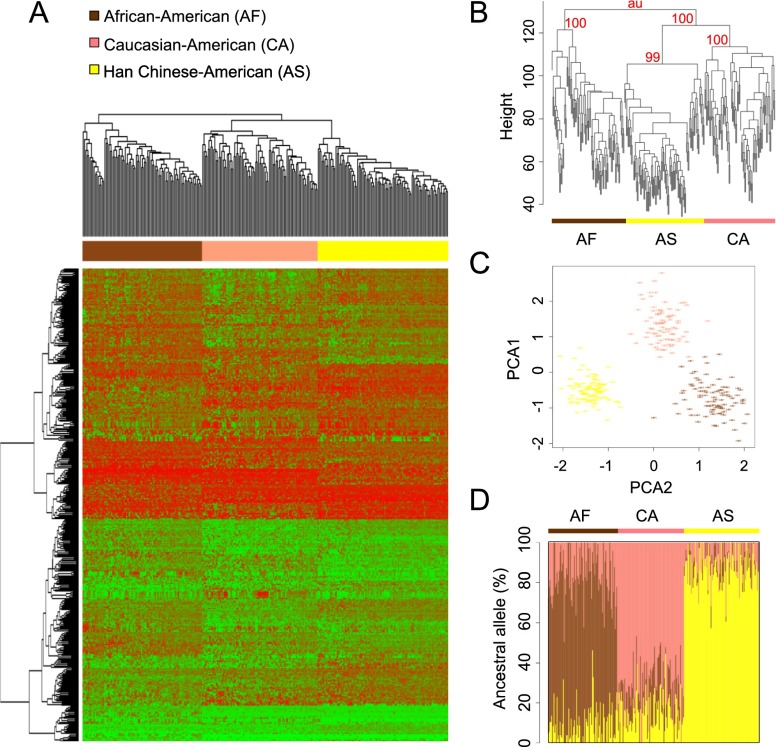
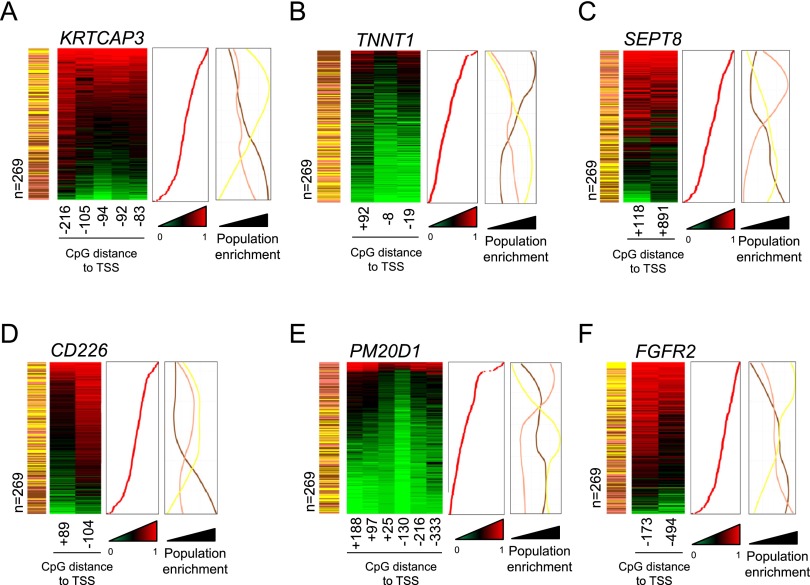
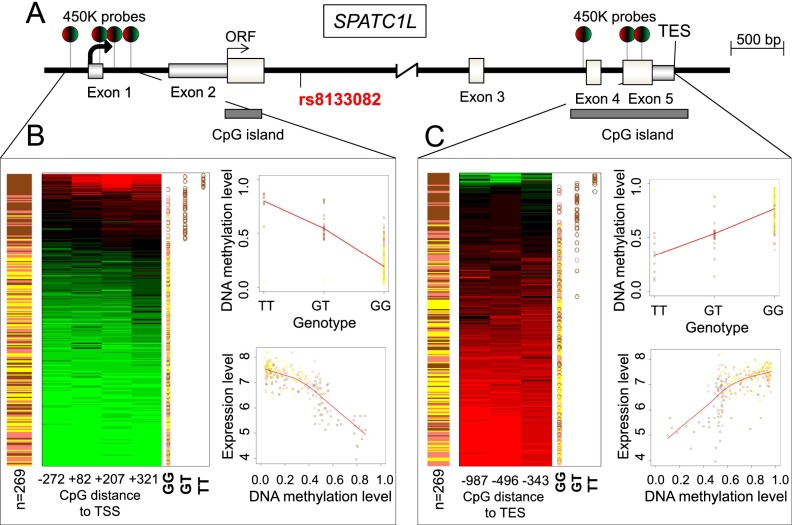
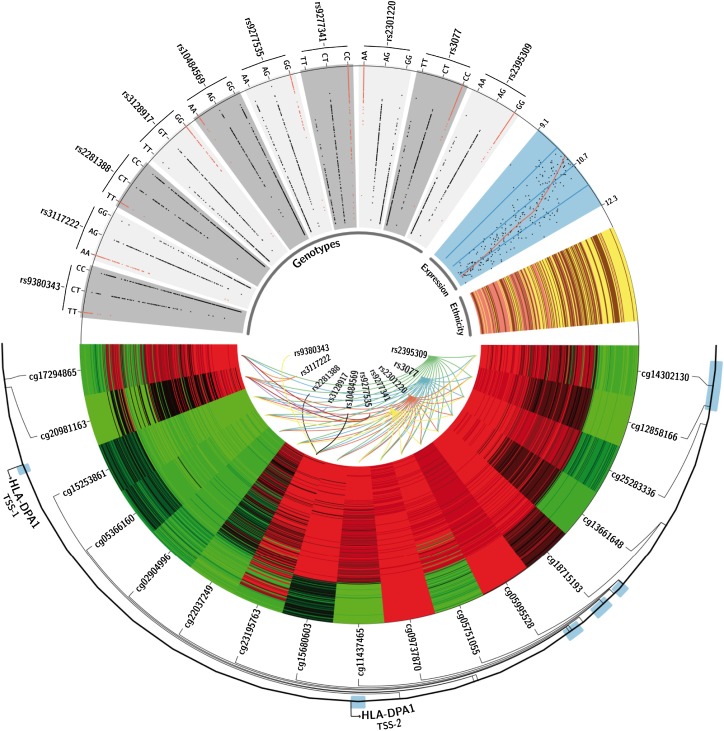
DNA methylation patterns are important for establishing cell, tissue, and organism phenotypes, but little is known about their contribution to natural human variation. To determine their contribution to variability, we have generated genome-scale DNA methylation profiles of three human populations (Caucasian-American, African-American, and Han Chinese-American) and examined the differentially methylated CpG sites. The distinctly methylated genes identified suggest an influence of DNA methylation on phenotype differences, such as susceptibility to certain diseases and pathogens, and response to drugs and environmental agents. DNA methylation differences can be partially traced back to genetic variation, suggesting that differentially methylated CpG sites serve as evolutionarily established mediators between the genetic code and phenotypic variability. Notably, one-third of the DNA methylation differences were not associated with any genetic variation, suggesting that variation in population-specific sites takes place at the genetic and epigenetic levels, highlighting the contribution of epigenetic modification to natural human variation.
Overview
The claims and statistics of this paper haven’t been checked yet.
Run the check — free, no account needed. It reads the open-access text and checks the sources it cites.
Integrity signals
Registry
Cites
Statistics
Figures
Verification
Claims the paper makes
The claims and statistics of this paper haven’t been checked yet.
Run the check — free, no account needed. It reads the open-access text and checks the sources it cites.
Claims other papers make about this one
Each is checked against this paper’s own text: does it say what the citing paper says it does?
In the citing paper
“Only Caucasian individuals were eligible for study participation based on evidence that DNA methylation varies across race/ethnicity (Bakermans-Kranenburg, & Van Iljezdoorn, 2014; Heyn, et al., 2013; Liu et al., 2010).”
From Associations between oxytocin receptor gene (OXTR) methylation, plasma oxytocin, and attachment across adulthood (2019) · cites this paper as Heyn, et al., 2013
In the citing paper
“Being the first adult developmental examination into this topic, we held race/ethnicity constant to only Caucasian participants based on evidence that DNA methylation varies across race/ethnicity (Bakermans-Kranenburg & Van Iljezdoorn, 2014, Heyn, et al., 2013, Liu et al., 2010).”
From Associations between oxytocin receptor gene (OXTR) methylation, plasma oxytocin, and attachment across adulthood (2019) · cites this paper as Heyn, et al., 2013
Self-check
Percentages, sums and reported differences re-computed from the paper’s own numbers.
The self-check needs the paper’s full text.
Citations
Cites
R: A Language and Environment for Statistical Computing
R Core Team (2000) · doi:10.32614/r.manuals · Cited by 355,893
Fast and accurate short read alignment with Burrows-Wheeler transform
Li, H., & Durbin, R. (2009) · Bioinformatics · doi:10.1093/bioinformatics/btp324 · Cited by 58,607
PLINK: a tool set for whole-genome association and population-based linkage analyses.
Purcell, S., Neale, B., Todd-Brown, K., Thomas, L., Ferreira, M. A. R., Bender, D., Maller, J., Sklar, P., de Bakker, P. I. W., Daly, M. J., et al. (2007) · The American Journal of Human Genetics · doi:10.1086/519795 · Cited by 34,089
Classification and Regression by randomForest
Liaw, A. I., & Wiener, M. C. (2007) · Cited by 18,594
An integrated encyclopedia of DNA elements in the human genome
The ENCODE Project Consortium (2012) · Nature · doi:10.1038/nature11247 · Cited by 18,072
Self-citationBioconductor: open software development for computational biology and bioinformatics
Gentleman, R. C., Carey, V. J., Bates, D. M., Bolstad, B., Dettling, M., Dudoit, S., Ellis, B., Gautier, L., Ge, Y., Gentry, J., et al. (2004) · Genome biology · doi:10.1186/gb-2004-5-10-r80 · Cited by 12,082
Circos: An information aesthetic for comparative genomicsPreprint
Krzywinski, M. I., Schein, J. E., Birol, İ., Connors, J. M., Gascoyne, R. D., Horsman, D. E., Jones, S. J. M., & Marra, M. A. (2009) · Genome Research · doi:10.1101/gr.092759.109 · Cited by 11,073
Exploration, normalization, and summaries of high density oligonucleotide array probe level data
Irizarry, R. A. (2003) · Biostatistics · doi:10.1093/biostatistics/4.2.249 · Cited by 10,603
Fast model-based estimation of ancestry in unrelated individuals
Alexander, D. H., Novembre, J., & Lange, K. (2009) · Genome Research · doi:10.1101/gr.094052.109 · Cited by 9,898
A map of human genome variation from population-scale sequencing.
The 1000 Genomes Project Consortium (2010) · Nature · doi:10.1038/nature09534 · Cited by 7,877
Functions of DNA methylation: islands, start sites, gene bodies and beyond
Jones, P. A. (2012) · Nature Reviews Genetics · doi:10.1038/nrg3230 · Cited by 6,061
affy—analysis of Affymetrix GeneChip data at the probe level
Gautier, L., Cope, L., Bolstad, B. M., & Irizarry, R. A. (2004) · Bioinformatics · doi:10.1093/bioinformatics/btg405 · Cited by 5,221
Global variation in copy number in the human genome
Redon, R., Ishikawa, S., Fitch, K. R., Feuk, L., Perry, G. H., Andrews, T. D., Fiegler, H., Shapero, M. H., Carson, A. R., Chen, W., et al. (2006) · Nature · doi:10.1038/nature05329 · Cited by 4,377
Epigenetic differences arise during the lifetime of monozygotic twins
Fraga, M. F., Ballestar, E., Paz, M. F., Ropero, S., Setien, F., Ballestar, M. L., Heine-Suñer, D., Cigudosa, J. C., Urioste, M., Benitez, J., et al. (2005) · Proceedings of the National Academy of Sciences · doi:10.1073/pnas.0500398102 · Cited by 3,602
Self-citationEpigenetic modifications and human disease
Portela, A., & Esteller, M. (2010) · Nature Biotechnology · doi:10.1038/nbt.1685 · Cited by 2,938
Self-citationMapping and analysis of chromatin state dynamics in nine human cell types
Ernst, J., Kheradpour, P., Mikkelsen, T. S., Shoresh, N., Ward, L. D., Epstein, C. B., Zhang, X., Wang, L., Issner, R., Coyne, M., et al. (2011) · Nature · doi:10.1038/nature09906 · Cited by 2,898
Self-citationEpigenetic Transgenerational Actions of Endocrine Disruptors and Male Fertility
Anway, M. D., Cupp, A. S., Uzumcu, M., & Skinner, M. K. (2005) · Science · doi:10.1126/science.1108190 · Cited by 2,563
Pvclust: an R package for assessing the uncertainty in hierarchical clustering
Suzuki, R., & Shimodaira, H. (2006) · Bioinformatics · doi:10.1093/bioinformatics/btl117 · Cited by 2,456
lumi : a pipeline for processing Illumina microarray
Du, P., Kibbe, W. A., & Lin, S. M. (2008) · Bioinformatics · doi:10.1093/bioinformatics/btn224 · Cited by 2,028
Transposable elements: targets for early nutritional effects on epigenetic gene regulation
Waterland, R. A., & Jirtle, R. L. (2003) · Molecular and Cellular Biology · doi:10.1128/mcb.23.15.5293-5300.2003 · Cited by 2,019
Capturing Heterogeneity in Gene Expression Studies by Surrogate Variable Analysis
Leek, J. T., & Storey, J. D. (2007) · PLoS Genetics · doi:10.1371/journal.pgen.0030161 · Cited by 1,930
Worldwide Human Relationships Inferred from Genome-Wide Patterns of Variation
Li, J. Z., Absher, D. M., Tang, H., Southwick, A. M., Casto, A. M., Ramachandran, S., Cann, H. M., Barsh, G. S., Feldman, M. W., Cavalli-Sforza, L. L., et al. (2008) · Science · doi:10.1126/science.1153717 · Cited by 1,915
Phenotypic plasticity and the epigenetics of human disease
Feinberg, A. P. (2007) · Nature · doi:10.1038/nature05919 · Cited by 1,613
Validation of a DNA methylation microarray for 450,000 CpG sites in the human genome
Sandoval, J., Heyn, H., Moran, S., Serra-Musach, J., Pujana, M. A., Bibikova, M., & Esteller, M. (2011) · Epigenetics · doi:10.4161/epi.6.6.16196 · Cited by 990
Self-citationDNA methylation patterns associate with genetic and gene expression variation in HapMap cell lines
Bell, J. T., Pai, A. A., Pickrell, J. K., Gaffney, D. J., Pique-Regi, R., Degner, J. F., Gilad, Y., & Pritchard, J. K. (2011) · Genome Biology · doi:10.1186/gb-2011-12-1-r10 · Cited by 838
Abundant quantitative trait loci exist for DNA methylation and gene expression in human brain
Gibbs, J. R., van der Brug, M. P., Hernandez, D. G., Traynor, B. J., Nalls, M. A., Lai, S.-L., Arepalli, S., Dillman, A., Rafferty, I. P., Troncoso, J., et al. (2010) · PLoS Genetics · doi:10.1371/journal.pgen.1000952 · Cited by 769
Nuclear Cloning and Epigenetic Reprogramming of the Genome
Rideout, W. M., Eggan, K. C., & Jaenisch, R. (2001) · Science · doi:10.1126/science.1063206 · Cited by 756
Bryne, J. C., Valen, E., Tang, M. E., Marstrand, T. T., Winther, O., da Piedade, I., Krogh, A., Lenhard, B., & Sandelin, A. (2007) · Nucleic Acids Research · doi:10.1093/nar/gkm955 · Cited by 702
Bell, J. T., Tsai, P.-C., Yang, T.-P., Pidsley, R., Nisbet, J. P., Glass, D., Mangino, M., Zhai, G., Zhang, F., Valdes, A. M., et al. (2012) · PLoS Genetics · doi:10.1371/journal.pgen.1002629 · Cited by 700
DNA methylation profiles in monozygotic and dizygotic twins
Kaminsky, Z. A., Tang, T., Wang, S.-C., Ptak, C., Oh, G., Wong, A. H. C., Feldcamp, L. A., Virtanen, C., Halfvarson, J., Tysk, C., et al. (2009) · Nature Genetics · doi:10.1038/ng.286 · Cited by 680
Epigenomic analysis detects widespread gene-body DNA hypomethylation in chronic lymphocytic leukemia
Kulis, M., Heath, S. C., Bibikova, M. V., Queirós, A. C., Navarro, A., Clot, G., Martínez‐Trillos, A., Castellano, G., Heath, I. B., Pinyol, M., et al. (2012) · Nature Genetics · doi:10.1038/ng.2443 · Cited by 581
Evaluation of the Infinium Methylation 450K technology
Dedeurwaerder, S., Defrance, M., Calonne, E., Denis, H., Sotiriou, C., & Fuks, F. (2011) · Epigenomics · doi:10.2217/epi.11.105 · Cited by 569
The Antisense Transcriptomes of Human Cells
He, Y., Vogelstein, B., Velculescu, V. E., Papadopoulos, N., & Kinzler, K. W. (2008) · Science · doi:10.1126/science.1163853 · Cited by 531
Feinberg, A. P., & Irizarry, R. A. (2009) · Proceedings of the National Academy of Sciences · doi:10.1073/pnas.0906183107 · Cited by 524
Kamatani, Y., Wattanapokayakit, S., Ochi, H., Kawaguchi, T., Takahashi, A., Hosono, N., Kubo, M., Tsunoda, T., Kamatani, N., Kumada, H., et al. (2009) · Nature Genetics · doi:10.1038/ng.348 · Cited by 514
Zambelli, F., Pesole, G., & Pavesi, G. (2009) · Nucleic Acids Research · doi:10.1093/nar/gkp464 · Cited by 402
Genetic Control of Individual Differences in Gene-Specific Methylation in Human Brain
Zhang, D., Cheng, L., Badner, J. A., Chen, C., Chen, Q., Luo, W., Craig, D. W., Redman, M., Gershon, E. S., & Liu, C. (2010) · The American Journal of Human Genetics · doi:10.1016/j.ajhg.2010.02.005 · Cited by 395
Age-associated DNA methylation in pediatric populationsPreprint
Alisch, R. S., Barwick, B. G., Chopra, P., Myrick, L. K., Satten, G. A., Conneely, K. N., & Warren, S. T. (2012) · Genome Research · doi:10.1101/gr.125187.111 · Cited by 388
Lachance, J., Vernot, B., Elbers, C. C., Ferwerda, B., Froment, A., Bodo, J.-M., Lema, G., Fu, W., Nyambo, T., Rebbeck, T. R., et al. (2012) · Cell · doi:10.1016/j.cell.2012.07.009 · Cited by 343
Reversible switching between epigenetic states in honeybee behavioral subcastes
Herb, B. R., Wolschin, F., Hansen, K. D., Aryee, M. J., Langmead, B., Irizarry, R. A., Amdam, G. V., & Feinberg, A. P. (2012) · Nature Neuroscience · doi:10.1038/nn.3218 · Cited by 339
Inheritance of Stress-Induced, ATF-2-Dependent Epigenetic Change
Seong, K.-H., Li, D., Shimizu, H., Nakamura, R., & Ishii, S. (2011) · Cell · doi:10.1016/j.cell.2011.05.029 · Cited by 322
Population-specificity of human DNA methylation
Fraser, H. B., Lam, L. L., Neumann, S. M., & Kobor, M. S. (2012) · Genome Biology · doi:10.1186/gb-2012-13-2-r8 · Cited by 313
Daddy Issues: Paternal Effects on Phenotype
Rando, O. J. (2012) · Cell · doi:10.1016/j.cell.2012.10.020 · Cited by 292
Multigenerational epigenetic adaptation of the hepatic wound-healing response
Zeybel, M., Hardy, T., Wong, Y. K., Mathers, J. C., Fox, C. R., Gackowska, A., Oakley, F., Burt, A. D., Wilson, C. L., Anstee, Q. M., et al. (2012) · Nature Medicine · doi:10.1038/nm.2893 · Cited by 279
Michaud, E. J., van Vugt, M. J., Bultman, S. J., Sweet, H. O., Davisson, M. T., & Woychik, R. P. (1994) · Genes & Development · doi:10.1101/gad.8.12.1463 · Cited by 279
Epigenetic reprogramming of host genes in viral and microbial pathogenesis
Paschos, K., & Allday, M. J. (2010) · Trends in Microbiology · doi:10.1016/j.tim.2010.07.003 · Cited by 232
GWASdb: a database for human genetic variants identified by genome-wide association studies
Li, M. J., Wang, P., Liu, X., Lim, E. L., Wang, Z., Yeager, M., Wong, M. P., Sham, P. C., Chanock, S. J., & Wang, J. (2011) · Nucleic Acids Research · doi:10.1093/nar/gkr1182 · Cited by 218
Gemcitabine and Cytosine Arabinoside Cytotoxicity: Association with Lymphoblastoid Cell Expression
Li, L., Fridley, B. L., Kalari, K. R., Jenkins, G. D., Batzler, A. J., Safgren, S. L., Hildebrandt, M. A. T., Ames, M. M., Schaid, D. J., & Wang, L. (2008) · Cancer Research · doi:10.1158/0008-5472.can-08-0405 · Cited by 177
Self-citationNiu, N., Qin, Y., Fridley, B. L., Hou, J., Kalari, K. R., Zhu, M., Wu, T., Jenkins, G. D., Batzler, A. J., & Wang, L. (2010) · Genome Research · doi:10.1101/gr.107672.110 · Cited by 144
Self-citationDetection and interpretation of expression quantitative trait loci (eQTL)
Michaelson, J. J., Loguercio, S., & Beyer, A. (2009) · Methods · doi:10.1016/j.ymeth.2009.03.004 · Cited by 140
de Assis, S., Wärri, A. M., Cruz, M. I., Laja, O., Tian, Y., Zhang, B., Wang, Y., Huang, T. H. ‐., & Hilakivi‐Clarke, L. (2012) · Nature Communications · doi:10.1038/ncomms2058 · Cited by 130
OʼBrien, T. R., Kohaar, I., Pfeiffer, R. M., Maeder, D. L., Yeager, M., Schadt, E. E., & Prokunina‐Olsson, L. (2011) · Genes and Immunity · doi:10.1038/gene.2011.11 · Cited by 106
Li, L. (2009) · Journal of Computational Biology · doi:10.1089/cmb.2008.16tt · Cited by 97
Genomic predictors of interindividual differences in response to DNA damaging agentsPreprint
Fry, R. C., Svensson, J. P., Valiathan, C., Wang, E. Y., Hogan, B. J., Bhattacharya, S., Bugni, J. M., Whittaker, C. A., & Samson, L. D. (2008) · Genes & Development · doi:10.1101/gad.1688508 · Cited by 75
Genetic and epigenetic contribution to complex traits
Kilpinen, H., & Dermitzakis, E. T. (2012) · Human Molecular Genetics · doi:10.1093/hmg/dds383 · Cited by 68
Model-based gene set analysis for Bioconductor
Bauer, S., Robinson, P. N., & Gagneur, J. (2011) · Bioinformatics · doi:10.1093/bioinformatics/btr296 · Cited by 67
Data-driven assessment of eQTL mapping methods
Michaelson, J. J., Alberts, R., Schughart, K., & Beyer, A. (2010) · BMC Genomics · doi:10.1186/1471-2164-11-502 · Cited by 50
Mercier, E., Droit, A., Li, L., Robertson, G., Zhang, X., & Gottardo, R. (2011) · PLoS ONE · doi:10.1371/journal.pone.0016432 · Cited by 47
Cited by
Sorted by citations
The role of regulatory variation in complex traits and disease
Albert, F. W., & Kruglyak, L. (2015) · Nature Reviews Genetics · doi:10.1038/nrg3891 · Cited by 1,047
Preprocessing, normalization and integration of the Illumina HumanMethylationEPIC array with minfi
Fortin, J.-P., Triche, T. J., & Hansen, K. D. (2016) · Bioinformatics · doi:10.1093/bioinformatics/btw691 · Cited by 871
An epigenetic clock analysis of race/ethnicity, sex, and coronary heart disease
Horvath, S., Gurven, M., Levine, M. E., Trumble, B. C., Kaplan, H. S., Allayee, H., Ritz, B. R., Chen, B. H., Lu, A. T.-H., Rickabaugh, T. M., et al. (2016) · Genome biology · doi:10.1186/s13059-016-1030-0 · Cited by 749
Morán, S., Arribas, C., & Esteller, M. (2015) · Epigenomics · doi:10.2217/epi.15.114 · Cited by 721
Self-citationSystematic identification of genetic influences on methylation across the human life course
Gaunt, T. R., Shihab, H. A., Hemani, G., Min, J. L., Woodward, G., Lyttleton, O., Zheng, J., Duggirala, A., McArdle, W. L., Ho, K., et al. (2016) · Genome Biology · doi:10.1186/s13059-016-0926-z · Cited by 598
Metadata
- Authors
- Heyn, H., Moran, S., Hernando-Herraez, I., Sayols, S., Gomez, A., Sandoval, J., Monk, D., Hata, K., Marques-Bonet, T., Wang, L., & Esteller, M.
- Affiliations
- Institut d'Investigació Biomédica de Bellvitge (ES)
- Consejo Superior de Investigaciones Científicas (ES)
- National Research Institute for Child Health and Development (JP)
- Mayo Clinic (US)
- Institució Catalana de Recerca i Estudis Avançats (ES)
- Corresponding author
- Wang, Liewei
- Esteller, Manel
- ORCID
- Venue
- Genome Research
- Publisher
- Cold Spring Harbor Laboratory
- Published
- 2013-08-01
- Volume
- 23
- Issue
- 9
- Pages
- 1363-1372
- ISSN
- 1088-9051 (ISSN-L)
- PMC
- PMC3759714
- OpenAlex
- W2095727856
- Cited by
- 408
- References
- 59
- Citations by year
- 2026: 8 · 2025: 18 · 2024: 22 · 2023: 23 · 2022: 34 · 2021: 19 · 2020: 40 · 2019: 29 · 2018: 49 · 2017: 40 · 2016: 46 · 2015: 54 · 2014: 22 · 2013: 3
- Type
- posted content
- Language
- en
- Open access
- hybrid
- doi.org
- Licence
- other-oa
- Locations
- Genome Research (publishedVersion, other-oa)
- Europe PMC (PubMed Central) (publishedVersion, cc-by-nc)
- PubMed Central (publishedVersion, cc-by-nc)
- PubMed (publishedVersion)
- RECERCAT (Consorci de Serveis Universitaris de Catalunya) (publishedVersion, other-oa)
- DIGITAL.CSIC (Spanish National Research Council (CSIC)) (submittedVersion, cc-by-nc)
- Dipòsit Digital de la Universitat de Barcelona (Universitat de Barcelona) (submittedVersion, cc-by-nc)
- HighWire Press Open Archive (submittedVersion)
- Repositori digital de la UPF (Universitat Pompeu Fabra) (submittedVersion, cc-by-nc)
- Funders
- Fundación Cellex (SAF2011-22803)
- European Commission (282510)
- Generalitat de Catalunya
- Institució Catalana de Recerca i Estudis Avançats
- Ministerio de Ciencia e Innovación (SAF2011-22803, BFU2011-28549)
- National Institutes of Health (GM61388)
- National Cancer Institute (CA138461, R01CA138461)
- National Institute of General Medical Sciences (U01GM061388, U19GM061388, GM61388)
- FP7 Ideas: European Research Council (268626, 260372)
- Topics
- Life Sciences › Biochemistry, Genetics and Molecular Biology › Molecular Biology › Epigenetics and DNA Methylation
- Life Sciences › Biochemistry, Genetics and Molecular Biology › Genetics › Genetic Associations and Epidemiology
- Life Sciences › Biochemistry, Genetics and Molecular Biology › Molecular Biology › Genomics and Chromatin Dynamics
- Keywords
- DNA methylation, differentially methylated CpG sites, epigenetic inheritance, genetic variation, disease susceptibility, drug response, phenotypic variability, African Americans, Han Chinese, White Americans
- MeSH terms
- Adult, Asian, Black or African American, Female, Humans, Male, Population, Genetic Variation, Genome, Human, DNA Methylation, Quantitative Trait Loci, Epigenesis, Genetic, White People, Genome-Wide Association Study
About these checks
Registry, retraction, Cites and statistics results are computed, not judged, with one exception: a printed reference that no index lists is read once by a model before it counts as a citation error. Claims are extracted by a model and kept only when their quote appears verbatim in the text; each cited source is then checked, with a model’s help, for whether it says what the claim relies on. Those verdicts can be wrong — read the claim’s quote and the cited source before relying on one.
Statistics and arithmetic are recomputed, not judged.
Confidence bands are shown only for fields calibrated on our annotated test set. None is calibrated yet, so no band is shown.
What counts as a claim ›How we measure confidence ›How we check this ›
Are you an author, or do you see a problem with this page? Request a review
