

The DOI matches its Crossref record; 62 of the 62 references it cites were found in a registry or an index.
DNA methylation patterns associate with genetic and gene expression variation in HapMap cell lines
Open accessAbstract
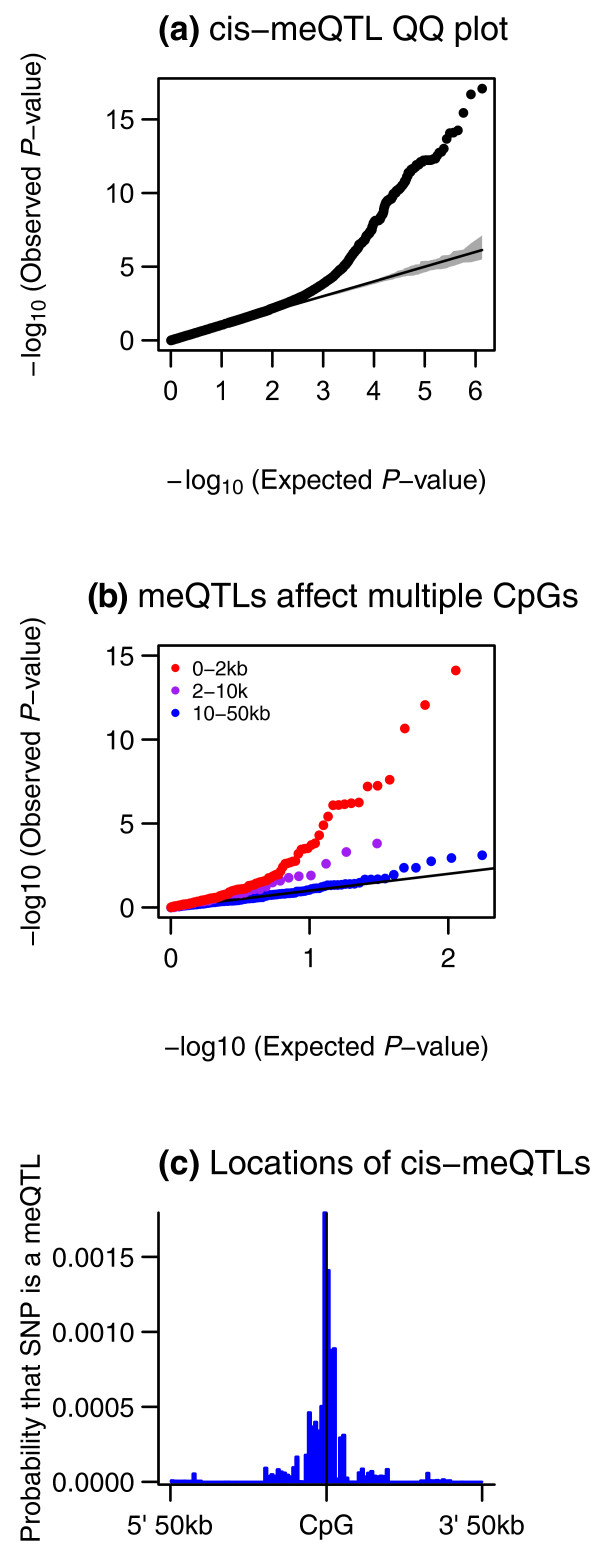
BACKGROUND: DNA methylation is an essential epigenetic mechanism involved in gene regulation and disease, but little is known about the mechanisms underlying inter-individual variation in methylation profiles. Here we measured methylation levels at 22,290 CpG dinucleotides in lymphoblastoid cell lines from 77 HapMap Yoruba individuals, for which genome-wide gene expression and genotype data were also available. RESULTS: Association analyses of methylation levels with more than three million common single nucleotide polymorphisms (SNPs) identified 180 CpG-sites in 173 genes that were associated with nearby SNPs (putatively in cis, usually within 5 kb) at a false discovery rate of 10%. The most intriguing trans signal was obtained for SNP rs10876043 in the disco-interacting protein 2 homolog B gene (DIP2B, previously postulated to play a role in DNA methylation), that had a genome-wide significant association with the first principal component of patterns of methylation; however, we found only modest signal of trans-acting associations overall. As expected, we found significant negative correlations between promoter methylation and gene expression levels measured by RNA-sequencing across genes. Finally, there was a significant overlap of SNPs that were associated with both methylation and gene expression levels. CONCLUSIONS: Our results demonstrate a strong genetic component to inter-individual variation in DNA methylation profiles. Furthermore, there was an enrichment of SNPs that affect both methylation and gene expression, providing evidence for shared mechanisms in a fraction of genes.
Overview
The claims and statistics of this paper haven’t been checked yet.
Free: it reads the open-access text and checks the first 5 claims that cite a source we can check. Create a free account to check every claim.
Integrity signals
Registry
Cites
Statistics
Figures




Verification
Claims the paper makes
The claims and statistics of this paper haven’t been checked yet.
Free: it reads the open-access text and checks the first 5 claims that cite a source we can check. Create a free account to check every claim.
Claims other papers make about this one
Each is checked against this paper’s own text: does it say what the citing paper says it does?
In the citing paper
“Over a dozen of meQTL studies of numerous tissues (e.g. peripheral blood, lung, brain, adipose tissue and tumor tissues) have been reported by correlating the genome-wide SNP data with tissue-specific DNA methylome data (Bell et al., 2011; Drong et al., 2013; Gibbs et al., 2010; Grundberg et al., 2013; Gutierrez-Arcelus et al., 2013; Heyn et al., 2013; Heyn et al., 2014; Shi et al., 2014; A. K. SM”
From Integrative Analysis of Multi-omics Data for Discovery and Functional Studies of Complex Human Diseases (2016) · cites this paper as Bell et al., 2011
Self-check
Percentages, sums and reported differences re-computed from the paper’s own numbers.
The self-check needs the paper’s full text.
Citations
Cites
<tt>BLAT</tt> —The <tt>BLAST</tt> -Like Alignment Tool
Kent, W. J. (2002) · Genome Research · doi:10.1101/gr.229202 · Cited by 8,480
Bolstad, B. M., Irizarry, R. A., Åstrand, M., & Speed, T. P. (2003) · Bioinformatics · doi:10.1093/bioinformatics/19.2.185 · Cited by 8,266
The ENCODE Project Consortium (2007) · Nature · doi:10.1038/nature05874 · Cited by 5,223
Human DNA methylomes at base resolution show widespread epigenomic differences
Lister, R., Pelizzola, M., Dowen, R. H., Hawkins, R. D., Hon, G., Tonti-Filippini, J., Nery, J. R., Lee, L., Ye, Z., Ngo, Q.-M., et al. (2009) · Nature · doi:10.1038/nature08514 · Cited by 4,673
A second generation human haplotype map of over 3.1 million SNPs
The International HapMap Consortium (2007) · Nature · doi:10.1038/nature06258 · Cited by 4,438
CpG Islands in vertebrate genomes
Gardiner-Garden, M., & Frommer, M. (1987) · Journal of Molecular Biology · doi:10.1016/0022-2836(87)90689-9 · Cited by 3,353
Mapping short DNA sequencing reads and calling variants using mapping quality scores
Li, H., Ruan, J., & Durbin, R. (2008) · Genome Research · doi:10.1101/gr.078212.108 · Cited by 2,638
Histone modifications at human enhancers reflect global cell-type-specific gene expression
Heintzman, N. D., Hon, G. C., Hawkins, R. D., Kheradpour, P., Stark, A., Harp, L. F., Ye, Z., Lee, L. K., Stuart, R. K., Ching, C. W., et al. (2009) · Nature · doi:10.1038/nature07829 · Cited by 2,533
Linking DNA methylation and histone modification: patterns and paradigms
Cedar, H., & Bergman, Y. (2009) · Nature Reviews Genetics · doi:10.1038/nrg2540 · Cited by 2,267 · cited 1×
“DNA methylation is thought to interact with histone modifications during the regulation of gene-expression [36,37].”
Weber, M., Hellmann, I., Stadler, M. B., Ramos, L., Pääbo, S., Rebhan, M., & Schübeler, D. (2007) · Nature Genetics · doi:10.1038/ng1990 · Cited by 2,221
Research works printed but not linked: 4
- Complete methylation data and results. [ https://doi.org/eqtl.uchicago.edu/ ]
- NCBI Gene Expression Omnibus. [ https://doi.org/www.ncbi.nlm.nih.gov/geo/ ]
- The 1000 genomes project. [ https://doi.org/www.1000genomes.org/ ]
- CENTIPEDE. [ https://doi.org/centipede.uchicago.edu ]
Cited by
DNA methylation age of human tissues and cell types
Horvath, S. (2013) · Genome Biology · doi:10.1186/gb-2013-14-10-r115 · Cited by 7,075
Genome-wide methylation profiles reveal quantitative views of human aging rates
Hannum, G., Guinney, J., Zhao, L., Zhang, L., Hughes, G., Sadda, S., Klotzle, B., Bibikova, M., Fan, J.-B., Gao, Y., et al. (2013) · Molecular Cell · doi:10.1016/j.molcel.2012.10.016 · Cited by 4,270
“, methylation quantitative-trait loci ormeQTLs (Bell et al., 2011).”
10 Years of GWAS Discovery: Biology, Function, and Translation
Visscher, P. M., Wray, N. R., Zhang, Q., Sklar, P., McCarthy, M. I., Brown, M. A., & Yang, J. (2017) · The American Journal of Human Genetics · doi:10.1016/j.ajhg.2017.06.005 · Cited by 3,719
High density DNA methylation array with single CpG site resolution
Bibikova, M., Barnes, B., Tsan, C., Ho, V., Klotzle, B., Le, J. M., Delano, D., Zhang, L., Schroth, G. P., Gunderson, K. L., et al. (2011) · Genomics · doi:10.1016/j.ygeno.2011.07.007 · Cited by 1,727
“And while important questions pertaining to study design remain, the potential value of epigenome-wide association studies as well as the integration of genotype and methylation data across sample populations has already begun to be explored [13,37,38].”
BackgroundDeep learning for computational biology
Angermueller, C., Pärnamaa, T., Parts, L., & Stegle, O. (2016) · Molecular Systems Biology · doi:10.15252/msb.20156651 · Cited by 1,473
Metadata
- Authors
- Bell, J. T., Pai, A. A., Pickrell, J. K., Gaffney, D. J., Pique-Regi, R., Degner, J. F., Gilad, Y., & Pritchard, J. K.
- Affiliations
- Centre for Human Genetics (GB)
- University of Chicago (US)
- Howard Hughes Medical Institute (US)
- Corresponding author
- Bell, Jordana T
- Gilad, Yoav
- Pritchard, Jonathan K
- Venue
- Genome Biology
- Published
- 2011-01
- Volume
- 12
- Issue
- 1
- Pages
- R10-R10
- ISSN
- 1465-6906 (ISSN-L)
- 1474-760X
- PMC
- PMC3091299
- OpenAlex
- W2125700595
- Cited by
- 838
- References
- 62
- Citations by year
- 2026: 9 · 2025: 17 · 2024: 25 · 2023: 35 · 2022: 35 · 2021: 49 · 2020: 52 · 2019: 53 · 2018: 65 · 2017: 77 · 2016: 88 · 2015: 87 · 2014: 92 · 2013: 75 · 2012: 61
- FWCI
- 31.61
- Type
- journal article
- Language
- en
- Open access
- gold
- doi.org
- Licence
- cc-by
- creativecommons.org/licenses/by/2.0 (tdm)
- Locations
- Genome biology (publishedVersion, cc-by)
- PubMed Central (publishedVersion, cc-by)
- PubMed (publishedVersion)
- Research Portal (King's College London) (publishedVersion, cc-by)
- Funders
- Howard Hughes Medical Institute
- American Heart Association
- National Institutes of Health
- National Institute of Mental Health (R01MH084703)
- National Institute of General Medical Sciences (GM077959, R01GM077959, T 532 GM007197-34, T32GM007197)
- Topics
- Life Sciences › Biochemistry, Genetics and Molecular Biology › Molecular Biology › Epigenetics and DNA Methylation
- Life Sciences › Biochemistry, Genetics and Molecular Biology › Genetics › Genetic Associations and Epidemiology
- Life Sciences › Biochemistry, Genetics and Molecular Biology › Molecular Biology › Genomics and Chromatin Dynamics
- Keywords
- DNA methylation, epigenetics, single nucleotide polymorphisms, promoter methylation, gene expression, interindividual variability, lymphoblastoid cell lines, Yoruba, HapMap, CpG sites
- MeSH terms
- Cell Line, Gene Expression Regulation, Genotype, Histones, Humans, Promoter Regions, Genetic, Transcription, Genetic, Genome, Human, DNA Methylation, Polymorphism, Single Nucleotide, Quantitative Trait Loci, Epigenesis, Genetic, Genome-Wide Association Study, HapMap Project
About these checks
Registry, retraction, Cites and statistics results are computed, not judged, with one exception: a printed reference that no index lists is read once by a model before it counts as a citation error. Claims are extracted by a model and kept only when their quote appears verbatim in the text; each cited source is then checked, with a model’s help, for whether it says what the claim relies on. Those verdicts can be wrong — read the claim’s quote and the cited source before relying on one.
Statistics and arithmetic are recomputed, not judged.
Confidence bands are shown only for fields calibrated on our annotated test set. None is calibrated yet, so no band is shown.
What counts as a claim ›How we measure confidence ›How we check this ›
Are you an author, or do you see a problem with this page? Request a review
How to cite
Cite CoChat for the checks on this page, and the paper for its own findings.
- This page
- CoChat. (2026). Citation check: DNA methylation patterns associate with genetic and gene expression variation in HapMap cell lines. https://app.cochat.ai/papers/10.1186/gb-2011-12-1-r10
- The paper
- Bell, J. T., Pai, A. A., Pickrell, J. K., Gaffney, D. J., Pique-Regi, R., Degner, J. F., Gilad, Y., & Pritchard, J. K. (2011). DNA methylation patterns associate with genetic and gene expression variation in HapMap cell lines. Genome Biology. https://doi.org/10.1186/gb-2011-12-1-r10
Data sources
Bibliographic data: Semantic Scholar, OpenAlex, Crossref.
Contains information from the Semantic Scholar Academic Graph Datasets, made available under the ODC Attribution License (ODC-BY 1.0).
Semantic Scholar’s data is described in: Kinney, R., et al. (2023). The Semantic Scholar Open Data Platform. arXiv:2301.10140.
