

The DOI matches its Crossref record; 12 of the 12 references it cites were found in a registry or an index.
Widespread contribution of transposable elements to the innovation of gene regulatory networks
Abstract
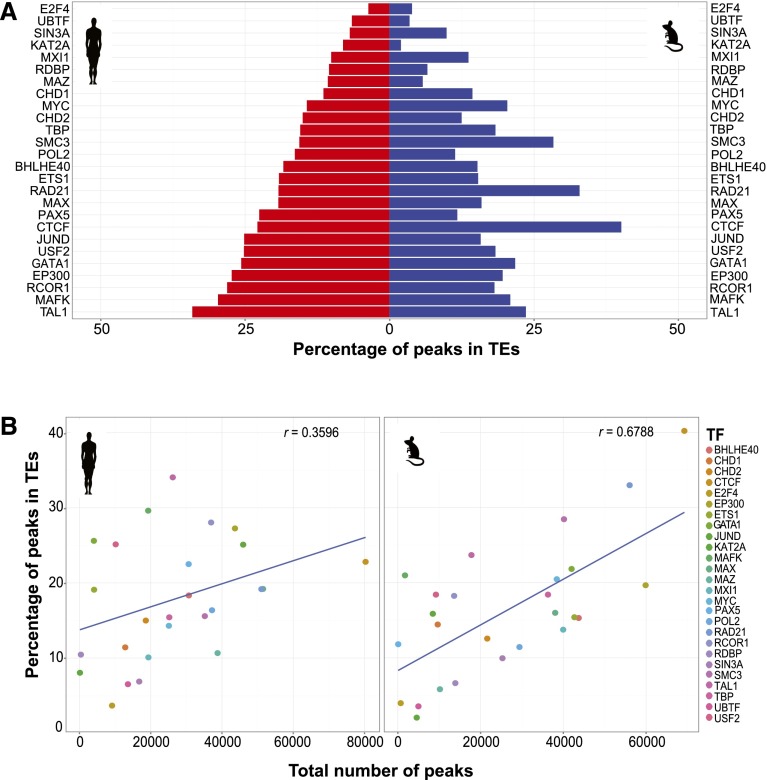
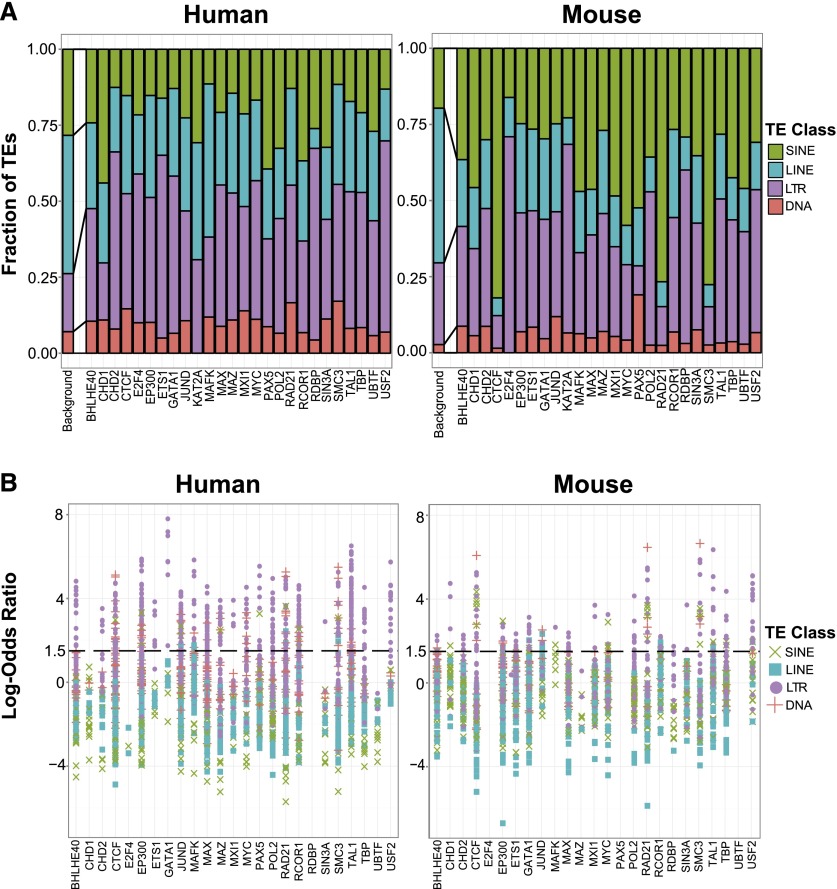
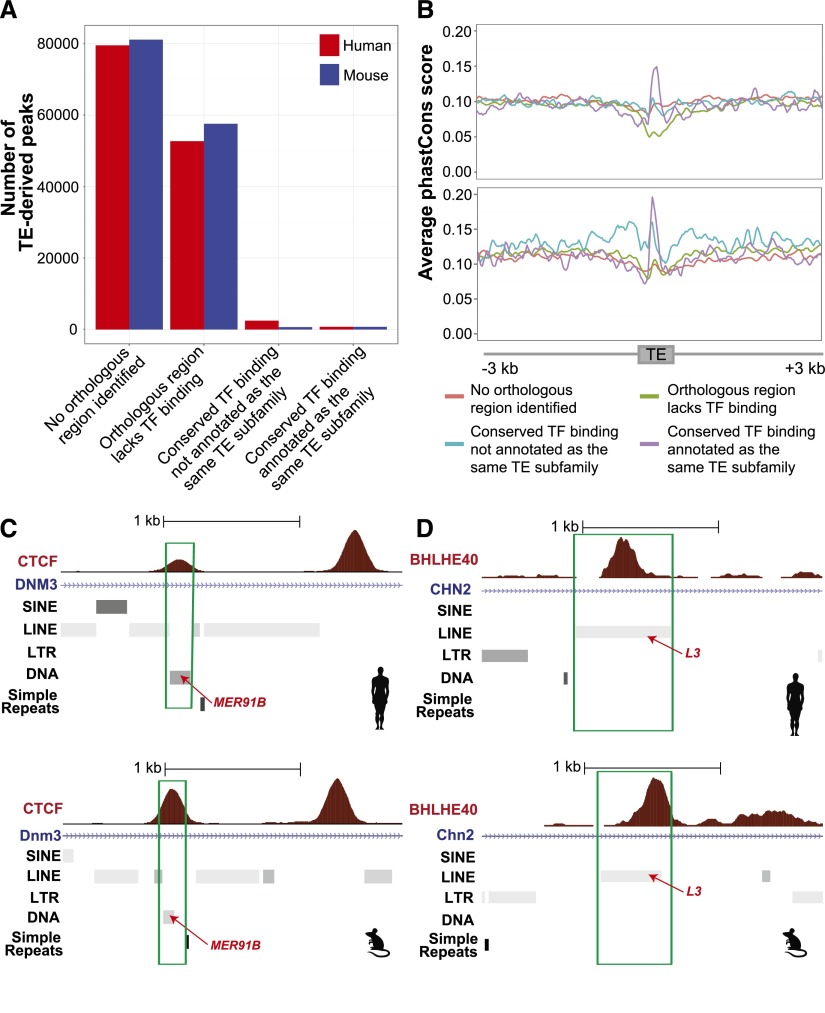
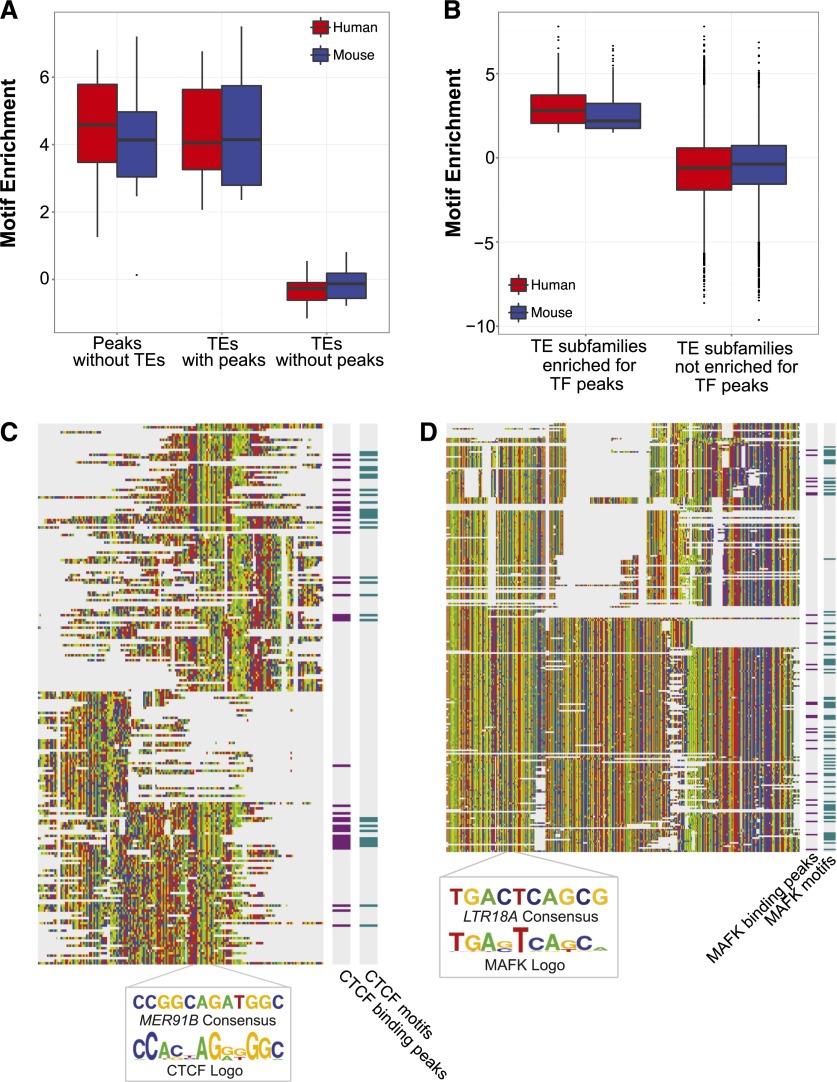
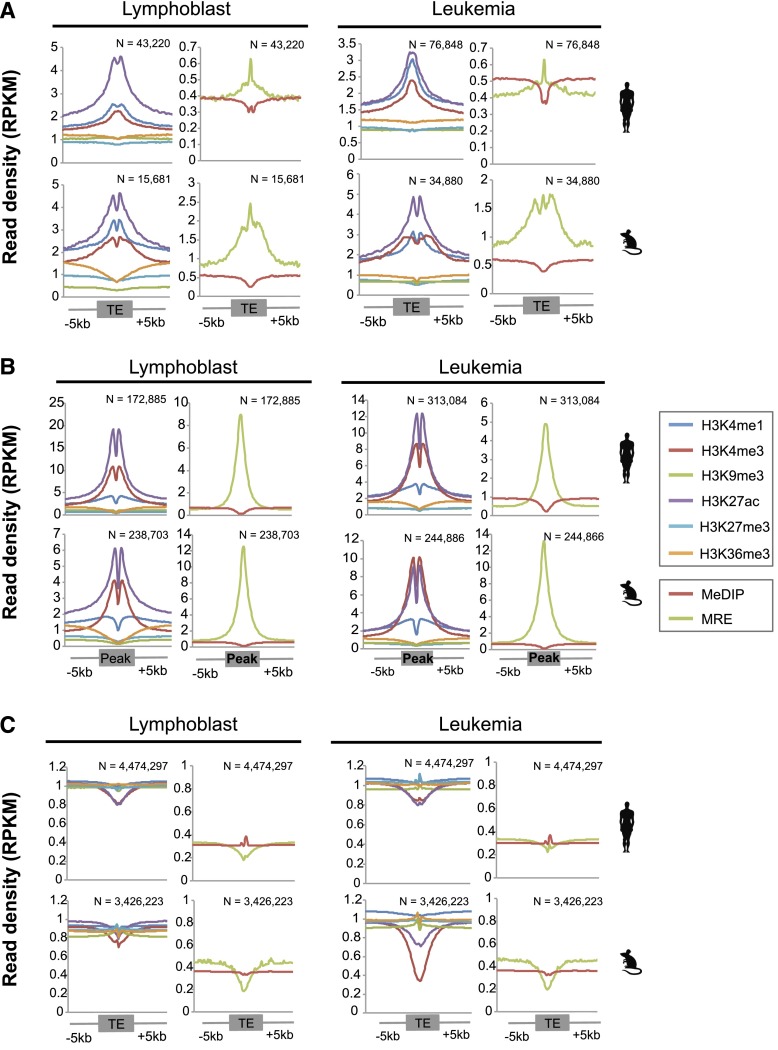
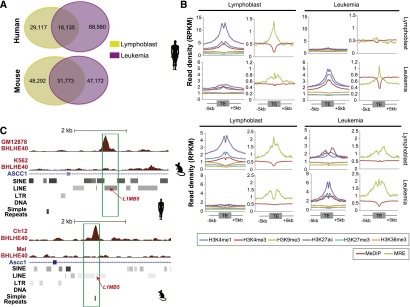
Transposable elements (TEs) have been shown to contain functional binding sites for certain transcription factors (TFs). However, the extent to which TEs contribute to the evolution of TF binding sites is not well known. We comprehensively mapped binding sites for 26 pairs of orthologous TFs in two pairs of human and mouse cell lines (representing two cell lineages), along with epigenomic profiles, including DNA methylation and six histone modifications. Overall, we found that 20% of binding sites were embedded within TEs. This number varied across different TFs, ranging from 2% to 40%. We further identified 710 TF–TE relationships in which genomic copies of a TE subfamily contributed a significant number of binding peaks for a TF, and we found that LTR elements dominated these relationships in human. Importantly, TE-derived binding peaks were strongly associated with open and active chromatin signatures, including reduced DNA methylation and increased enhancer-associated histone marks. On average, 66% of TE-derived binding events were cell type-specific with a cell type-specific epigenetic landscape. Most of the binding sites contributed by TEs were species-specific, but we also identified binding sites conserved between human and mouse, the functional relevance of which was supported by a signature of purifying selection on DNA sequences of these TEs. Interestingly, several TFs had significantly expanded binding site landscapes only in one species, which were linked to species-specific gene functions, suggesting that TEs are an important driving force for regulatory innovation. Taken together, our data suggest that TEs have significantly and continuously shaped gene regulatory networks during mammalian evolution.
Overview
The claims and statistics of this paper haven’t been checked yet.
Run the check — free, no account needed. It reads the open-access text and checks the sources it cites.
Integrity signals
Registry
Cites
Statistics
Figures
Verification
Claims the paper makes
The claims and statistics of this paper haven’t been checked yet.
Run the check — free, no account needed. It reads the open-access text and checks the sources it cites.
Claims other papers make about this one
Each is checked against this paper’s own text: does it say what the citing paper says it does?
In the citing paper
“TEs and ERVs are now known to regulate single genes as well as entire gene regulatory networks [6, 7].”
From The case for not masking away repetitive DNA (2018) · cites this paper as [6]
Self-check
Percentages, sums and reported differences re-computed from the paper’s own numbers.
The self-check needs the paper’s full text.
Citations
Cites
Fast and accurate short read alignment with Burrows-Wheeler transform
Li, H., & Durbin, R. (2009) · Bioinformatics · doi:10.1093/bioinformatics/btp324 · Cited by 58,607
BEDTools: a flexible suite of utilities for comparing genomic features
Quinlan, A. R., & Hall, I. M. (2010) · Bioinformatics · doi:10.1093/bioinformatics/btq033 · Cited by 27,437
Initial sequencing and comparative analysis of the mouse genome
Mouse Genome Sequencing Consortium (2002) · Nature · doi:10.1038/nature01262 · Cited by 7,187
DNA methylation patterns and epigenetic memory
Bird, A. (2002) · Genes & Development · doi:10.1101/gad.947102 · Cited by 7,124
GREAT improves functional interpretation of cis-regulatory regions
McLean, C. Y., Bristor, D., Hiller, M., Clarke, S. L., Schaar, B. T., Lowe, C. B., Wenger, A. M., & Bejerano, G. (2010) · Nature Biotechnology · doi:10.1038/nbt.1630 · Cited by 4,502
Evolutionarily conserved elements in vertebrate, insect, worm, and yeast genomes
Siepel, A., Bejerano, G., Pedersen, J. S., Hinrichs, A. S., Hou, M., Rosenbloom, K., Clawson, H., Spieth, J., Hillier, L. W., Richards, S., et al. (2005) · Genome Research · doi:10.1101/gr.3715005 · Cited by 3,971 · cited 2×
“We used phastCons scores (Siepel et al. 2005) to examine the sequence constraint on the TEs that had shared and species-specific TF binding events derived from it.”
MethodTransposable elements and the epigenetic regulation of the genome
Slotkin, R. K., & Martienssen, R. (2007) · Nature Reviews Genetics · doi:10.1038/nrg2072 · Cited by 2,044
A comparative encyclopedia of DNA elements in the mouse genome
Yue, F., Cheng, Y., Breschi, A., Vierstra, J., Wu, W., Ryba, T., Sandstrom, R., Ma, Z., Davis, C., Pope, B. D., et al. (2014) · Nature · doi:10.1038/nature13992 · Cited by 1,781
Self-citationEpigenetic inheritance at the agouti locus in the mouse
Morgan, H. D., Sutherland, H. G. E., Martin, D. I. K., & Whitelaw, E. (1999) · Nature Genetics · doi:10.1038/15490 · Cited by 1,476
Cohesin mediates transcriptional insulation by CCCTC-binding factor
Wendt, K. S., Yoshida, K., Itoh, T., Bando, M., Koch, B., Schirghuber, E., Tsutsumi, S., Nagae, G., Ishihara, K., Mishiro, T., et al. (2008) · Nature · doi:10.1038/nature06634 · Cited by 1,193
Research works printed but not linked: 54
- 10.1126/science.287.5461.2185 · DOI
- 10.1073/pnas.90.17.7915 · DOI · Paper page
- 10.1038/nature04696 · DOI
- 10.1016/j.gde.2009.10.013 · DOI
- 10.1101/gr.080663.108 · DOI
- 10.1126/science.165.3891.349 · DOI
- Cheng Y , Ma Z , Kim BH , Cayting P , Boyle AP , Wu W , Sundaram V , Xing X , Li J , Euskirchen G , . 2014. Principles of regulatory information conservation between mouse and human. Nature doi: 10.1038/nature13985. · DOI
- 10.1038/ng.2553 · DOI · Paper page
- 10.1371/journal.pgen.1002384 · DOI
- 10.1093/molbev/mst045 · DOI
- 10.1038/sj.embor.7400314 · DOI
- 10.1038/284601a0 · DOI
- 10.1073/pnas.2134464100 · DOI
- 10.4161/epi.19462 · DOI
- 10.1038/nature11247 · DOI · Paper page
- 10.1038/nrg2337 · DOI
- 10.1038/nrg3199 · DOI
- 10.1093/bioinformatics/btr064 · DOI · Paper page
- 10.1016/j.molcel.2010.05.004 · DOI · Paper page
- 10.1038/35057062 · DOI · Paper page
- 10.1371/journal.pgen.1003504 · DOI
- Johnson, 2007, Genome-wide mapping of in vivo protein-DNA interactions, Science, 80, 1497, 10.1126/science.1141319 · DOI · Paper page
- 10.1016/S0168-9525(02)00006-9 · DOI · Paper page
- 10.1159/000084979 · DOI
- 10.1126/science.1183621 · DOI
- 10.1101/gr.229102. Article published online before print in May 2002 · DOI · Paper page
- 10.1038/nbt.1508 · DOI
- 10.1038/ng.600 · DOI
- 10.1101/gr.136184.111 · DOI · Paper page
- 10.1038/ng.917 · DOI
- 10.1038/nature09165 · DOI · Paper page
- 10.1073/pnas.36.6.344 · DOI
- 10.1101/SQB.1956.021.01.017 · DOI
- 10.1074/jbc.M006557200 · DOI
- 10.1016/j.cell.2013.02.029 · DOI · Paper page
- 10.4049/jimmunol.172.5.2731 · DOI · Paper page
- 10.1371/journal.pone.0019470 · DOI
- 10.1186/1759-8753-2-8 · DOI
- 10.1016/j.cell.2009.06.001 · DOI
- 10.1073/pnas.1004139107 · DOI
- 10.1186/1471-2164-9-226 · DOI
- 10.1186/gb-2012-13-10-r89 · DOI
- 10.1146/annurev-genet-110711-155621 · DOI
- 10.1073/pnas.0708366105 · DOI
- Samuelson, 1990, Retroviral and pseudogene insertion sites reveal the lineage of human salivary and pancreatic amylase genes from a single gene during primate evolution, Mol Cell Biol, 10, 2513
- 10.1073/pnas.0709398105 · DOI
- 10.1016/j.cell.2011.11.058 · DOI
- 10.1038/msb.2011.75 · DOI
- 10.1101/gr.152231.112 · DOI
- 10.1038/nature07730 · DOI · Paper page
- 10.1073/pnas.0703637104 · DOI
- 10.1101/gr.100594.109 · DOI
- 10.1038/ng.2649 · DOI
- 10.1101/gr.156539.113 · DOI
Cited by
Sorted by citations
A comparative encyclopedia of DNA elements in the mouse genome
Yue, F., Cheng, Y., Breschi, A., Vierstra, J., Wu, W., Ryba, T., Sandstrom, R., Ma, Z., Davis, C., Pope, B. D., et al. (2014) · Nature · doi:10.1038/nature13992 · Cited by 1,781
Self-citationTen things you should know about transposable elements
Bourque, G., Burns, K. H., Gehring, M., Gorbunova, V., Seluanov, A., Hammell, M., Imbeault, M., Izsvák, Z., Levin, H. L., Macfarlan, T. S., et al. (2018) · Genome Biology · doi:10.1186/s13059-018-1577-z · Cited by 1,430
Regulatory evolution of innate immunity through co-option of endogenous retroviruses
Chuong, E. B., Elde, N. C., & Feschotte, C. (2016) · Science · doi:10.1126/science.aad5497 · Cited by 1,008
Roles of transposable elements in the regulation of mammalian transcription
Fueyo, R., Judd, J., Feschotte, C., & Wysocka, J. (2022) · Nature Reviews Molecular Cell Biology · doi:10.1038/s41580-022-00457-y · Cited by 451
The case for not masking away repetitive DNA
Slotkin, R. K. (2018) · Mobile DNA · doi:10.1186/s13100-018-0120-9 · Cited by 61
Metadata
- Authors
- Sundaram, V., Cheng, Y., Ma, Z., Li, D., Xing, X., Edge, P., Snyder, M. P., & Wang, T.
- Venue
- Genome Research
- Publisher
- Cold Spring Harbor Laboratory
- Published
- 2014-10-15
- Volume
- 24
- Issue
- 12
- Pages
- 1963-1976
- ISSN
- 1088-9051
- 1549-5469
- PMC
- PMC4248313
- Cited by
- 529
- References
- 12
- Language
- en
- Funders
- Mouse ENCODE Consortium (3RC2HG005602)
- March of Dimes Foundation (5-FY10-491)
- American Cancer Society (RSG-14-049-01-DMC)
- NIH (5U01ES017154, R01HG007354, R01HG007175, R01ES024992)
About these checks
Registry, retraction, Cites and statistics results are computed, not judged, with one exception: a printed reference that no index lists is read once by a model before it counts as a citation error. Claims are extracted by a model and kept only when their quote appears verbatim in the text; each cited source is then checked, with a model’s help, for whether it says what the claim relies on. Those verdicts can be wrong — read the claim’s quote and the cited source before relying on one.
Statistics and arithmetic are recomputed, not judged.
Confidence bands are shown only for fields calibrated on our annotated test set. None is calibrated yet, so no band is shown.
What counts as a claim ›How we measure confidence ›How we check this ›
Are you an author, or do you see a problem with this page? Request a review
How to cite
Cite CoChat for the checks on this page, and the paper for its own findings.
- This page
- CoChat. (2026). Citation check: Widespread contribution of transposable elements to the innovation of gene regulatory networks. https://app.cochat.ai/papers/10.1101/gr.168872.113
- The paper
- Sundaram, V., Cheng, Y., Ma, Z., Li, D., Xing, X., Edge, P., Snyder, M. P., & Wang, T. (2014). Widespread contribution of transposable elements to the innovation of gene regulatory networks. Genome Research. https://doi.org/10.1101/gr.168872.113
