

The DOI matches its Crossref record; 6 of the 6 references it cites were found in a registry or an index.
An efficient and scalable analysis framework for variant extraction and refinement from population-scale DNA sequence data
Abstract
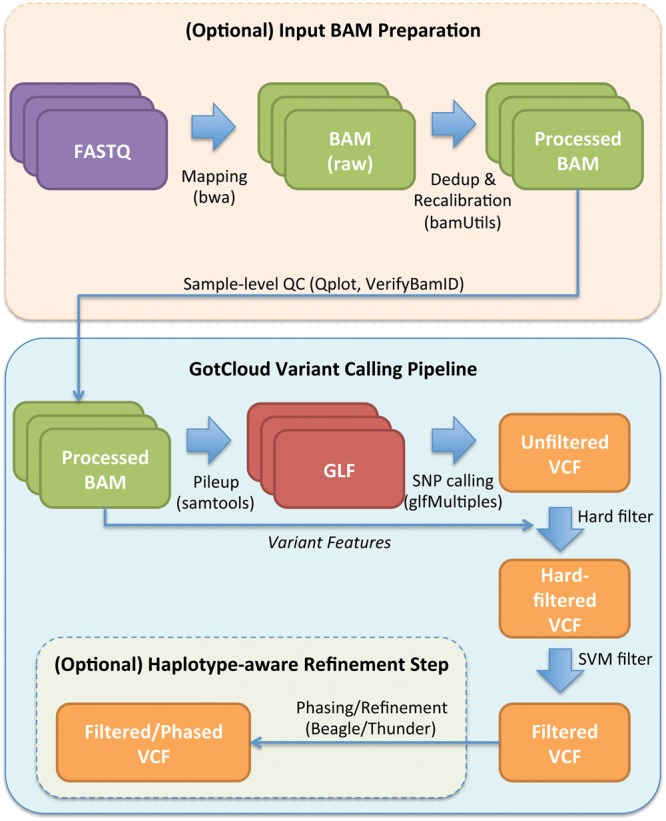
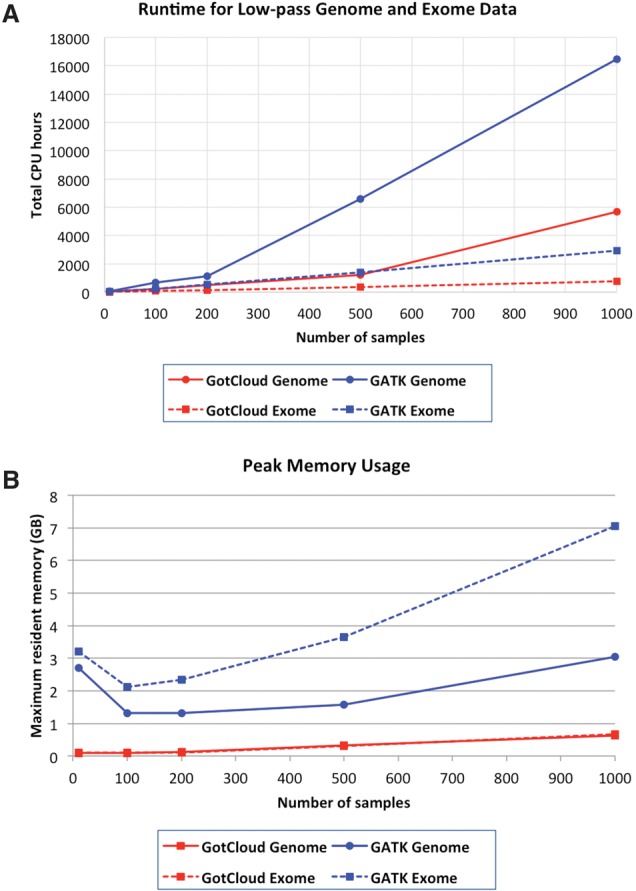
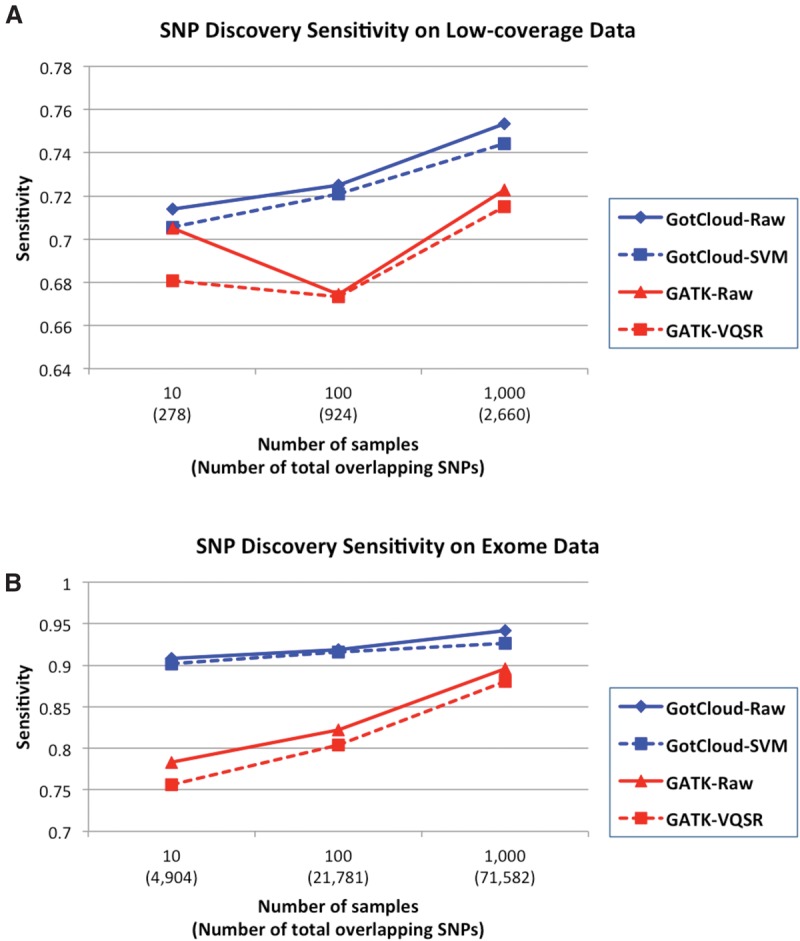
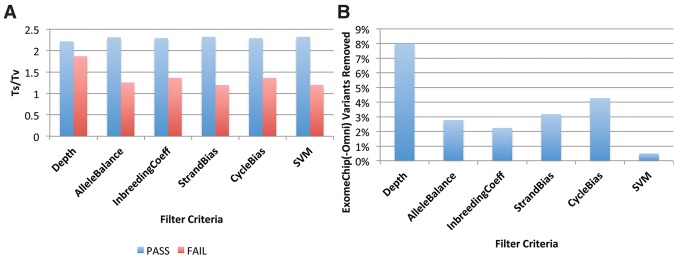
The analysis of next-generation sequencing data is computationally and statistically challenging because of the massive volume of data and imperfect data quality. We present GotCloud, a pipeline for efficiently detecting and genotyping high-quality variants from large-scale sequencing data. GotCloud automates sequence alignment, sample-level quality control, variant calling, filtering of likely artifacts using machine-learning techniques, and genotype refinement using haplotype information. The pipeline can process thousands of samples in parallel and requires less computational resources than current alternatives. Experiments with whole-genome and exome-targeted sequence data generated by the 1000 Genomes Project show that the pipeline provides effective filtering against false positive variants and high power to detect true variants. Our pipeline has already contributed to variant detection and genotyping in several large-scale sequencing projects, including the 1000 Genomes Project and the NHLBI Exome Sequencing Project. We hope it will now prove useful to many medical sequencing studies.
Overview
The claims and statistics of this paper haven’t been checked yet.
Run the check — free, no account needed. It reads the open-access text and checks the sources it cites.
Integrity signals
Registry
Cites
Statistics
Figures
Verification
Claims the paper makes
The claims and statistics of this paper haven’t been checked yet.
Run the check — free, no account needed. It reads the open-access text and checks the sources it cites.
Claims other papers make about this one
Each is checked against this paper’s own text: does it say what the citing paper says it does?
In the citing paper
“The first and last few bases of sequence reads that had high rates of postmortem damages specific to ancient genomes were removed with bamUtil (77).”
From Genomes of the Golden Horde elites and their implications for the rulers of the Mongol Empire (2026) · cites this paper as [77]
In the citing paper
“Based on the patterns of DNA misincorporation, we masked the first and last two bases of each read for UDG-half libraries and 10 bases for non-UDG single-stranded libraries, using the trimbam function in bamUtils v1.0.13 (Jun et al., 2015), to remove deamination-based 5′ C>T and 3′ G>A misincorporations.”
From A Dynamic 6,000-Year Genetic History of Eurasia’s Eastern Steppe (2020) · cites this paper as Jun et al., 2015
Self-check
Percentages, sums and reported differences re-computed from the paper’s own numbers.
The self-check needs the paper’s full text.
Citations
Cites
Cortes, C., & Vapnik, V. (1995) · Machine Learning · doi:10.1007/bf00994018 · Cited by 59,421
Fast and accurate short read alignment with Burrows-Wheeler transform
Li, H., & Durbin, R. (2009) · Bioinformatics · doi:10.1093/bioinformatics/btp324 · Cited by 58,607
LIBSVM: A library for support vector machines
Chang, C.-C., & Lin, C.-J. (2011) · ACM Transactions on Intelligent Systems and Technology · doi:10.1145/1961189.1961199 · Cited by 40,918
An integrated map of genetic variation from 1,092 human genomes
The 1000 Genomes Project Consortium (2012) · Nature · doi:10.1038/nature11632 · Cited by 7,711
A second generation human haplotype map of over 3.1 million SNPs
The International HapMap Consortium (2007) · Nature · doi:10.1038/nature06258 · Cited by 4,438
Evolution and functional impact of rare coding variation from deep sequencing of human exomes
Tennessen, J. A., Bigham, A. W., O’Connor, T. D., Fu, W., Kenny, E. E., Gravel, S., McGee, S., Do, R., Liu, X., Jun, G., et al. (2012) · Science · doi:10.1126/science.1219240 · Cited by 1,613
Self-citation
Research works printed but not linked: 11
- 10.1016/S0893-6080(99)00032-5 · DOI
- 10.1016/j.ajhg.2009.11.004 · DOI
- 10.1038/ng.806 · DOI
- 10.1038/nature07485 · DOI
- 10.1016/j.ajhg.2012.09.004 · DOI · Paper page
- 10.1093/bioinformatics/btr509 · DOI
- 10.1002/gepi.20533 · DOI · Paper page
- 10.1101/gr.117259.110 · DOI
- 2013, QPLOT: a quality assessment tool for next generation sequencing data, Biomed Res Int, 2013, 865181
- 10.1101/gr.146084.112 · DOI
- 10.1371/journal.pone.0082138 · DOI
Cited by
Sequencing of 53,831 diverse genomes from the NHLBI TOPMed Program
Taliun, D., Harris, D. N., Kessler, M. D., Carlson, J., Szpiech, Z. A., Torres, R., Taliun, S. A. G., Corvelo, A., Gogarten, S. M., Kang, H. M., et al. (2021) · Nature · doi:10.1038/s41586-021-03205-y · Cited by 2,213
Self-citationInherited causes of clonal haematopoiesis in 97,691 whole genomes
Bick, A. G., Weinstock, J. S., Nandakumar, S. K., Fulco, C. P., Bao, E. L., Zekavat, S. M., Szeto, M. D., Liao, X., Leventhal, M. J., Nasser, J., et al. (2020) · Nature · doi:10.1038/s41586-020-2819-2 · Cited by 733
Self-citationA Dynamic 6,000-Year Genetic History of Eurasia’s Eastern Steppe
Jeong, C., Wang, K., Wilkin, S., Taylor, W. T. T., Miller, B. K., Bemmann, J. H., Stahl, R., Chiovelli, C., Knolle, F., Ulziibayar, S., et al. (2020) · Cell · doi:10.1016/j.cell.2020.10.015 · Cited by 328
Non-coding variability at the APOE locus contributes to the Alzheimer’s risk
Zhou, X., Chen, Y., Mok, K. Y., Kwok, T. C. Y., Mok, V. C. T., Guo, Q., Ip, F. C., Chen, Y., Mullapudi, N., Initiative, A. D. N., et al. (2019) · Nature Communications · doi:10.1038/s41467-019-10945-z · Cited by 120
Using blood transcriptome analysis for Alzheimer's disease diagnosis and patient stratification
Zhong, H., Zhou, X., Uhm, H., Jiang, Y., Cao, H., Chen, Y., Mak, T. T. W., Lo, R. M. N., Wong, B. W. Y., Cheng, E. Y. L., et al. (2024) · Alzheimer's & Dementia · doi:10.1002/alz.13691 · Cited by 25
Metadata
- Authors
- Jun, G., Wing, M. K., Abecasis, G. R., & Kang, H. M.
- Venue
- Genome Research
- Publisher
- Cold Spring Harbor Laboratory
- Published
- 2015-04-16
- Volume
- 25
- Issue
- 6
- Pages
- 918-925
- ISSN
- 1088-9051
- 1549-5469
- PMC
- PMC4448687
- Cited by
- 536
- References
- 6
- Language
- en
- Funders
- National Institutes of Health
- National Human Genome Research Institute (U01 HG006513)
About these checks
Registry, retraction, Cites and statistics results are computed, not judged, with one exception: a printed reference that no index lists is read once by a model before it counts as a citation error. Claims are extracted by a model and kept only when their quote appears verbatim in the text; each cited source is then checked, with a model’s help, for whether it says what the claim relies on. Those verdicts can be wrong — read the claim’s quote and the cited source before relying on one.
Statistics and arithmetic are recomputed, not judged.
Confidence bands are shown only for fields calibrated on our annotated test set. None is calibrated yet, so no band is shown.
What counts as a claim ›How we measure confidence ›How we check this ›
Are you an author, or do you see a problem with this page? Request a review
How to cite
Cite CoChat for the checks on this page, and the paper for its own findings.
- This page
- CoChat. (2026). Citation check: An efficient and scalable analysis framework for variant extraction and refinement from population-scale DNA sequence data. https://app.cochat.ai/papers/10.1101/gr.176552.114
- The paper
- Jun, G., Wing, M. K., Abecasis, G. R., & Kang, H. M. (2015). An efficient and scalable analysis framework for variant extraction and refinement from population-scale DNA sequence data. Genome Research. https://doi.org/10.1101/gr.176552.114
