Cited by 128Evolution and Genetic DynamicsGenomics and Phylogenetic StudiesBioinformatics and Genomic Networks

The DOI matches its Crossref record; 66 of the 66 references it cites were found in a registry or an index.

A quantitative framework for characterizing the evolutionary history of mammalian gene expression

Open access

Published version of a preprint

Abstract

The evolutionary history of a gene helps predict its function and relationship to phenotypic traits. Although sequence conservation is commonly used to decipher gene function and assess medical relevance, methods for functional inference from comparative expression data are lacking. Here, we use RNA-seq across seven tissues from 17 mammalian species to show that expression evolution across mammals is accurately modeled by the Ornstein–Uhlenbeck process, a commonly proposed model of continuous trait evolution. We apply this model to identify expression pathways under neutral, stabilizing, and directional selection. We further demonstrate novel applications of this model to quantify the extent of stabilizing selection on a gene's expression, parameterize the distribution of each gene's optimal expression level, and detect deleterious expression levels in expression data from individual patients. Our work provides a statistical framework for interpreting expression data across species and in disease.

Overview

The claims and statistics of this paper haven’t been checked yet.

Run the check — free, no account needed. It reads the open-access text and checks the sources it cites.

A few free checks a day · papers already verified open instantly · results are public

Integrity signals

Registry

Crossref · 10.1101/gr.237636.118

Cites

66 of 66 references verified0 citation errors · 0 not checkable

Statistics

Figures

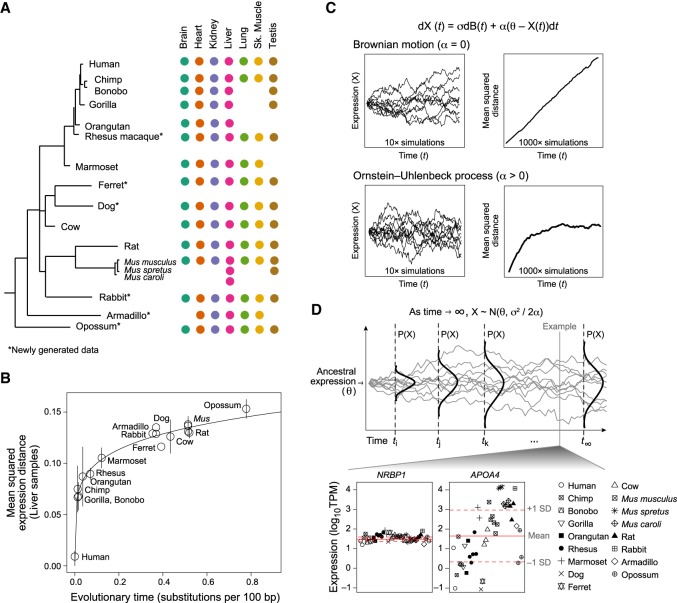
Figure 1. Expression evolution across mammalian lineages is accurately modeled by the OU process. (A) Data overview. Phylogenetic tree of all 17 mammals (left) marked by tissue types (colored dots) for which profiles are included. (*) Newly generated data. (B) Expression divergence is not linear. Shown is the pairwise mean squared expression distances (y-axis) between mammals and human for liver samples across evolutionary time, as estimated by substitutions per 100 bp (x-axis). (Error bars) standard deviation of the mean across replicates; (solid line) nonlinear (y = axk) regression fit. (C) OU model. Equation describing OU model (top): (σ) rate of genetic drift; [dB(t)] Brownian motion; (θ) optimal expression level; (α) strength of selection. (Left) Simulated trajectories of expression (y-axis) over evolutionary time (x-axis) under a Brownian motion (top) and OU (bottom) process. Ten example trajectories are shown. (Right) Mean squared distance to initial value (y-axis) across time (x-axis) from 1000 simulated trajectories. (D) Distribution of optimal expression. (Top) Illustration of the change in probability distribution of expression (y-axis) across time (x-axis) under an OU process. The distribution stabilizes as time approaches infinity. (Bottom) Scatter plot of log10TPM values (y-axis) across all liver samples (x-axis) of two example genes with low (NRBP1) and high (APOA4) variance. (Solid and dotted red lines) Estimated mean and variance, respectively, of the asymptotic (optimal) distribution of each gene's expression value estimated using the OU process. Note that mean and variance are calculated in log space.
Figure 1. Expression evolution across mammalian lineages is accurately modeled by the OU process. (A) Data overview. Phylogenetic tree of all 17 mammals (left) marked by tissue types (colored dots) for which profiles are included. (*) Newly generated data. (B) Expression divergence is not linear. Shown is the pairwise mean squared expression distances (y-axis) between mammals and human for liver samples across evolutionary time, as estimated by substitutions per 100 bp (x-axis). (Error bars) standard deviation of the mean across replicates; (solid line) nonlinear (y = axk) regression fit. (C) OU model. Equation describing OU model (top): (σ) rate of genetic drift; [dB(t)] Brownian motion; (θ) optimal expression level; (α) strength of selection. (Left) Simulated trajectories of expression (y-axis) over evolutionary time (x-axis) under a Brownian motion (top) and OU (bottom) process. Ten example trajectories are shown. (Right) Mean squared distance to initial value (y-axis) across time (x-axis) from 1000 simulated trajectories. (D) Distribution of optimal expression. (Top) Illustration of the change in probability distribution of expression (y-axis) across time (x-axis) under an OU process. The distribution stabilizes as time approaches infinity. (Bottom) Scatter plot of log10TPM values (y-axis) across all liver samples (x-axis) of two example genes with low (NRBP1) and high (APOA4) variance. (Solid and dotted red lines) Estimated mean and variance, respectively, of the asymptotic (optimal) distribution of each gene's expression value estimated using the OU process. Note that mean and variance are calculated in log space.CC BY-NC · PubMed Central
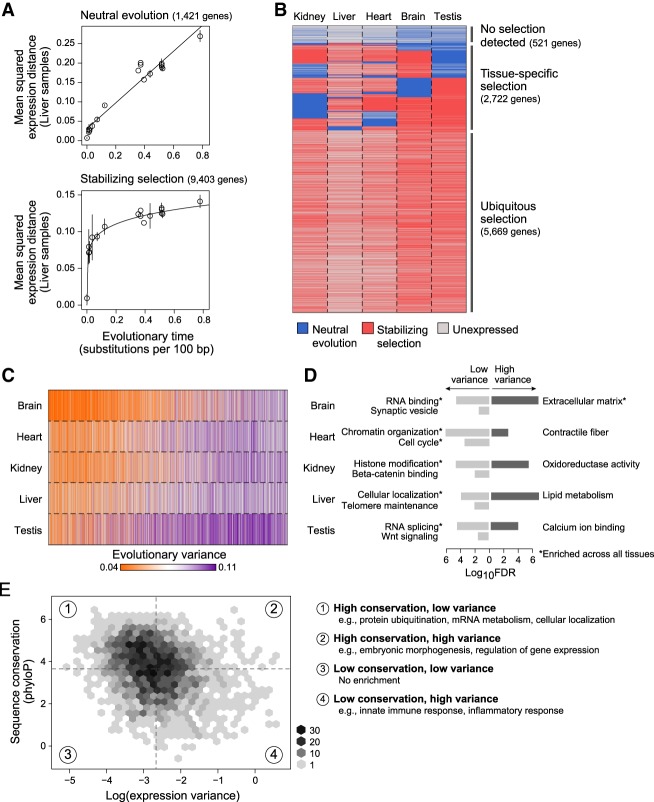
Figure 2. Quantification of neutral and constrained selection on gene expression using the OU model parameters. (A) Detection of stabilizing selection. Pairwise mean squared expression distances (y-axis) between mammals and human for liver samples across evolutionary time (x-axis) for genes whose expression evolution fits better under a Brownian motion (BM) process (top), indicating neutral evolution, and genes whose expression evolution fits better an Ornstein–Uhlenbeck (OU) process (bottom), indicating the presence of stabilizing selection: (solids lines) linear regression fit for BM genes and nonlinear regression fit for OU genes. (B) Neutral and stabilizing selection across genes and tissues. Heatmap indicating genes (rows) whose expression is predicted to be evolving under neutral evolution (blue) or stabilizing selection (red) across five different tissues (columns); (gray) genes that are expressed <5 TPM. (C,D) Evolutionary variance across tissues and processes. (C) Heatmap shows estimated evolutionary variance of expression (orange: low; purple: high) across genes (columns) in five tissues (rows); (gray) genes expressed <5 TPM. (D) Bar plot of −log10 FDR values for significantly enriched GO categories of low (light gray) and high (dark gray) variance genes within each tissue; (*) category enriched in every tissue. (E) Relationship between sequence and expression evolution. Binned scatter plot of log(evolutionary variance) of liver expression (x-axis) versus sequence conservation, as measured by the phyloP score (y-axis). Median variance and phyloP scores are indicated by vertical and horizontal dotted lines, respectively. Enriched GO categories (FDR <0.001) for genes in each quadrant of the scatter plot are listed on the right.
Figure 2. Quantification of neutral and constrained selection on gene expression using the OU model parameters. (A) Detection of stabilizing selection. Pairwise mean squared expression distances (y-axis) between mammals and human for liver samples across evolutionary time (x-axis) for genes whose expression evolution fits better under a Brownian motion (BM) process (top), indicating neutral evolution, and genes whose expression evolution fits better an Ornstein–Uhlenbeck (OU) process (bottom), indicating the presence of stabilizing selection: (solids lines) linear regression fit for BM genes and nonlinear regression fit for OU genes. (B) Neutral and stabilizing selection across genes and tissues. Heatmap indicating genes (rows) whose expression is predicted to be evolving under neutral evolution (blue) or stabilizing selection (red) across five different tissues (columns); (gray) genes that are expressed <5 TPM. (C,D) Evolutionary variance across tissues and processes. (C) Heatmap shows estimated evolutionary variance of expression (orange: low; purple: high) across genes (columns) in five tissues (rows); (gray) genes expressed <5 TPM. (D) Bar plot of −log10 FDR values for significantly enriched GO categories of low (light gray) and high (dark gray) variance genes within each tissue; (*) category enriched in every tissue. (E) Relationship between sequence and expression evolution. Binned scatter plot of log(evolutionary variance) of liver expression (x-axis) versus sequence conservation, as measured by the phyloP score (y-axis). Median variance and phyloP scores are indicated by vertical and horizontal dotted lines, respectively. Enriched GO categories (FDR <0.001) for genes in each quadrant of the scatter plot are listed on the right.CC BY-NC · PubMed Central
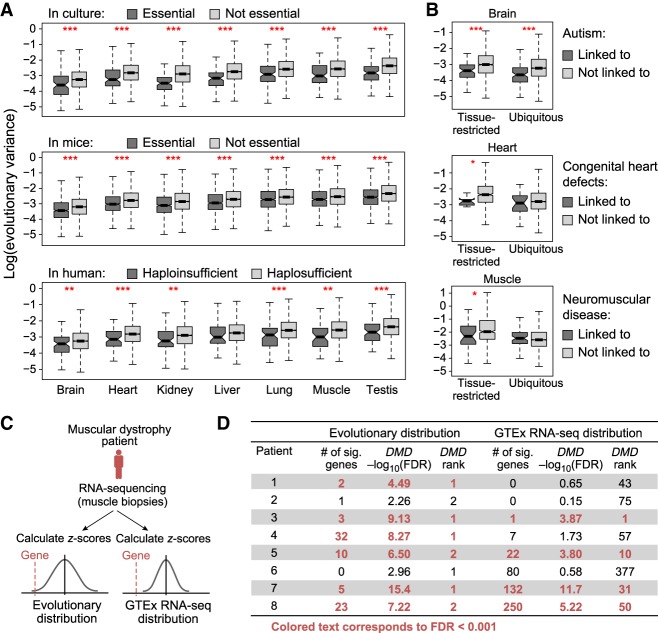
Figure 3. Evolutionary distribution of gene expression helps identify disease-contributing genes. (A) Essential genes have lower evolutionary variance. Box plots show the distribution of log(evolutionary variance) (y-axis) of genes essential in culture (top), essential in mice (middle), and haploinsufficient in human (bottom; dark gray), and their nonessential or haplosufficient counterparts (light gray) in each of seven tissues (x-axis): (***) P < 0.001; (**) P < 0.01. (B) Disease genes have lower evolutionary variance. Box plots show the distribution of log(evolutionary variance) (y-axis) of genes linked (dark gray) and not linked (light gray) to high-penetrance monogenic autism spectrum disorder (top), congenital heart defects (middle), and neuromuscular disease (bottom) in the relevant tissue (brain, heart, and muscle, respectively). (Left) Genes that are restricted in expression (>5 TPM in three or fewer tissues) in that tissue; (right) genes that are ubiquitously expressed; (***) P < 0.001; (*) <0.05. (C,D) Overview of using evolutionary distributions or GTEx RNA-seq distributions to identify outlier gene expression from RNA-seq of muscular dystrophy patients. (C) Two scoring approaches based on evolutionary distributions (left) or GTEx RNA-seq distributions (right). (D) Table shows number of significant outlier genes, −log10FDR score, and DMD’s significance rank for all patients with muscular dystrophy when using distributions estimated from evolutionary data (left) or GTEx RNA-seq data (right).
Figure 3. Evolutionary distribution of gene expression helps identify disease-contributing genes. (A) Essential genes have lower evolutionary variance. Box plots show the distribution of log(evolutionary variance) (y-axis) of genes essential in culture (top), essential in mice (middle), and haploinsufficient in human (bottom; dark gray), and their nonessential or haplosufficient counterparts (light gray) in each of seven tissues (x-axis): (***) P < 0.001; (**) P < 0.01. (B) Disease genes have lower evolutionary variance. Box plots show the distribution of log(evolutionary variance) (y-axis) of genes linked (dark gray) and not linked (light gray) to high-penetrance monogenic autism spectrum disorder (top), congenital heart defects (middle), and neuromuscular disease (bottom) in the relevant tissue (brain, heart, and muscle, respectively). (Left) Genes that are restricted in expression (>5 TPM in three or fewer tissues) in that tissue; (right) genes that are ubiquitously expressed; (***) P < 0.001; (*) <0.05. (C,D) Overview of using evolutionary distributions or GTEx RNA-seq distributions to identify outlier gene expression from RNA-seq of muscular dystrophy patients. (C) Two scoring approaches based on evolutionary distributions (left) or GTEx RNA-seq distributions (right). (D) Table shows number of significant outlier genes, −log10FDR score, and DMD’s significance rank for all patients with muscular dystrophy when using distributions estimated from evolutionary data (left) or GTEx RNA-seq data (right).CC BY-NC · PubMed Central
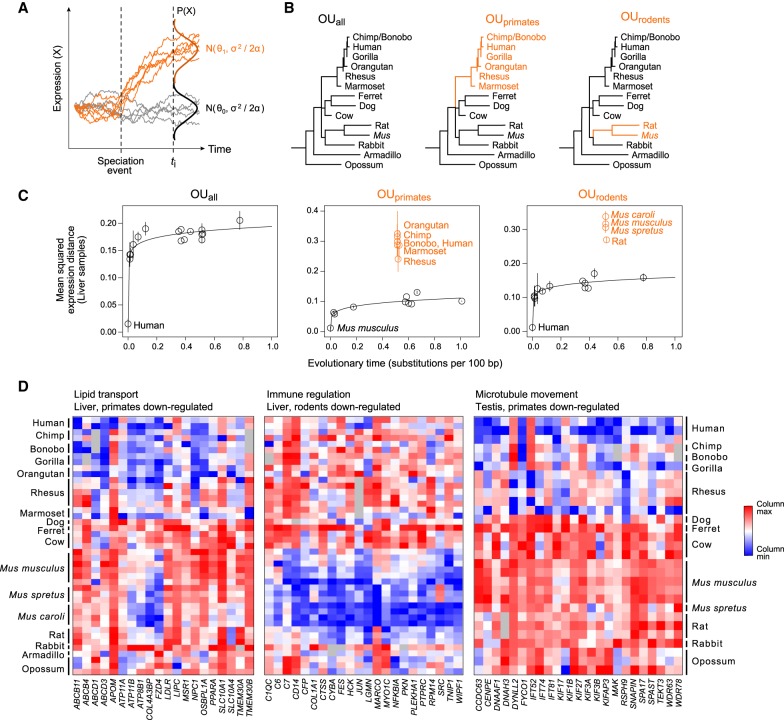
Figure 4. Multivariate OU process enables detection of lineage-specific expression changes. (A) Multivariate OU process. Simulated trajectories of expression (y-axis) over time (x-axis) under a multivariate OU process. Trajectories in gray are sampled from the same distribution (N0) across time, while trajectories in orange start at the same ancestral distribution (N0) but evolve under a new distribution (N1) after a speciation event. (B) Three tested hypotheses of expression evolution: from left: the univariate OUall model, in which gene expression evolves under a single stabilizing regime across the phylogeny (black), and two multivariate OU models, OUprimates and OUrodents, in which gene expression evolves under the ancestral regime (black) and a new regime in the specified subclade (orange). (C) Lineage-specific expression in liver. Pairwise mean squared expression distances in liver samples (y-axis) between a reference species (labeled black point) and each of the other mammals for genes assigned to each of three tested OU models. (Black points) species evolving under ancestral distribution; (labeled orange points) species evolving under new regime after the lineage split; (solid line) nonlinear regression fit for species evolving under ancestral distribution. (D) Example processes enriched for lineage-specific expression. Heatmaps show column-normalized expression (red: high; blue: low) from genes (columns) with lineage-specific expression patterns in three enriched GO categories (FDR < 0.05): lipid transport in liver (left), immune regulation in liver (middle), and microtubule movement in testis (right).
Figure 4. Multivariate OU process enables detection of lineage-specific expression changes. (A) Multivariate OU process. Simulated trajectories of expression (y-axis) over time (x-axis) under a multivariate OU process. Trajectories in gray are sampled from the same distribution (N0) across time, while trajectories in orange start at the same ancestral distribution (N0) but evolve under a new distribution (N1) after a speciation event. (B) Three tested hypotheses of expression evolution: from left: the univariate OUall model, in which gene expression evolves under a single stabilizing regime across the phylogeny (black), and two multivariate OU models, OUprimates and OUrodents, in which gene expression evolves under the ancestral regime (black) and a new regime in the specified subclade (orange). (C) Lineage-specific expression in liver. Pairwise mean squared expression distances in liver samples (y-axis) between a reference species (labeled black point) and each of the other mammals for genes assigned to each of three tested OU models. (Black points) species evolving under ancestral distribution; (labeled orange points) species evolving under new regime after the lineage split; (solid line) nonlinear regression fit for species evolving under ancestral distribution. (D) Example processes enriched for lineage-specific expression. Heatmaps show column-normalized expression (red: high; blue: low) from genes (columns) with lineage-specific expression patterns in three enriched GO categories (FDR < 0.05): lipid transport in liver (left), immune regulation in liver (middle), and microtubule movement in testis (right).CC BY-NC · PubMed Central

Verification

Claims the paper makes

The claims and statistics of this paper haven’t been checked yet.

Run the check — free, no account needed. It reads the open-access text and checks the sources it cites.

A few free checks a day · papers already verified open instantly · results are public

Claims other papers make about this one

Each is checked against this paper’s own text: does it say what the citing paper says it does?

Self-check

Percentages, sums and reported differences re-computed from the paper’s own numbers.

The self-check needs the paper’s full text.

Citations

Cites

Show all 66 references

Research works printed but not linked: 2

  1. 10.2307/2346101 · DOI
  2. 10.2307/2411186 · DOI

Cited by

Sorted by citations

See all 128

Metadata

Authors
Chen, J., Swofford, R., Johnson, J., Cummings, B. B., Rogel, N., Lindblad-Toh, K., Haerty, W., Palma, F. D., & Regev, A.
Affiliations
  • Broad Institute (US)
  • Earlham Institute (GB)
  • University of East Anglia (GB)
Venue
Genome Research
Published
2018-12-14
Volume
29
Issue
1
Pages
53-63
ISSN
  • 1088-9051 (ISSN-L)
  • 1549-5469
OpenAlex
W2949594216
Cited by
128
References
66
Citations by year
2026: 18 · 2025: 18 · 2024: 18 · 2023: 14 · 2022: 13 · 2021: 24 · 2020: 16 · 2019: 5 · 2018: 2
Type
posted content
Language
en
Open access
Locations
  • Genome Research (publishedVersion)
  • Europe PMC (PubMed Central) (publishedVersion, cc-by-nc)
  • PubMed Central (publishedVersion, cc-by-nc)
  • PubMed (publishedVersion)
  • UEA Digital Repository (University of East Anglia) (acceptedVersion)
  • Uppsala University Publications (Uppsala University) (submittedVersion, other-oa)
  • DSpace@MIT (Massachusetts Institute of Technology) (submittedVersion, cc-by-nc)
  • HighWire Press Open Archive (submittedVersion)
Funders
  • Howard Hughes Medical Institute
  • Broad Institute
  • Vetenskapsrådet
  • National Institutes of Health (5rm1hg006193-10)
  • Klarman Cell Observatory, Broad Institute
  • Biotechnology and Biological Sciences Research Council (BBS/E/T/000PR9817, BBS/E/T/000PR5885, BBS/E/T/000PR9818, BB/CSP1720/1)
  • National Human Genome Research Institute (RM1‐HG006193, T32HG002295)
  • National Institute of Neurological Disorders and Stroke
Topics
  • Life Sciences › Biochemistry, Genetics and Molecular Biology › Genetics › Evolution and Genetic Dynamics
  • Life Sciences › Biochemistry, Genetics and Molecular Biology › Molecular Biology › Genomics and Phylogenetic Studies
  • Life Sciences › Biochemistry, Genetics and Molecular Biology › Molecular Biology › Bioinformatics and Genomic Networks
Keywords
gene expression evolution, Ornstein-Uhlenbeck process, stabilizing selection, directional selection, neutral selection, comparative transcriptomics, mammals
MeSH terms
Animals, Dogs, Gene Expression Regulation, Models, Genetic, Rabbits, Evolution, Molecular

About these checks

Registry, retraction, Cites and statistics results are computed, not judged, with one exception: a printed reference that no index lists is read once by a model before it counts as a citation error. Claims are extracted by a model and kept only when their quote appears verbatim in the text; each cited source is then checked, with a model’s help, for whether it says what the claim relies on. Those verdicts can be wrong — read the claim’s quote and the cited source before relying on one.

Statistics and arithmetic are recomputed, not judged.

Confidence bands are shown only for fields calibrated on our annotated test set. None is calibrated yet, so no band is shown.

What counts as a claim ›How we measure confidence ›How we check this ›

Are you an author, or do you see a problem with this page? Request a review