

The DOI matches its Crossref record; 9 of the 9 references it cites were found in a registry or an index.
Spin-Orbit Coupling for Photons and Polaritons in Microstructures
Overview
The claims and statistics of this paper haven’t been checked yet.
Run the check — free, no account needed. It reads the open-access text and checks the sources it cites.
Integrity signals
Registry
Cites
Statistics
Figures
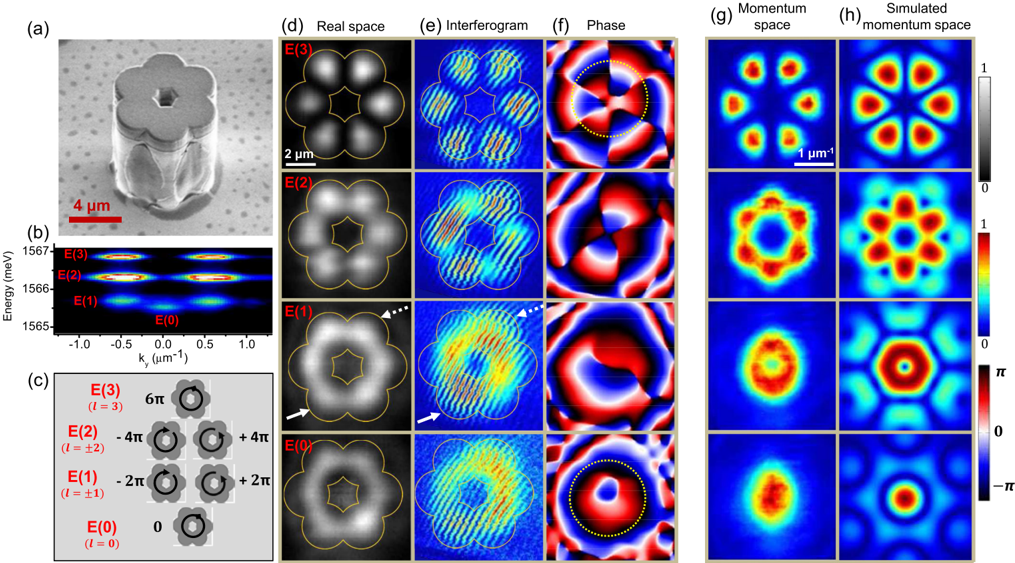
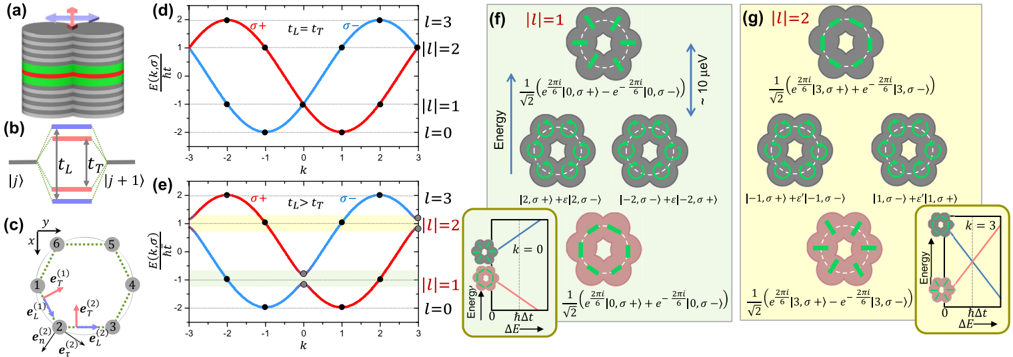
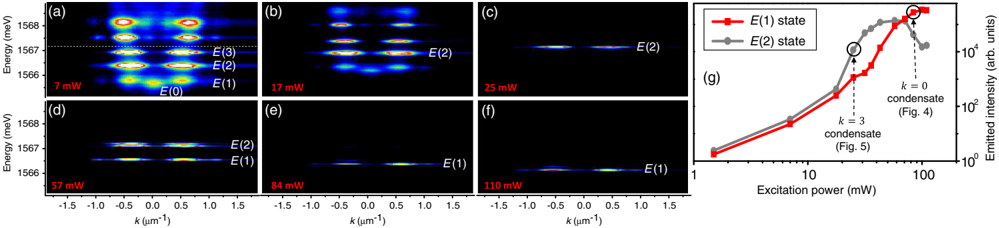
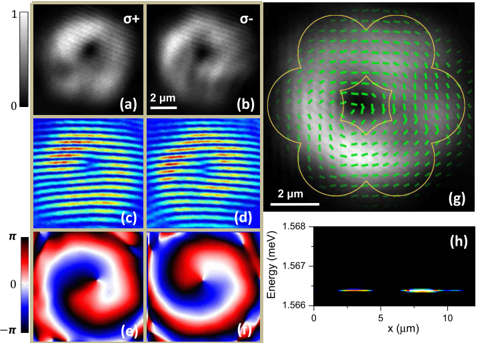
Verification
Claims the paper makes
The claims and statistics of this paper haven’t been checked yet.
Run the check — free, no account needed. It reads the open-access text and checks the sources it cites.
Claims other papers make about this one
Each is checked against this paper’s own text: does it say what the citing paper says it does?
The cited source says what the claim attributes to it.
In the citing paper
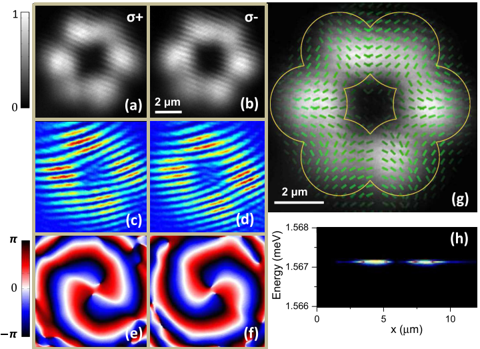
“In the topological photonics context, in spite of these complications, ramping the pump power above lasing threshold has been instrumental in resolving small spinorbit coupling effects in hexagonal chains of micropillar resonators (Sala et al., 2015;Carlon Zambon et al., 2018).”
From Topological photonics (2019) · cites this paper as Sala et al., 2015
In the citing paper
“In this experiment, the linewidth narrowing effect associated with laser operation was exploited to spectrally resolve the effect of the spin-orbit coupling terms in a hexagonal chain of pillar microcavities.”
From Topological photonics (2019) · cites this paper as Sala et al. (2015)
Self-check
Percentages, sums and reported differences re-computed from the paper’s own numbers.
The self-check needs the paper’s full text.
Citations
Cites
Quantum Spin Hall Insulator State in HgTe Quantum Wells
König, M., Wiedmann, S., Brüne, C., Roth, A., Buhmann, H., Molenkamp, L. W., Qi, X.-L., & Zhang, S.-C. (2007) · Science · doi:10.1126/science.1148047 · Cited by 6,151
Photonic Floquet topological insulators
Rechtsman, M. C., Zeuner, J. M., Plotnik, Y., Lumer, Y., Podolsky, D., Dreisow, F., Nolte, S., Segev, M., & Szameit, A. (2013) · Nature · doi:10.1038/nature12066 · Cited by 3,332
Observation of unidirectional backscattering-immune topological electromagnetic states
Wang, Z., Chong, Y., Joannopoulos, J. D., & Soljačić, M. (2009) · Nature · doi:10.1038/nature08293 · Cited by 3,123
Discretizing light behaviour in linear and nonlinear waveguide lattices
Christodoulides, D. N., Lederer, F., & Silberberg, Y. (2003) · Nature · doi:10.1038/nature01936 · Cited by 1,692
Spin–orbit coupling in quantum gases
Galitski, V., & Spielman, I. B. (2013) · Nature · doi:10.1038/nature11841 · Cited by 963 · cited 1×
“Novel systems, like ultracold atomic gases under suitably designed optical and/or magnetic field configurations [6], and photons in properly designed structures [7], allow for a great flexibility and control of the system Hamiltonian.”
BackgroundJaksch, D., & Zoller, P. (2003) · New Journal of Physics · doi:10.1088/1367-2630/5/1/356 · Cited by 777
Observation of topologically protected bound states in photonic quantum walks
Kitagawa, T., Broome, M. A., Fedrizzi, A., Rudner, M. S., Berg, E., Kassal, I., Aspuru-Guzik, A., Demler, E., & White, A. G. (2012) · Nature Communications · doi:10.1038/ncomms1872 · Cited by 607
Direct Observation of Dirac Cones and a Flatband in a Honeycomb Lattice for Polaritons
Jacqmin, T., Carusotto, I., Sagnes, I., Abbarchi, M., Solnyshkov, D. D., Malpuech, G., Galopin, E., Lemaître, A., Bloch, J., & Amo, A. (2014) · Physical Review Letters · doi:10.1103/physrevlett.112.116402 · Cited by 509
Self-citationArtificial gauge field for photons in coupled cavity arrays
Umucalılar, R. O., & Carusotto, I. (2011) · Physical Review A · doi:10.1103/physreva.84.043804 · Cited by 300
Self-citation
Research works printed but not linked: 37
- 10.1103/RevModPhys.76.323 · DOI
- 10.1126/science.1105514 · DOI
- 10.1103/PhysRevLett.94.047204 · DOI
- 10.1038/nature07871 · DOI
- 10.1103/PhysRevLett.95.226801 · DOI · Paper page
- 10.1103/PhysRevLett.95.136601 · DOI · Paper page
- 10.1038/nphys676 · DOI · Paper page
- 10.1126/science.1231758 · DOI · Paper page
- 10.1038/nphoton.2013.274 · DOI · Paper page
- 10.1038/nphys2063 · DOI · Paper page
- 10.1038/nmat3520 · DOI · Paper page
- 10.1038/nphys2012 · DOI
- 10.1103/PhysRevB.86.100301 · DOI
- 10.1103/RevModPhys.85.299 · DOI · Paper page
- 10.1038/nphys2406 · DOI
- 10.1038/ncomms2310 · DOI
- 10.1103/PhysRevLett.107.270401 · DOI
- 10.1103/PhysRevLett.114.026803 · DOI
- 10.1103/PhysRevA.76.031805 · DOI · Paper page
- 10.1103/PhysRevLett.108.206809 · DOI · Paper page
- 10.1016/j.physleta.2013.06.011 · DOI · Paper page
- 10.1103/PhysRevLett.108.126403 · DOI
- 10.1038/nphys2609 · DOI
- 10.1063/1.3632111 · DOI
- 10.1103/PhysRevLett.100.047401 · DOI
- 10.1063/1.3126022 · DOI
- 10.1103/PhysRevLett.107.106401 · DOI
- 10.1038/ncomms4278 · DOI
- 10.1063/1.118135 · DOI
- 10.1364/OL.36.001095 · DOI
- 10.1038/nature05131 · DOI
- 10.1103/PhysRevLett.94.187401 · DOI · Paper page
- 10.1103/PhysRevB.77.115340 · DOI · Paper page
- 10.1103/PhysRevB.81.081307 · DOI
- 10.1103/PhysRevB.59.5082 · DOI
- 10.1103/PhysRevLett.93.160405 · DOI
- 10.1364/OL.36.000085 · DOI
Cited by
Sorted by citations
Ozawa, T., Price, H. M., Amo, A., Goldman, N., Hafezi, M., Lu, L., Rechtsman, M. C., Schuster, D., Simon, J., Zilberberg, O., et al. (2019) · Reviews of Modern Physics · doi:10.1103/revmodphys.91.015006 · Cited by 3,722
Self-citationLu, L., Joannopoulos, J. D., & Soljačić, M. (2014) · Nature Photonics · doi:10.1038/nphoton.2014.248 · Cited by 3,655
Type-III and Tilted Dirac Cones Emerging from Flat Bands in Photonic Orbital Graphene
Milićević, M., Montambaux, G., Ozawa, T., Jamadi, O., Real, B., Sagnes, I., Lemaître, A., Le Gratiet, L., Harouri, A., Bloch, J., et al. (2019) · Physical Review X · doi:10.1103/physrevx.9.031010 · Cited by 171
“2(b), the pmodes show a small splitting arising from small anisotropy in the shape of the pillar and from polarization-momentum coupling characteristic of semiconductor microcavities [38,39].”
BackgroundSelf-citationNon-equilibrium Bose–Einstein condensation in photonic systems
Bloch, J., Carusotto, I., & Wouters, M. (2022) · Nature Reviews Physics · doi:10.1038/s42254-022-00464-0 · Cited by 105
Self-citationOptical analogue of Dresselhaus spin–orbit interaction in photonic graphene
Whittaker, C. E., Dowling, T., Nalitov, A. V., Yulin, A. V., Royall, B., Clarke, E., Skolnick, M. S., Shelykh, I. A., & Krizhanovskii, D. N. (2021) · Nature Photonics · doi:10.1038/s41566-020-00729-z · Cited by 83
Self-citation
Metadata
- Authors
- Sala, V. G., Solnyshkov, D. D., Carusotto, I., Jacqmin, T., Lemaître, A., Terças, H., Nalitov, A., Abbarchi, M., Galopin, E., Sagnes, I., Bloch, J., Malpuech, G., & Amo, A.
- Venue
- Physical Review X
- Publisher
- American Physical Society (APS)
- Published
- 2015-03-25
- Volume
- 5
- Issue
- 1
- ISSN
- 2160-3308
- Cited by
- 172
- References
- 9
- Language
- en
- Funders
- Agence Nationale de la Recherche (ANR-11-BS10-001, ANR-11-LABX-0014)
- Seventh Framework Programme (235114, 289968, 246912)
- European Research Council
- French RENATECH
- RTRA Triangle de la Physique
- POLATOM ESF Network
- Nanosaclay Labex
About these checks
Registry, retraction, Cites and statistics results are computed, not judged, with one exception: a printed reference that no index lists is read once by a model before it counts as a citation error. Claims are extracted by a model and kept only when their quote appears verbatim in the text; each cited source is then checked, with a model’s help, for whether it says what the claim relies on. Those verdicts can be wrong — read the claim’s quote and the cited source before relying on one.
Statistics and arithmetic are recomputed, not judged.
Confidence bands are shown only for fields calibrated on our annotated test set. None is calibrated yet, so no band is shown.
What counts as a claim ›How we measure confidence ›How we check this ›
Are you an author, or do you see a problem with this page? Request a review
