

The DOI matches its Crossref record; 41 of the 43 references it cites were found in a registry or an index; 2 of the 23 sources its claims cite were checked for support.
A Vertically Stacked Nanosheet Gate-All-Around FET for Biosensing Application
Open accessAbstract
A vertically stacked nanosheet gate-all-around FET biosensor with improved sensitivity over nanowire variants.
Overview
CoChat Summary
## TL;DR
This paper proposes a vertically stacked nanosheet gate-all-around FET (GAA-NSFET) as a label-free biosensor and evaluates it by 3-D TCAD simulation. The authors report that it is more sensitive than conventional nanowire and vertically stacked nanowire biosensors for both neutral and charged biomolecules.
## Key findings
- The proposed GAA-NSFET-based biosensor shows apparent electrical variation with different biomolecules, including changes in transfer characteristics, output characteristics, energy band, channel potential, threshold voltage, subthreshold swing (SS), and current switching ratio \(I_{on}/I_{off}\).
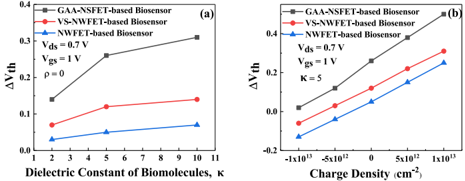
- In comparative sensitivity analysis, the GAA-NSFET-based biosensor performs best versus both the conventional nanowire FET (NWFET) biosensor and the vertically stacked nanowire FET (VS-NWFET) biosensor, attributed to its larger channel width and multiple channels.
- For neutral biomolecules, threshold-voltage sensitivity increases with dielectric constant and reaches its maximum at \(\kappa = 10\); for charged biomolecules, sensitivity increases with negative charge density and decreases with positive charge density.
- The paper reports that SS sensitivity rises as dielectric constant increases from \(\kappa = 1\) to 10, but SS sensitivity does not change obviously with charge density; \(I_{on}/I_{off}\) is presented as a better sensitivity metric for this biosensor, especially for charged biomolecules. The paper also states that the highest \(I_{on}/I_{off}\) sensitivity occurs at \(\kappa = 10\) and \(\rho = -1 \times 10^{13}\,\text{cm}^{-2}\).
## Methods
- The study uses 3-D Sentaurus TCAD simulation, with physics models including doping-dependent mobility, Shockley-Read-Hall, band-to-band tunneling, and Oldslotboom models.
- The simulated device is a vertically stacked GAA nanosheet FET with a nanocavity between the metal gate and nanosheet channel; biomolecules are modeled by filling the cavity with different dielectric constants (\(\kappa\)) and charge densities (\(\rho\)), where \(\kappa = 1\) means no biomolecules.
- Analysis compares the proposed GAA-NSFET biosensor against reference conventional NWFET and VS-NWFET biosensors, and evaluates sensitivity using threshold voltage, SS, \(I_{on}/I_{off}\), and \(g_m/I_{ds}\), plus cavity length/thickness and partially filled cavity cases.
## Limitations
- The paper states that SS sensitivity is not an appropriate sensitivity parameter for charged biomolecules for this biosensor because the SS of the GAA structure is close to its limit value of 60 mV/decade, making the variation range very narrow.
- The text makes evident that the results are simulation-based rather than experimentally measured for the biosensor itself (said here because only TCAD simulation is reported and no biosensor fabrication/experimental validation is described for the proposed sensor).
- The paper notes that fully filled nanogaps are rarely encountered in practice and therefore studies partially filled cases, indicating a realistic occupancy limitation of the sensing cavity.
Model-written summary. Check it against the paper before relying on it.
Integrity signals
Registry
Cites
Statistics
Figures




Verification
Claims the paper makes
2 Valid · 1 Not valid · 18 Not checked · 62 Own results and interpretations
The cited sources support only part of this claim — read each source’s verdict below.
In the paper
“trap assisted tunneling (TAT) will result in significant degradation of TFET-based biosensor's performance.References [19].”
§ A Vertically Stacked Nanosheet Gate-All-Around FET for Biosensing Application > I. INTRODUCTION
What the sources say
- Partly supportedcites [19] 19. R. N. Sajjad, W. Chern, J. L. Hoyt, and D. A. Antoniadis, ''Trap assisted tunneling and its effect on subthreshold swing of tunnel FETs,'' IEEE Trans. Electron Devices, vol. 63, no. 11, pp. 4380-4387, Nov. 2016. sourceExperimental — accuracy not yet measured
The paper reports that traps in the source-channel tunneling region produce leakage that degrades TFET ON–OFF current ratio and subthreshold swing (p. 1; §A, p. 3). It does not study TFET-based biosensors or establish a significant effect on biosensor performance specifically. (LLM, conf=0.86)
plainstates a cause- Asserted: passes — The authors put it forward as true.
- Checkable: passes — It can be checked against evidence.
- Load-bearing: unclear — It is unclear whether the paper’s conclusions depend on it.
- Based: passes — The paper gives a reason why it holds.
- Partly supported
A result the paper reports from its own data — it cites no other source for it, so there is none to check. The quote shows it is in the paper.
In the paper
“GAA-NSFET-based biosensor is more sensitive compared with those works in terms of I on /I off sensitivity.”
§ A Vertically Stacked Nanosheet Gate-All-Around FET for Biosensing Application > Abstract
plainstates an association- Asserted: passes — The authors put it forward as true.
- Checkable: passes — It can be checked against evidence.
- Load-bearing: passes — The paper’s conclusions depend on it.
- Based: passes — The paper gives a reason why it holds.
A result the paper reports from its own data — it cites no other source for it, so there is none to check. The quote shows it is in the paper.
In the paper
“The results show that GAA-NSFET-based biosensor obtains the best sensitivity compared with other biosensors (including nanowire FET-based biosensor and vertically stacked nanowire FET-based biosensor) due to its larger channel width and multi-channels.”
§ A Vertically Stacked Nanosheet Gate-All-Around FET for Biosensing Application > Abstract
plainstates a cause- Asserted: passes — The authors put it forward as true.
- Checkable: passes — It can be checked against evidence.
- Load-bearing: passes — The paper’s conclusions depend on it.
- Based: passes — The paper gives a reason why it holds.
A result the paper reports from its own data — it cites no other source for it, so there is none to check. The quote shows it is in the paper.
In the paper
“Its sensitivity depends on the filling amounts of biomolecules instead of the filling position.”
§ A Vertically Stacked Nanosheet Gate-All-Around FET for Biosensing Application > Abstract
plainstates a cause- Asserted: passes — The authors put it forward as true.
- Checkable: passes — It can be checked against evidence.
- Load-bearing: passes — The paper’s conclusions depend on it.
- Based: passes — The paper gives a reason why it holds.
A result the paper reports from its own data — it cites no other source for it, so there is none to check. The quote shows it is in the paper.
In the paper
“the proposed biosensor exhibits good sensitivity for both neutral and charged biomolecules.”
§ A Vertically Stacked Nanosheet Gate-All-Around FET for Biosensing Application > Abstract
plain- Asserted: passes — The authors put it forward as true.
- Checkable: passes — It can be checked against evidence.
- Load-bearing: passes — The paper’s conclusions depend on it.
- Based: passes — The paper gives a reason why it holds.
33 more claims
Create a free account to see all 83 claims and to verify the 1 reference still open.
- It may state two separate claims as one. 35
- The quote only partly states this claim. 3
- Probably not a substantial claim. 10
Citations
Cites
Development of an Ion-Sensitive Solid-State Device for Neurophysiological Measurements
Bergveld, P. (1970) · IEEE Transactions on Biomedical Engineering · doi:10.1109/tbme.1970.4502688 · Cited by 2,134
Biosensors: sense and sensibility
Turner, A. P. F. (2013) · Chemical Society Reviews · doi:10.1039/c3cs35528d · Cited by 1,654
Stacked nanosheet gate-all-around transistor to enable scaling beyond FinFET
Loubet, N., Hook, T., Montanini, P., Yeung, C.-W., Kanakasabapathy, S., Guillom, M., Yamashita, T., Zhang, J., Miao, X., Wang, J., et al. (2017) · 2017 Symposium on VLSI Technology · doi:10.23919/vlsit.2017.7998183 · Cited by 1,122 · cited 5×
“Different from conventional nanosheet FET [29], there is a nanocavity between metal gate and nanosheet channel to immobilize target biomolecules.”
BackgroundMethodResultInfluentialImportance of the Debye Screening Length on Nanowire Field Effect Transistor Sensors
Stern, E., Wagner, R., Sigworth, F. J., Breaker, R., Fahmy, T. M., & Reed, M. A. (2007) · Nano Letters · doi:10.1021/nl071792z · Cited by 806 · cited 1×
“Thus, with the same footprint, GAA-NWFET has a larger gate area than FinFET, which means a stronger gate control capability [24], [25].”
BackgroundTunnel Field-Effect Transistors: State-of-the-Art
Lu, H., & Seabaugh, A. (2014) · IEEE Journal of the Electron Devices Society · doi:10.1109/jeds.2014.2326622 · Cited by 635
A dielectric-modulated field-effect transistor for biosensing
Im, H., Huang, X.-J., Gu, B., & Choi, Y.-K. (2007) · Nature Nanotechnology · doi:10.1038/nnano.2007.180 · Cited by 635
Tunnel Field-Effect Transistors: Prospects and Challenges
Avci, U. E., Morris, D. H., & Young, I. A. (2015) · IEEE Journal of the Electron Devices Society · doi:10.1109/jeds.2015.2390591 · Cited by 527
Narang, R., Reddy, K. V. S., Saxena, M., Gupta, R. S., & Gupta, M. (2012) · IEEE Transactions on Electron Devices · doi:10.1109/ted.2012.2208115 · Cited by 308 · cited 2×
“The electrical characteristics of the FET are also modulated in terms of threshold voltage, subthreshold swing, on-state current, and off-state current [11].”
BackgroundComparative analysis of dielectric- modulated FET and TFET-based biosensor
Narang, R., Saxena, M., & Gupta, M. (2015) · IEEE Transactions on Nanotechnology · doi:10.1109/tnano.2015.2396899 · Cited by 296
Device Exploration of NanoSheet Transistors for Sub-7-nm Technology Node
Jang, D., Yakimets, D., Eneman, G., Schuddinck, P., Bardon, M. G., Raghavan, P., Spessot, A., Verkest, D., & Mocuta, A. (2017) · IEEE Transactions on Electron Devices · doi:10.1109/ted.2017.2695455 · Cited by 292
Research works printed but not linked: 1
- 2013, Sentaurus Device User Guide
Cited by
Das, A., Rewari, S., Kanaujia, B. K., Deswal, S. S., & Gupta, R. S. (2023) · Journal of Computational Electronics · doi:10.1007/s10825-023-02008-w · Cited by 67
“investigated a vertically stacked nanosheet surrounding-gate FET-based biosensor [14].”
BackgroundSimulation Study of Dual Metal-Gate Inverted T-Shaped TFET for Label-Free Biosensing
Wang, Y., Li, C., Li, O., Cheng, S., Liu, W., & You, H. (2022) · IEEE Sensors Journal · doi:10.1109/jsen.2022.3195180 · Cited by 62
“The inverted T structure proposed above uses 66 a horizontal cavity [16].”
MethodSelf-citationDas, A., Rewari, S., Kanaujia, B. K., Deswal, S. S., & Gupta, R. S. (2023) · Physica Scripta · doi:10.1088/1402-4896/acf4c9 · Cited by 62
Das, A., Rewari, S., Kanaujia, B. K., Deswal, S. S., & Gupta, R. (2023) · International Journal of Numerical Modelling Electronic Networks Devices and Fields · doi:10.1002/jnm.3106 · Cited by 54
Dual metal dual layer GAA NW–FET (DMDL–GAA–NW–FET) biosensor for label free SARS-CoV-2 detection
Yadav, S., & Rewari, S. (2023) · Microsystem Technologies · doi:10.1007/s00542-023-05560-4 · Cited by 35
“The fabrication of the biosensor begins with some fundamental fabrication steps (Li et al. 2021) such as substrate preparation, silicon epitaxial growth, sacrificial layer deposition, Gate Dielectric Deposition using techniques such as thermal oxidation or chemical vapor deposition (CVD), Gate…”
Metadata
- Authors
- Li, C., Liu, F., Han, R., & Zhuang, Y.
- Affiliations
- Xidian University (CN)
- Northwestern Polytechnical University (CN)
- Venue
- IEEE Access
- Published
- 2021
- Volume
- 9
- Pages
- 63602-63610
- ISSN
- 2169-3536 (ISSN-L)
- OpenAlex
- W3158347758
- Semantic Scholar
- a45cd83a4bf159639f6baea469e5967e33bc8a6e
- Cited by
- 60
- References
- 43
- Citations by year
- 2026: 13 · 2025: 13 · 2024: 15 · 2023: 13 · 2022: 6
- FWCI
- 2.50
- Type
- journal article
- Language
- en
- Open access
- gold
- doi.org
- Locations
- IEEE Access (publishedVersion, cc-by)
- DOAJ (DOAJ: Directory of Open Access Journals) (submittedVersion, cc-by-sa)
- Funders
- 111 Project of China and National Natural Science Foundation of China (61574109, 61204092)
- Topics
- Physical Sciences › Engineering › Electrical and Electronic Engineering › Advancements in Semiconductor Devices and Circuit Design
- Physical Sciences › Chemistry › Analytical Chemistry › Analytical Chemistry and Sensors
- Physical Sciences › Chemistry › Analytical Chemistry › Electrochemical sensors and biosensors
- Keywords
- gate-all-around transistors, label-free biosensor, biomolecule detection, subthreshold swing, threshold voltage, on/off current ratio, nanowire transistors, channel structure, sensitivity analysis
About these checks
Registry, retraction, Cites and statistics results are computed, not judged, with one exception: a printed reference that no index lists is read once by a model before it counts as a citation error. Claims are extracted by a model and kept only when their quote appears verbatim in the text; each cited source is then checked, with a model’s help, for whether it says what the claim relies on. Those verdicts can be wrong — read the claim’s quote and the cited source before relying on one.
The claim verdicts this report counts are experimental: their accuracy is not yet measured.
A language model drew the claims from the paper on 2026-10-10, under version 3 of the claim definition (model deepseek-v4.1-flash, prompt extract-v3).
A second model labelled each claim on 2026-10-10 (model jev-1.13-20260917, definition revision gold-guideline-v0.2).
Cited sources are checked with a language model’s help (gpt-6-sol).
Statistics and arithmetic are recomputed, not judged.
Confidence bands are shown only for fields calibrated on our annotated test set. None is calibrated yet, so no band is shown.
What counts as a claim ›How we measure confidence ›How we check this ›
Are you an author, or do you see a problem with this page? Request a review
How to cite
Cite CoChat for the checks on this page, and the paper for its own findings.
- This page
- CoChat. (2026). Citation check: A Vertically Stacked Nanosheet Gate-All-Around FET for Biosensing Application. https://app.cochat.ai/papers/10.1109/access.2021.3074906
- The paper
- Li, C., Liu, F., Han, R., & Zhuang, Y. (2021). A Vertically Stacked Nanosheet Gate-All-Around FET for Biosensing Application. IEEE Access. https://doi.org/10.1109/access.2021.3074906
Data sources
Bibliographic data: Semantic Scholar, OpenAlex, Crossref.
Contains information from the Semantic Scholar Academic Graph Datasets, made available under the ODC Attribution License (ODC-BY 1.0).
Semantic Scholar’s data is described in: Kinney, R., et al. (2023). The Semantic Scholar Open Data Platform. arXiv:2301.10140.
