

Low dimensional subject representation based transfer learning in eeg decoding
Open accessThe DOI matches its Crossref record; 54 of the 54 references it cites were found in a registry or an index.
Abstract
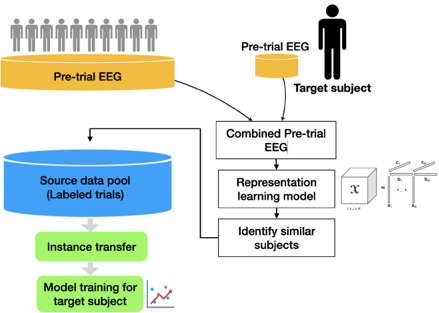
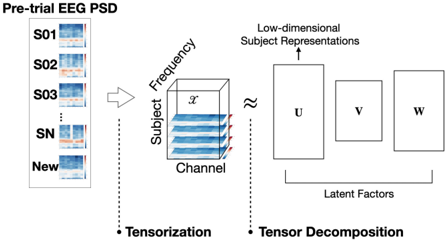
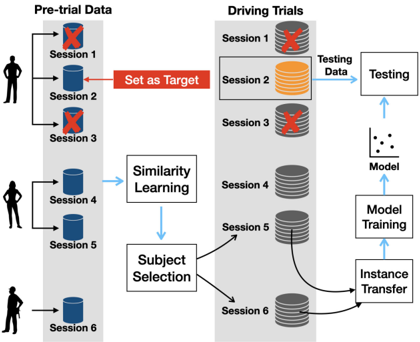
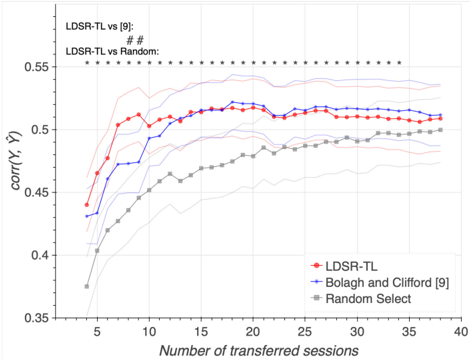
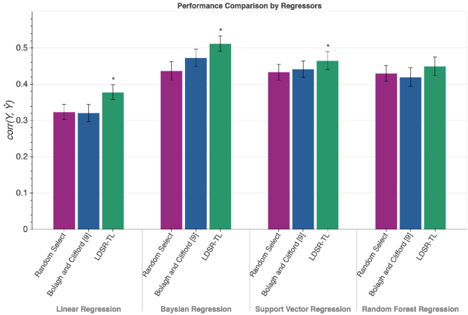
Recently, the advances in passive brain-computer interfaces (BCIs) based on electroencephalogram (EEG) have shed light on real-world neuromonitoring technologies. However, human variability in the EEG activities hinders the development of practical applications of EEG-based BCI. To tackle this problem, many transfer-learning techniques perform supervised calibration. This kind of calibration approach requires task-relevant data, which is impractical in real-life scenarios such as drowsiness during driving. This study presents a transfer-learning framework for EEG decoding based on the low-dimensional representations of subjects learned from the pre-trial EEG. Tensor decomposition was applied to the pre-trial EEG of subjects to extract the underlying characteristics in subject, spatial, and spectral domains. Then, the proposed framework assessed the characteristics to obtain the low-dimensional subject representations such that the subjects with similar brain dynamics can be identified. This method can leverage the existing data from other users, and a small number of data from a rapid, non-task, unsupervised calibration from a new user to build an accurate BCI. Our results demonstrated that, in terms of prediction accuracy, the proposed low-dimensional subject representation-based transfer learning (LDSR-TL) framework outperformed the random selection, and the Riemannian manifold approach in cognitive-state tracking, while requiring fewer training data. The results can greatly improve the practicability, and usability of EEG-based BCI in the real world.
Overview
The claims and statistics of this paper haven’t been checked yet.
Free: it reads the open-access text and checks the first 5 claims that cite a source we can check. Create a free account to check every claim.
Integrity signals
Registry
Cites
Statistics
Figures
Verification
Claims the paper makes
The claims and statistics of this paper haven’t been checked yet.
Free: it reads the open-access text and checks the first 5 claims that cite a source we can check. Create a free account to check every claim.
Claims other papers make about this one
Each is checked against this paper’s own text: does it say what the citing paper says it does?
The cited source says what the claim attributes to it.
In the citing paper
“One of the biggest challenges to making BCIs practical in daily life is high inter-subject variability in brain signals across individuals.”
From Transfer learning for EEG-based BCIs: a comparative evaluation and optimization of data alignment methods (2026) · cites this paper as Jeng et al., 2020
The cited source says what the claim attributes to it.
In the citing paper
“This variability makes it difficult to develop models that can perform well for any individual without requiring time-consuming and lengthy calibration sessions for each individual (Jeng et al., 2020).”
From Transfer learning for EEG-based BCIs: a comparative evaluation and optimization of data alignment methods (2026) · cites this paper as Jeng et al., 2020
Self-check
Percentages, sums and reported differences re-computed from the paper’s own numbers.
The self-check needs the paper’s full text.
Citations
Cites
(2008) · Journal of Machine Learning Research · Cited by 33,051
Pan, S. J., & Yang, Q. (2010) · IEEE Transactions on Knowledge and Data Engineering · doi:10.1109/tkde.2009.191 · Cited by 23,387
Matrix Factorization Techniques for Recommender Systems
Koren, Y., Bell, R., & Volinsky, C. (2009) · Computer · doi:10.1109/mc.2009.263 · Cited by 11,673 · cited 1×
“In fact, latent factors from matrix/tensor decomposition are heavily used in recommendation systems to discover users with similar behaviors [39], [40].”
BackgroundTensor Decompositions and Applications
Kolda, T. G., & Bader, B. W. (2009) · SIAM Review · doi:10.1137/07070111x · Cited by 10,301 · cited 1×
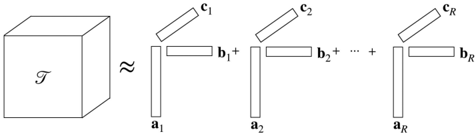
“Thisstudyproposesalow-dimensionalsubject-representation (LDSR) approach based on tensor decomposition [16], [17].”
MethodWeiss, K., Khoshgoftaar, T. M., & Wang, D. (2016) · Journal of Big Data · doi:10.1186/s40537-016-0043-6 · Cited by 6,260
MEG and EEG data analysis with MNE-Python
Gramfort, A. (2013) · Frontiers in Neuroscience · doi:10.3389/fnins.2013.00267 · Cited by 3,784 · cited 1×
“To obtain PSD, we adopted an open-source neurophysiologicaldataanalysislibrary-MNE[46],[47].”
MethodA review of classification algorithms for EEG-based brain–computer interfaces: A 10 year update
Lotte, F., Bougrain, L., Cichocki, A., Clerc, M., Congedo, M., Rakotomamonjy, A., & Yger, F. (2018) · Journal of Neural Engineering · doi:10.1088/1741-2552/aab2f2 · Cited by 2,239 · cited 1×
“A neuromonitoring BCI usually involves a data-driven EEG decoding model that characterizes EEG patterns associated with brain states of interest [6].”
On the Surprising Behavior of Distance Metrics in High Dimensional Space
Aggarwal, C. C., Hinneburg, A., & Keim, D. A. (2001) · Lecture Notes in Computer Science · doi:10.1007/3-540-44503-x_27 · Cited by 2,083 · cited 1×
“First,thevectors ( # channel × # frequency ) falls onto a very high dimensional space, where the concepts of distance and proximity become meaningless [13].”
BackgroundMNE software for processing MEG and EEG data
Gramfort, A., Luessi, M., Larson, E., Engemann, D. A., Strohmeier, D., Brodbeck, C., Parkkonen, L., & Hämäläinen, M. S. (2014) · NeuroImage · doi:10.1016/j.neuroimage.2013.10.027 · Cited by 1,951 · cited 1×
“To obtain PSD, we adopted an open-source neurophysiologicaldataanalysislibrary-MNE[46],[47].”
MethodTensor Decomposition for Signal Processing and Machine Learning
Sidiropoulos, N. D., De Lathauwer, L., Fu, X., Huang, K., Papalexakis, E. E., & Faloutsos, C. (2017) · IEEE Transactions on Signal Processing · doi:10.1109/tsp.2017.2690524 · Cited by 1,617 · cited 1×
“Secondly, constraints may be imposed on the latent factors for model complexity control such as the sparsity of latent factors [36].”
Background
Cited by
Can Emotion Be Transferred?—A Review on Transfer Learning for EEG-Based Emotion Recognition
Li, W., Huan, W., Hou, B., Tian, Y., Zhang, Z., & Song, A. (2021) · IEEE Transactions on Cognitive and Developmental Systems · doi:10.1109/tcds.2021.3098842 · Cited by 138
“This transfer mode usually constructs a feature space or subspace to minimize the discrepancy of data distributions between different domains [58]–[69].”
BackgroundCho, J.-H., Jeong, J.-H., & Lee, S.-W. (2021) · IEEE Transactions on Cybernetics · doi:10.1109/tcyb.2021.3122969 · Cited by 139
“The EEG data were bandpass filtered in the range [4– 40 ] Hz [ For kinematic data, we recorded surface EMG signals to detect muscle activation.”
BackgroundMethodRethinking Membership Inference Attacks Against Transfer Learning
Wu, C., Chen, J., Fang, Q., He, K., Zhao, Z., Ren, H., Xu, G., Liu, Y., & Xiang, Y. (2024) · IEEE Transactions on Information Forensics and Security · doi:10.1109/tifs.2024.3413592 · Cited by 90
“Additionally, our attack method targets typical parameter-based transfer learning, excluding other types such as instance-based, feature representation-based, and relational knowledge-based transfer learning [68], [69], [70], [71].”
MethodJiménez-Guarneros, M., & Fuentes-Pineda, G. (2023) · Biomedical Signal Processing and Control · doi:10.1016/j.bspc.2023.105138 · Cited by 78
Lightweight Source-Free Transfer for Privacy-Preserving Motor Imagery Classification
Zhang, W., & Wu, D. (2022) · IEEE Transactions on Cognitive and Developmental Systems · doi:10.1109/tcds.2022.3193731 · Cited by 40
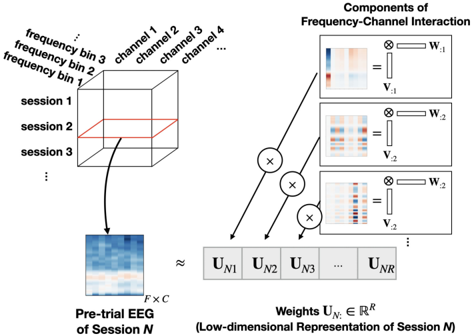
“Jeng et al. [20] proposed a low-dimensional representation-based transfer learning approach, which decomposes the EEG signal into a subject latent factor, a channel latent factor, and a frequency factor.”
Background
Metadata
- Authors
- Jeng, P.-Y., Wei, C.-S., Jung, T.-P., & Wang, L.-C.
- Affiliations
- National Yang Ming Chiao Tung University (TW)
- University of California San Diego (US)
- Venue
- IEEE Journal of Biomedical and Health Informatics
- Published
- 2021-06
- Volume
- 25
- Issue
- 6
- Pages
- 1915-1925
- ISSN
- 2168-2194 (ISSN-L)
- 2168-2208
- OpenAlex
- W3088964528
- Cited by
- 35
- References
- 53
- Citations by year
- 2026: 2 · 2025: 6 · 2024: 8 · 2023: 8 · 2022: 5 · 2021: 6
- FWCI
- 2.56
- Type
- journal article
- Language
- en
- Open access
- hybrid
- doi.org
- Licence
- Locations
- IEEE Journal of Biomedical and Health Informatics (publishedVersion, cc-by-nc-nd)
- PubMed (publishedVersion)
- Funders
- Ministry of Education (108DR012)
- National Chiao Tung University
- Ministry of Science and Technology, Taiwan (107-2917-I-009-008, 108-2634-F-009-006, 109-2222-E-009-006-MY3)
- Army Research Laboratory (W911NF-10-2-0022, W911NF2020088)
- US National Science Foundation (CBET-1935860)
- Topics
- Life Sciences › Neuroscience › Cognitive Neuroscience › EEG and Brain-Computer Interfaces
- Physical Sciences › Computer Science › Artificial Intelligence › Emotion and Mood Recognition
- Physical Sciences › Computer Science › Human-Computer Interaction › Gaze Tracking and Assistive Technology
- Keywords
- EEG decoding, transfer learning, passive brain-computer interface, unsupervised calibration, tensor decomposition, drowsiness detection, interindividual variability, neuromonitoring
- MeSH terms
- Machine Learning, Algorithms, Brain, Electroencephalography, Humans, Brain-Computer Interfaces
About these checks
Registry, retraction, Cites and statistics results are computed, not judged, with one exception: a printed reference that no index lists is read once by a model before it counts as a citation error. Claims are extracted by a model and kept only when their quote appears verbatim in the text; each cited source is then checked, with a model’s help, for whether it says what the claim relies on. Those verdicts can be wrong — read the claim’s quote and the cited source before relying on one.
Statistics and arithmetic are recomputed, not judged.
Confidence bands are shown only for fields calibrated on our annotated test set. None is calibrated yet, so no band is shown.
What counts as a claim ›How we measure confidence ›How we check this ›
Are you an author, or do you see a problem with this page? Request a review
How to cite
Cite CoChat for the checks on this page, and the paper for its own findings.
- This page
- CoChat. (2026). Citation check: Low dimensional subject representation based transfer learning in eeg decoding. https://app.cochat.ai/papers/10.1109/jbhi.2020.3025865
- The paper
- Jeng, P.-Y., Wei, C.-S., Jung, T.-P., & Wang, L.-C. (2021). Low dimensional subject representation based transfer learning in eeg decoding. IEEE Journal of Biomedical and Health Informatics. https://doi.org/10.1109/jbhi.2020.3025865
Data sources
Bibliographic data: Semantic Scholar, OpenAlex, Crossref.
Contains information from the Semantic Scholar Academic Graph Datasets, made available under the ODC Attribution License (ODC-BY 1.0).
Semantic Scholar’s data is described in: Kinney, R., et al. (2023). The Semantic Scholar Open Data Platform. arXiv:2301.10140.
