Cited by 27

The DOI matches its Crossref record; 4 of the 4 references it cites were found in a registry or an index.

α‐Synuclein toxicity in yeast and human cells is caused by cell cycle re‐entry and autophagy degradation of ribonucleotide reductase 1

Sampaio‐Marques, Belém, Guedes, Ana, Vasilevskiy, Igor, Gonçalves, Susana, Outeiro, Tiago F., Winderickx, Joris, Burhans, William C., Ludovico, Paula·2019·Aging Cell

Abstract

α‐Synuclein (aSyn) toxicity is associated with cell cycle alterations, activation of DNA damage responses (DDR), and deregulation of autophagy. However, the relationships between these phenomena remain largely unknown. Here, we demonstrate that in a yeast model of aSyn toxicity and aging, aSyn expression induces Ras2‐dependent growth signaling, cell cycle re‐entry, DDR activation, autophagy, and autophagic degradation of ribonucleotide reductase 1 (Rnr1), a protein required for the activity of ribonucleotide reductase and dNTP synthesis. These events lead to cell death and aging, which are abrogated by deleting RAS2, inhibiting DDR or autophagy, or overexpressing RNR1. aSyn expression in human H4 neuroglioma cells also induces cell cycle re‐entry and S‐phase arrest, autophagy, and degradation of RRM1, the human homologue of RNR1, and inhibiting autophagic degradation of RRM1 rescues cells from cell death. Our findings represent a model for aSyn toxicity that has important implications for understanding synucleinopathies and other age‐related neurodegenerative diseases.

Overview

The claims and statistics of this paper haven’t been checked yet.

Run the check — free, no account needed. It reads the open-access text and checks the sources it cites.

A few free checks a day · papers already verified open instantly · results are public

Integrity signals

Registry

Crossref · 10.1111/acel.12922

Cites

4 of 4 references verified0 citation errors · 0 not checkable

Statistics

Figures

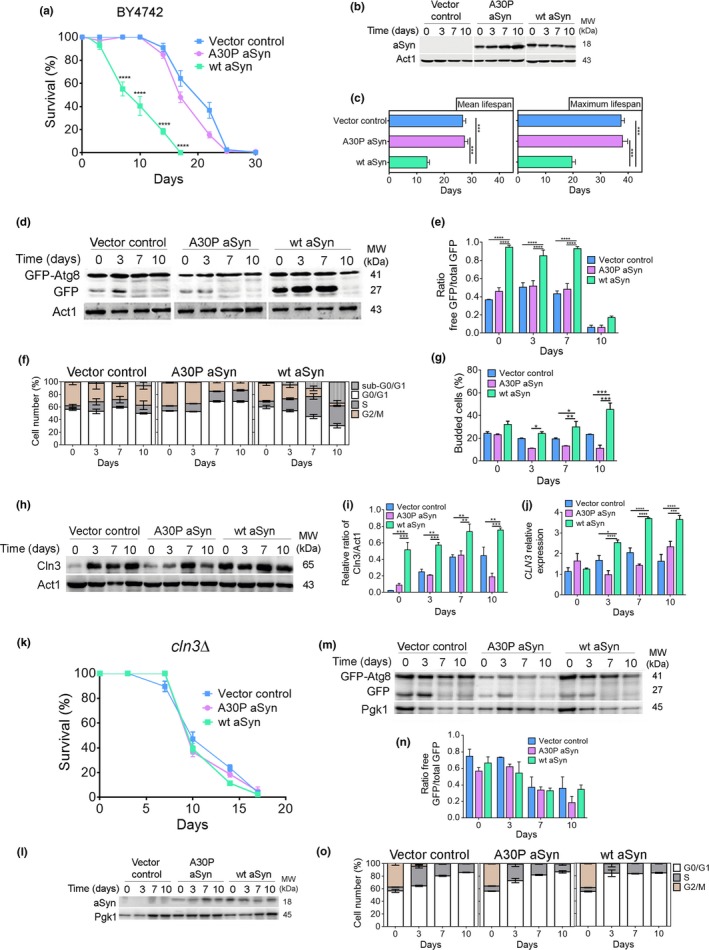
Figure 1 aSyn promotes cell cycle re‐entry and S‐phase arrest associated with increased autophagy. (a) Chronological lifespan (CLS), (b) aSyn levels, and (c) mean lifespan and maximum lifespan of BY4742 cells expressing the vector control, wt aSyn, or the A30P aSyn variant. (d) Representative blot and (e) graphical representation of the GFP‐Atg8 processing assay. (f) Cell cycle analysis. (g) Bud index. (h) Representative blot of Cln3. (i) Graphical representation of the Cln3/Act1. (j) Relative CLN3 mRNA levels of BY4742 cells expressing the vector control or aSyn variants. (k) CLS, (l) aSyn levels, (m) representative blot, and (n) graphical representation of the GFP‐Atg8 processing assay for cln3Δ cells expressing the vector control or aSyn variants. (o) Cell cycle analysis. Significance of the data was determined by two‐way ANOVA (*p ≤ 0.05, **p ≤ 0.01; ***p ≤ 0.001, ****p ≤ 0.0001) comparing wild‐type or cln3Δ cells expressing vector control or the aSyn variants
Figure 1 aSyn promotes cell cycle re‐entry and S‐phase arrest associated with increased autophagy. (a) Chronological lifespan (CLS), (b) aSyn levels, and (c) mean lifespan and maximum lifespan of BY4742 cells expressing the vector control, wt aSyn, or the A30P aSyn variant. (d) Representative blot and (e) graphical representation of the GFP‐Atg8 processing assay. (f) Cell cycle analysis. (g) Bud index. (h) Representative blot of Cln3. (i) Graphical representation of the Cln3/Act1. (j) Relative CLN3 mRNA levels of BY4742 cells expressing the vector control or aSyn variants. (k) CLS, (l) aSyn levels, (m) representative blot, and (n) graphical representation of the GFP‐Atg8 processing assay for cln3Δ cells expressing the vector control or aSyn variants. (o) Cell cycle analysis. Significance of the data was determined by two‐way ANOVA (*p ≤ 0.05, **p ≤ 0.01; ***p ≤ 0.001, ****p ≤ 0.0001) comparing wild‐type or cln3Δ cells expressing vector control or the aSyn variantsCC BY · PubMed Central
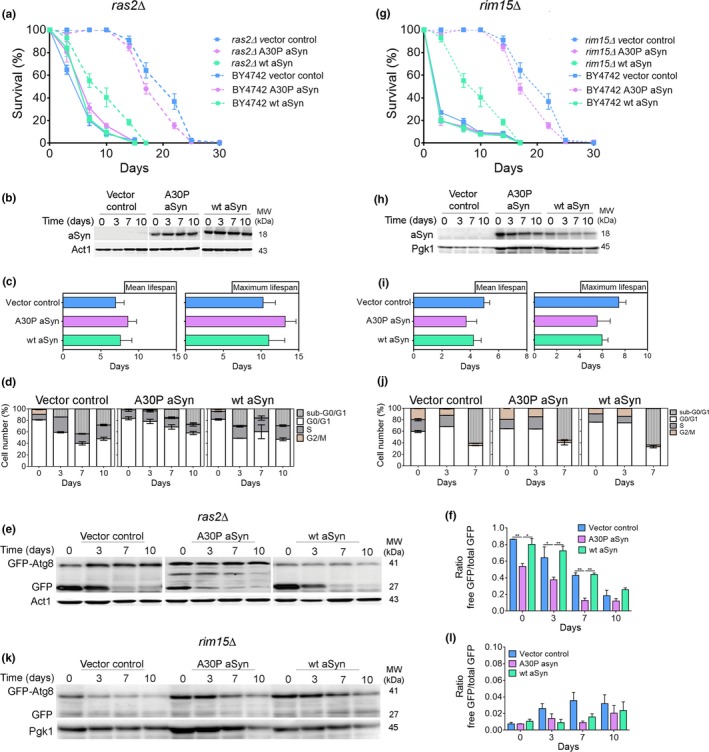
Figure 2 Cell cycle arrest at G0/G1 phase abrogates aSyn toxicity. (a,g) CLS, (b,h) aSyn levels, (c,i) mean lifespan and maximum lifespan, (d,j) cell cycle analysis, (e,k) representative blot, and (f,l) graphical representation of the GFP‐Atg8 processing assay of ras2Δ and rim15Δ cells expressing the vector control or aSyn variants, respectively (CLS of BY4742, dashed lines, are repeated from Figure 1a to facilitate interpretation). Significance of the data was determined by two‐way ANOVA (*p ≤ 0.05, **p ≤ 0.01) comparing ras2Δ or rim15Δ cells expressing vector control or the aSyn variants
Figure 2 Cell cycle arrest at G0/G1 phase abrogates aSyn toxicity. (a,g) CLS, (b,h) aSyn levels, (c,i) mean lifespan and maximum lifespan, (d,j) cell cycle analysis, (e,k) representative blot, and (f,l) graphical representation of the GFP‐Atg8 processing assay of ras2Δ and rim15Δ cells expressing the vector control or aSyn variants, respectively (CLS of BY4742, dashed lines, are repeated from Figure 1a to facilitate interpretation). Significance of the data was determined by two‐way ANOVA (*p ≤ 0.05, **p ≤ 0.01) comparing ras2Δ or rim15Δ cells expressing vector control or the aSyn variantsCC BY · PubMed Central
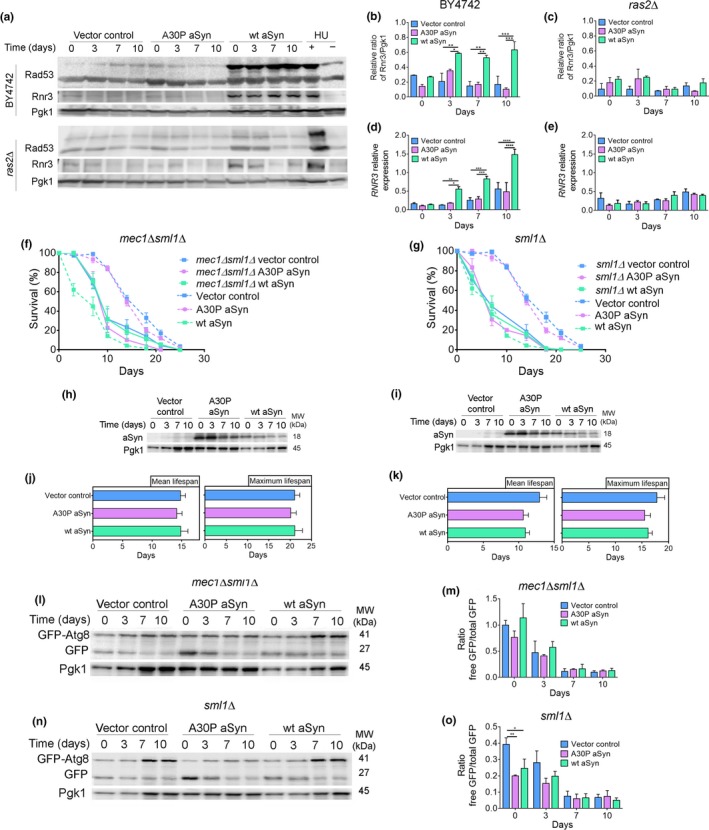
Figure 3 aSyn promotes DNA damage responses. (a) Representative blots for Rad53 phosphorylation and Rnr3 levels. (b,c) Graphical representation of the Rnr3/Pgk1 and (d,e) relative RNR3mRNA levels of BY4742 or ras2Δ cells expressing the vector control or aSyn variants, respectively. As a positive or negative control of DDR activation, cells treated or not with hydroxyurea (HU) were used. Significance of the data was determined by two‐way ANOVA (*p ≤ 0.05, **p ≤ 0.01, ***p ≤ 0.001, ****p ≤ 0.0001) comparing BY4742 or ras2Δ cells expressing vector control or the aSyn variants. (f,g) CLS and (h,i) aSyn levels of mec1Δsml1Δ and sml1Δ cells, respectively, expressing the vector control or aSyn variants (CLS data from W303‐1A wild‐type cells, dashed lines, are repeated from Supporting information Figure S3 to facilitate interpretation). (j,k) Mean lifespan and maximum lifespan of mec1Δsml1Δ and sml1Δ cells. (l,n) Representative blots and (m,o) graphical representation of the GFP‐Atg8 processing assay. Significance of the data was determined by two‐way ANOVA (*p ≤ 0.05, **p ≤ 0.01) comparing mec1Δsml1Δ or sml1Δcells expressing vector control or aSyn variants
Figure 3 aSyn promotes DNA damage responses. (a) Representative blots for Rad53 phosphorylation and Rnr3 levels. (b,c) Graphical representation of the Rnr3/Pgk1 and (d,e) relative RNR3mRNA levels of BY4742 or ras2Δ cells expressing the vector control or aSyn variants, respectively. As a positive or negative control of DDR activation, cells treated or not with hydroxyurea (HU) were used. Significance of the data was determined by two‐way ANOVA (*p ≤ 0.05, **p ≤ 0.01, ***p ≤ 0.001, ****p ≤ 0.0001) comparing BY4742 or ras2Δ cells expressing vector control or the aSyn variants. (f,g) CLS and (h,i) aSyn levels of mec1Δsml1Δ and sml1Δ cells, respectively, expressing the vector control or aSyn variants (CLS data from W303‐1A wild‐type cells, dashed lines, are repeated from Supporting information Figure S3 to facilitate interpretation). (j,k) Mean lifespan and maximum lifespan of mec1Δsml1Δ and sml1Δ cells. (l,n) Representative blots and (m,o) graphical representation of the GFP‐Atg8 processing assay. Significance of the data was determined by two‐way ANOVA (*p ≤ 0.05, **p ≤ 0.01) comparing mec1Δsml1Δ or sml1Δcells expressing vector control or aSyn variantsCC BY · PubMed Central
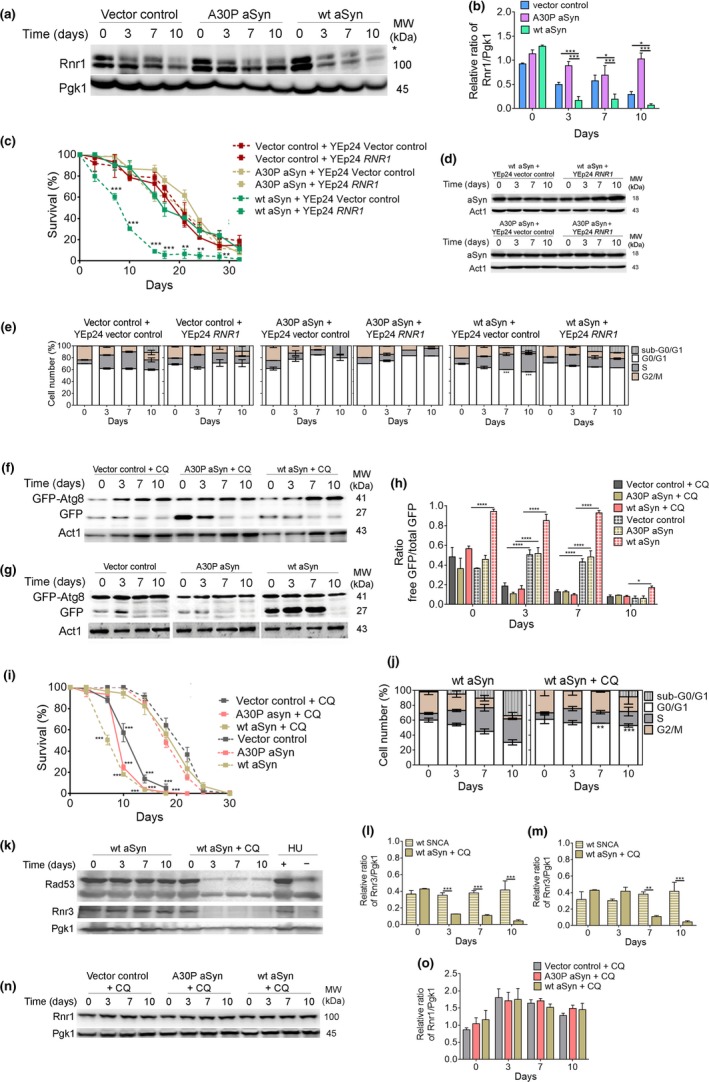
Figure 4 Decreased levels of Rnr1 in aSyn‐expressing cells are restored by autophagy inhibition. (a) Representative blot for Rnr1 of BY4742 cells expressing the vector control or aSyn variants and (b) graphical representation of the Rnr1/Pgk1. *indicates a nonspecific band in the anti‐Rnr1 immunoblot. Significance of the data was determined by two‐way ANOVA (*p ≤ 0.05, ***p ≤ 0.001) comparing wild‐type cells expressing the vector control or the aSyn variants. (c) CLS, (d) aSyn levels, and (e) cell cycle analysis of BY4742 cells co‐expressing the vector control or aSyn variants and RNR1 or vector control. Significance of the data was determined by two‐way ANOVA (**p ≤ 0.01; ***p ≤ 0.001) comparing cells co‐expressing RNR1 and the vector control or aSyn variants. (f,g) Representative blots of the GFP‐Atg8 processing assay of BY4742 cells expressing the vector control or aSyn variants in the presence or absence of chloroquine (CQ) (50 µg/µl added at day 0 of CLS). (h) Graphical representation of the GFP‐Atg8 processing assay. (i) CLS of BY4742 cells expressing the vector control or aSyn variants in the presence (solid lines) or absence (dashed lines) of CQ. (j) Cell cycle analysis of BY4742 cells expressing wt aSyn treated or not with CQ. (Data on Figure 4g,I,j for BY4742 cells expressing the vector control or aSyn variants without CQ are repeated from Figure 1 to facilitate interpretation). Significance of the data from h–j was determined by two‐way ANOVA (*p ≤ 0.05, **p ≤ 0.01; ***p ≤ 0.001, ****p ≤ 0.0001) comparing BY4742 cells expressing the vector control or aSyn variants in the presence or absence of CQ. (k) Representative blots for Rad53 phosphorylation and Rnr3. (l) Graphical representation of the Rnr3/Pgk1 and (m) relative RNR3mRNA levels of BY4742 cells expressing wt aSyn in the absence or presence of CQ. As a positive or negative control for DDR activation, extracts from cells treated with hydroxyurea (HU) were used. Significance of the data was determined by Student's t test (**p ≤ 0.01; ***p ≤ 0.001) comparing BY4742 cells expressing the vector control or aSyn variants in the presence or absence of CQ. (n) Representative blot for Rnr1 and (o) graphical representation of the Rnr1/Pgk1 of BY4742 cells expressing the vector control or aSyn variants treated with CQ
Figure 4 Decreased levels of Rnr1 in aSyn‐expressing cells are restored by autophagy inhibition. (a) Representative blot for Rnr1 of BY4742 cells expressing the vector control or aSyn variants and (b) graphical representation of the Rnr1/Pgk1. *indicates a nonspecific band in the anti‐Rnr1 immunoblot. Significance of the data was determined by two‐way ANOVA (*p ≤ 0.05, ***p ≤ 0.001) comparing wild‐type cells expressing the vector control or the aSyn variants. (c) CLS, (d) aSyn levels, and (e) cell cycle analysis of BY4742 cells co‐expressing the vector control or aSyn variants and RNR1 or vector control. Significance of the data was determined by two‐way ANOVA (**p ≤ 0.01; ***p ≤ 0.001) comparing cells co‐expressing RNR1 and the vector control or aSyn variants. (f,g) Representative blots of the GFP‐Atg8 processing assay of BY4742 cells expressing the vector control or aSyn variants in the presence or absence of chloroquine (CQ) (50 µg/µl added at day 0 of CLS). (h) Graphical representation of the GFP‐Atg8 processing assay. (i) CLS of BY4742 cells expressing the vector control or aSyn variants in the presence (solid lines) or absence (dashed lines) of CQ. (j) Cell cycle analysis of BY4742 cells expressing wt aSyn treated or not with CQ. (Data on Figure 4g,I,j for BY4742 cells expressing the vector control or aSyn variants without CQ are repeated from Figure 1 to facilitate interpretation). Significance of the data from h–j was determined by two‐way ANOVA (*p ≤ 0.05, **p ≤ 0.01; ***p ≤ 0.001, ****p ≤ 0.0001) comparing BY4742 cells expressing the vector control or aSyn variants in the presence or absence of CQ. (k) Representative blots for Rad53 phosphorylation and Rnr3. (l) Graphical representation of the Rnr3/Pgk1 and (m) relative RNR3mRNA levels of BY4742 cells expressing wt aSyn in the absence or presence of CQ. As a positive or negative control for DDR activation, extracts from cells treated with hydroxyurea (HU) were used. Significance of the data was determined by Student's t test (**p ≤ 0.01; ***p ≤ 0.001) comparing BY4742 cells expressing the vector control or aSyn variants in the presence or absence of CQ. (n) Representative blot for Rnr1 and (o) graphical representation of the Rnr1/Pgk1 of BY4742 cells expressing the vector control or aSyn variants treated with CQCC BY · PubMed Central
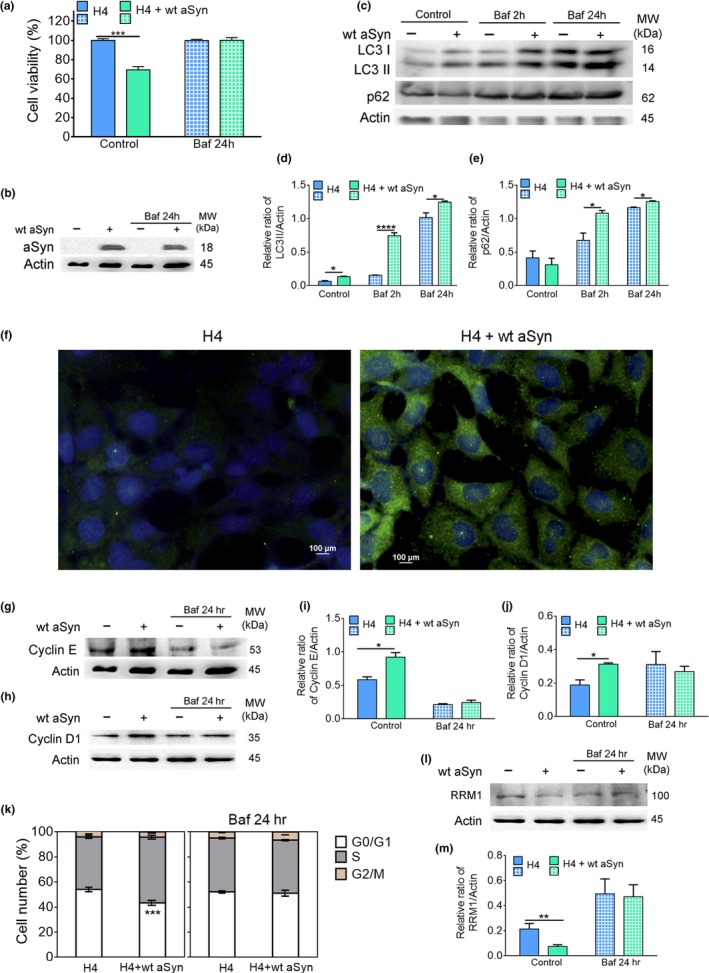
Figure 5 aSyn promotes S‐phase cell cycle arrest, increases autophagy, and decreases RRM1 levels in human cells. (a) Cellular viability and (b) aSyn levels of H4 cells transiently transfected with the vector control or wt aSyn in the absence (control) or presence of bafilomycin A1 (Baf) (10 nM for 24 hr). (c) Representative blot of LC3 processing and p62 for autophagy flux assessment. (d,e) Graphical representation of the LC3II/actin and p62/actin, respectively. For the evaluation of autophagy flux, control samples expressing the vector control or wt aSyn were incubated for 2 hr with Baf (10 nM). (f) Representative image of microscopy visualization of LC3 puncta. Cells were stained with an antibody against anti‐LC3 (green) and counterstained with DAPI to label nuclei (blue). Bar = 100 µm. (g,h) Representative blot of cyclin E and D1, respectively. Graphical representation of (i) cyclin E and (j) cyclin D1 protein levels. (k) Cell cycle analysis. (I) Representative blot of RRM1 levels and (m) graphical representation of the RRM1/actin. Significance of data was determined by Student's t test (*p ≤ 0.05, **p ≤ 0.01, ***p ≤ 0.001, ****p ≤ 0.0001) between H4 cells expressing the vector control or wt aSyn untreated or treated with Baf for 2 hr or 24 hr
Figure 5 aSyn promotes S‐phase cell cycle arrest, increases autophagy, and decreases RRM1 levels in human cells. (a) Cellular viability and (b) aSyn levels of H4 cells transiently transfected with the vector control or wt aSyn in the absence (control) or presence of bafilomycin A1 (Baf) (10 nM for 24 hr). (c) Representative blot of LC3 processing and p62 for autophagy flux assessment. (d,e) Graphical representation of the LC3II/actin and p62/actin, respectively. For the evaluation of autophagy flux, control samples expressing the vector control or wt aSyn were incubated for 2 hr with Baf (10 nM). (f) Representative image of microscopy visualization of LC3 puncta. Cells were stained with an antibody against anti‐LC3 (green) and counterstained with DAPI to label nuclei (blue). Bar = 100 µm. (g,h) Representative blot of cyclin E and D1, respectively. Graphical representation of (i) cyclin E and (j) cyclin D1 protein levels. (k) Cell cycle analysis. (I) Representative blot of RRM1 levels and (m) graphical representation of the RRM1/actin. Significance of data was determined by Student's t test (*p ≤ 0.05, **p ≤ 0.01, ***p ≤ 0.001, ****p ≤ 0.0001) between H4 cells expressing the vector control or wt aSyn untreated or treated with Baf for 2 hr or 24 hrCC BY · PubMed Central
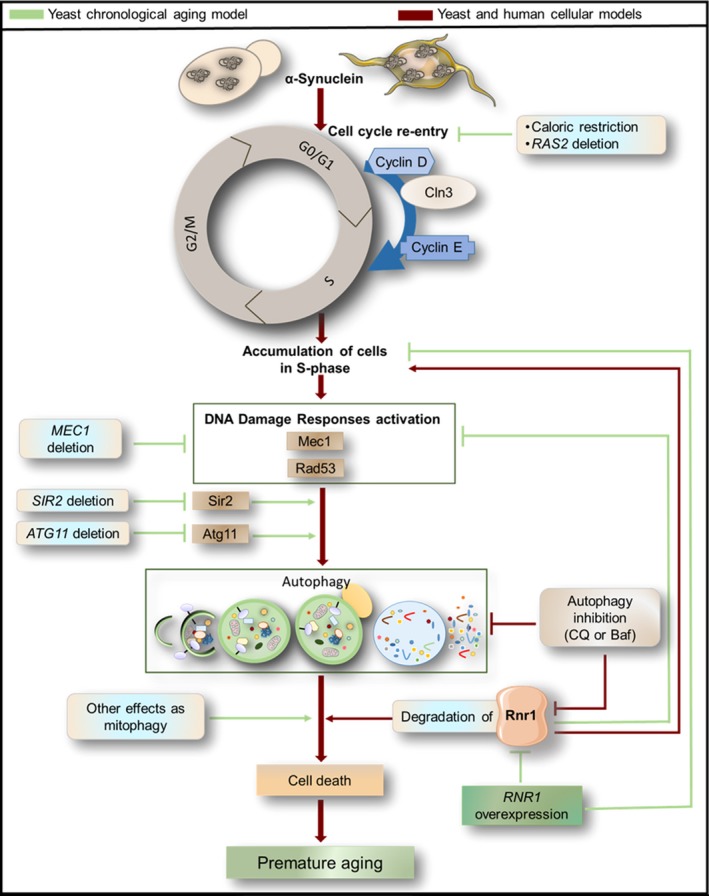
Figure 6 A model for aSyn toxicity that integrates inappropriate cell cycle re‐entry, activation of DNA damage responses, autophagy induction, and downregulation of ribonucleotide reductase 1 (Rnr1)
Figure 6 A model for aSyn toxicity that integrates inappropriate cell cycle re‐entry, activation of DNA damage responses, autophagy induction, and downregulation of ribonucleotide reductase 1 (Rnr1)CC BY · PubMed Central

Verification

Claims the paper makes

The claims and statistics of this paper haven’t been checked yet.

Run the check — free, no account needed. It reads the open-access text and checks the sources it cites.

A few free checks a day · papers already verified open instantly · results are public

Claims other papers make about this one

Each is checked against this paper’s own text: does it say what the citing paper says it does?

Self-check

Percentages, sums and reported differences re-computed from the paper’s own numbers.

The self-check needs the paper’s full text.

Citations

Cites

Research works printed but not linked: 36

  1. 10.1007/s00018-010-0408-5 · DOI
  2. 10.1016/S0076-6879(08)03201-1 · DOI
  3. 10.4061/2011/789431 · DOI
  4. 10.1016/j.devcel.2018.07.011 · DOI
  5. 10.1371/journal.pbio.2000374 · DOI
  6. 10.1158/1541-7786.MCR-10-0473 · DOI
  7. 10.1073/pnas.1614364114 · DOI · Paper page
  8. 10.1016/j.jmb.2005.06.060 · DOI
  9. 10.1083/jcb.200610071 · DOI
  10. 10.1007/s12640-011-9277-4 · DOI
  11. Fortuna M. Sousa M. J. Corte‐Real M. Leao C. Salvador A. &Sansonetty F.(2001).Cell cycle analysis of yeasts.Curr Protoc Cytom Chapter 11 Unit 11 13.https://doi.org/10.1002/0471142956.cy1113s13 · DOI
  12. 10.1016/j.mad.2016.04.006 · DOI · Paper page
  13. 10.1534/g3.115.016576 · DOI
  14. 10.1093/hmg/ddl243 · DOI
  15. 10.1016/S0197-4580(02)00196-3 · DOI
  16. 10.1007/BF00414448 · DOI
  17. 10.1093/hmg/ddr246 · DOI
  18. 10.5772/61783 · DOI
  19. 10.1212/WNL.0b013e31822f0435 · DOI
  20. 10.1126/science.1090439 · DOI
  21. 10.1093/hmg/ddx114 · DOI · Paper page
  22. 10.1523/JNEUROSCI.23-04-01237.2003 · DOI
  23. 10.3390/biom5020735 · DOI
  24. 10.4161/auto.21275 · DOI
  25. 10.1016/j.bbadis.2016.09.010 · DOI
  26. 10.1073/pnas.2232515100 · DOI
  27. 10.1016/j.gde.2017.01.013 · DOI
  28. 10.1089/rej.2015.1717 · DOI
  29. 10.1016/j.molcel.2007.04.023 · DOI
  30. 10.3233/JPD-130216 · DOI
  31. 10.4161/cc.24232 · DOI
  32. 10.1371/journal.pone.0000748 · DOI
  33. 10.1038/nm.4269 · DOI · Paper page
  34. 10.1007/s12035-012-8341-2 · DOI
  35. 10.1093/emboj/20.13.3544 · DOI
  36. 10.1038/cddis.2014.307 · DOI

Cited by

Sorted by citations

See all 27

Metadata

Authors
Sampaio‐Marques, B., Guedes, A., Vasilevskiy, I., Gonçalves, S., Outeiro, T. F., Winderickx, J., Burhans, W. C., & Ludovico, P.
Affiliations
  • School of Medicine, Life and Health Sciences Research Institute (ICVS) University of Minho Braga Portugal
  • Faculdade de Ciências Médicas, CEDOC – Chronic Diseases Research Center Universidade Nova de Lisboa Lisboa Portugal
  • Functional Biology KU Leuven Heverlee Belgium
  • Department of Molecular and Cellular Biology Roswell Park Cancer Institute Buffalo New York
Venue
Aging Cell
Publisher
Wiley
Published
2019-04-11
Volume
18
Issue
4
ISSN
  • 1474-9718
  • 1474-9726
Cited by
27
References
4
Language
en
Funders
  • Roswell Park Alliance Foundation, Roswell Park Cancer Institute
  • Fuel Cycle Technologies (SFRH/BPD/90533/2012)
  • California Department of Fish and Game

About these checks

Registry, retraction, Cites and statistics results are computed, not judged, with one exception: a printed reference that no index lists is read once by a model before it counts as a citation error. Claims are extracted by a model and kept only when their quote appears verbatim in the text; each cited source is then checked, with a model’s help, for whether it says what the claim relies on. Those verdicts can be wrong — read the claim’s quote and the cited source before relying on one.

Statistics and arithmetic are recomputed, not judged.

Confidence bands are shown only for fields calibrated on our annotated test set. None is calibrated yet, so no band is shown.

What counts as a claim ›How we measure confidence ›How we check this ›

Are you an author, or do you see a problem with this page? Request a review