Cited by 20

The DOI matches its Crossref record; 4 of the 4 references it cites were found in a registry or an index.

Signalling mechanisms that regulate metabolic profile and autophagy of acute myeloid leukaemia cells

Pereira, Olga, Teixeira, Alexandra, Sampaio‐Marques, Belém, Castro, Isabel, Girão, Henrique, Ludovico, Paula·2018·Journal of Cellular and Molecular Medicine

Abstract

Acute myeloid leukaemia (AML) comprises a heterogeneous group of hematologic neoplasms characterized by diverse combinations of genetic, phenotypic and clinical features representing a major challenge for the development of targeted therapies. Metabolic reprogramming, mainly driven by deregulation of the nutrient‐sensing pathways as AMPK, mTOR and PI 3K/AKT, has been associated with cancer cells, including AML cells, survival and proliferation. Nevertheless, the role of these metabolic adaptations on the AML pathogenesis is still controversial. In this work, the metabolic status and the respective metabolic networks operating in different AML cells (NB‐4, HL‐60 and KG‐1) and their impact on autophagy and survival was characterized. Data show that whereas KG‐1 cells exhibited preferential mitochondrial oxidative phosphorylation metabolism with constitutive co‐activation of AMPK and mTORC 1 associated with increased autophagy, NB‐4 and HL‐60 cells displayed a dependent glycolytic profile mainly associated with AKT/mTORC 1 activation and low autophagy flux. Inhibition of AKT is disclosed as a promising therapeutical target in some scenarios while inhibition of AMPK and mTORC 1 has no major impact on KG‐1 cells’ survival. The results highlight an exclusive metabolic profile for each tested AML cells and its impact on determination of the anti‐leukaemia efficacy and on personalized combinatory therapy with conventional and targeted agents.

Overview

The claims and statistics of this paper haven’t been checked yet.

Run the check — free, no account needed. It reads the open-access text and checks the sources it cites.

A few free checks a day · papers already verified open instantly · results are public

Integrity signals

Registry

Crossref · 10.1111/jcmm.13737

Cites

4 of 4 references verified0 citation errors · 0 not checkable

Statistics

Figures

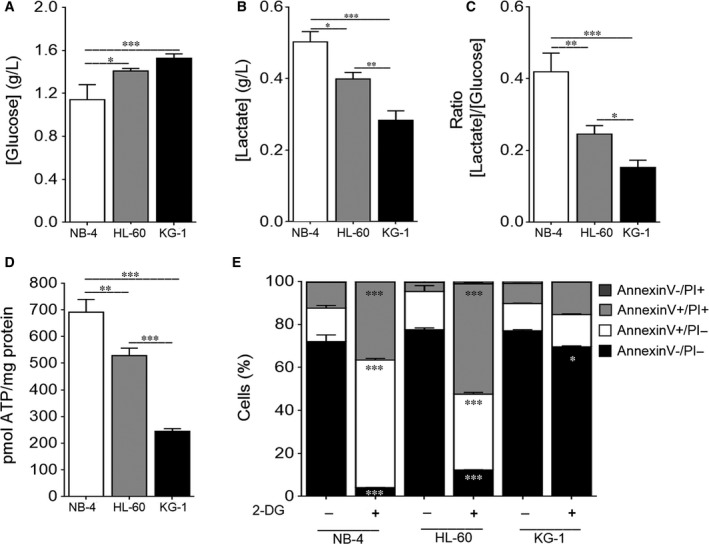
Figure 1 NB‐4 cells present a high glycolytic metabolism followed by HL‐60 and KG‐1 cells. NB‐4, HL‐60 and KG‐1 cells were maintained for 24 h in normal growth medium. (A) Extracellular glucose and (B) lactate levels were determined using glucose and lactate enzymatic detection kits. (C) The ratio between the extracellular lactate and glucose levels ([Lactate]/[Glucose]) was calculated. (D) Intracellular ATP levels were assessed by the ENLITEN ATP Assay System. (E) Cell viability quantification was determined by flow cytometry analysis of annexin V and propidium iodide (PI)‐stained NB‐4, HL‐60 or KG‐1 cells untreated or treated with 2‐DG instead of glucose, for 24 h. The results presented as mean ± SEM of, at least, 3 independent biological replicates. One‐way ANOVA and Tukey's post hoc test were used to compare the extracellular glucose and lactate levels, the [Lactate]/[Glucose] ratio and the intracellular ATP levels between NB‐4, HL60 and KG‐1 cells. Annexin V/PI data were analysed using 2‐way ANOVA and Bonferroni's post hoc test. *P < .05; **P < .01; ***P < .001
Figure 1 NB‐4 cells present a high glycolytic metabolism followed by HL‐60 and KG‐1 cells. NB‐4, HL‐60 and KG‐1 cells were maintained for 24 h in normal growth medium. (A) Extracellular glucose and (B) lactate levels were determined using glucose and lactate enzymatic detection kits. (C) The ratio between the extracellular lactate and glucose levels ([Lactate]/[Glucose]) was calculated. (D) Intracellular ATP levels were assessed by the ENLITEN ATP Assay System. (E) Cell viability quantification was determined by flow cytometry analysis of annexin V and propidium iodide (PI)‐stained NB‐4, HL‐60 or KG‐1 cells untreated or treated with 2‐DG instead of glucose, for 24 h. The results presented as mean ± SEM of, at least, 3 independent biological replicates. One‐way ANOVA and Tukey's post hoc test were used to compare the extracellular glucose and lactate levels, the [Lactate]/[Glucose] ratio and the intracellular ATP levels between NB‐4, HL60 and KG‐1 cells. Annexin V/PI data were analysed using 2‐way ANOVA and Bonferroni's post hoc test. *P < .05; **P < .01; ***P < .001CC BY · PubMed Central
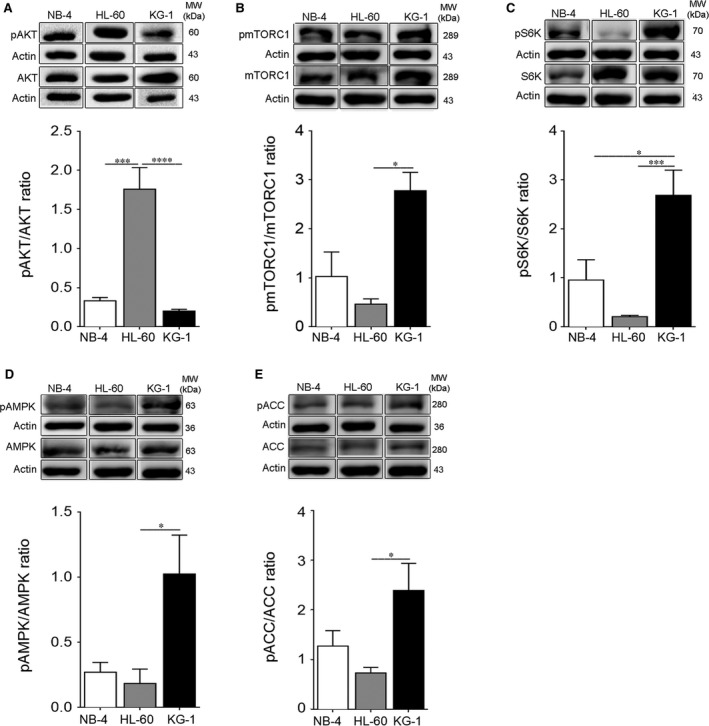
Figure 2 NB‐4 and HL‐60 cells exhibit AKT activation while KG‐1 cells display a constitutive AMPK and mTORC1 co‐activation. NB‐4, HL‐60 and KG‐1 cells were maintained for 24 h in normal growth medium. (A) Activation of AKT was determined by immunoblotting analysis of phosphorylated (Ser473) AKT levels. Activation of (B) mTORC1 and (C) S6K was also assessed by immunoblotting analysis of phosphorylated (Ser2448) mTORC1 and phosphorylated (Thr389) S6K levels, respectively. Activation of (D) AMPK and (E) ACC was evaluated by immunoblotting analysis of phosphorylated (Thr172) AMPK and phosphorylated (Ser79) ACC levels, respectively. Actin was used as loading control. Densitometric analysis was performed, and bands were quantified using the ImageLab4.1™ software. The results presented as mean ± SEM of, at least, 3 independent biological replicates. One‐way ANOVA and Tukey's post hoc test were used to compare the densitometric analysis of pAKT/AKT, pmTORC1/mTORC1, pS6K/S6K, pAMPK/AMPK and pACC/ACC ratios between NB‐4, HL‐60 and KG‐1 cells. *P < .05; ***P < .001
Figure 2 NB‐4 and HL‐60 cells exhibit AKT activation while KG‐1 cells display a constitutive AMPK and mTORC1 co‐activation. NB‐4, HL‐60 and KG‐1 cells were maintained for 24 h in normal growth medium. (A) Activation of AKT was determined by immunoblotting analysis of phosphorylated (Ser473) AKT levels. Activation of (B) mTORC1 and (C) S6K was also assessed by immunoblotting analysis of phosphorylated (Ser2448) mTORC1 and phosphorylated (Thr389) S6K levels, respectively. Activation of (D) AMPK and (E) ACC was evaluated by immunoblotting analysis of phosphorylated (Thr172) AMPK and phosphorylated (Ser79) ACC levels, respectively. Actin was used as loading control. Densitometric analysis was performed, and bands were quantified using the ImageLab4.1™ software. The results presented as mean ± SEM of, at least, 3 independent biological replicates. One‐way ANOVA and Tukey's post hoc test were used to compare the densitometric analysis of pAKT/AKT, pmTORC1/mTORC1, pS6K/S6K, pAMPK/AMPK and pACC/ACC ratios between NB‐4, HL‐60 and KG‐1 cells. *P < .05; ***P < .001CC BY · PubMed Central
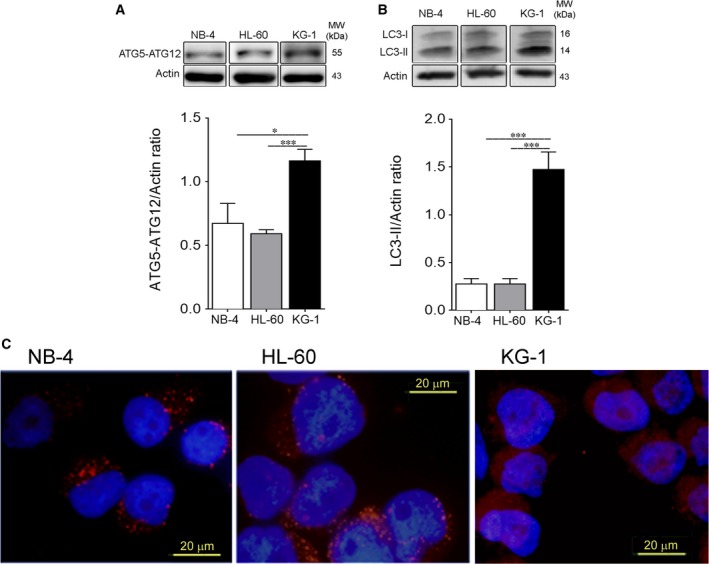
Figure 3 NB‐4 and HL‐60 cells show decreased autophagy flux when compared to KG‐1 cells. Autophagy flux was assessed by immunoblotting analysis of (A) Atg5‐Atg12 complex and (B) LC3 processing (I and II; all samples were incubated for 2 h with bafilomycin A1 [10 nmol/L] before the end of the experiment to block autophagy flux and to allow LC3‐II accumulation) of NB‐4, HL‐60 and KG‐1 cells incubated for 24 h in normal growth medium. Actin was used as loading control. Densitometric analysis was performed, and bands were quantified using the ImageLab4.1™ software. The results presented as mean ± SEM of, at least, 3 independent biological replicates. One‐way ANOVA and Tukey's post hoc test were used to compare densitometric analysis of Atg5‐Atg12/Actin, LC3‐II/Actin and p62/Actin ratios between NB‐4, HL60 and KG‐1 cells. *P < .05; **P < .01; ***P < .001. (C) LC3 A/B‐I/II puncta levels of AML cells were also assessed by immunofluorescence assay upon 24 h in normal growth medium. NB‐4, HL‐60 and KG‐1 cells were staining with goat LC3 anti‐Rabbit IgG antibody (red fluorescence) and samples were counter‐stained with the DNA dye DAPI (blue fluorescence). Representative images of immunofluorescence assay are presented. Bar = 20 μm
Figure 3 NB‐4 and HL‐60 cells show decreased autophagy flux when compared to KG‐1 cells. Autophagy flux was assessed by immunoblotting analysis of (A) Atg5‐Atg12 complex and (B) LC3 processing (I and II; all samples were incubated for 2 h with bafilomycin A1 [10 nmol/L] before the end of the experiment to block autophagy flux and to allow LC3‐II accumulation) of NB‐4, HL‐60 and KG‐1 cells incubated for 24 h in normal growth medium. Actin was used as loading control. Densitometric analysis was performed, and bands were quantified using the ImageLab4.1™ software. The results presented as mean ± SEM of, at least, 3 independent biological replicates. One‐way ANOVA and Tukey's post hoc test were used to compare densitometric analysis of Atg5‐Atg12/Actin, LC3‐II/Actin and p62/Actin ratios between NB‐4, HL60 and KG‐1 cells. *P < .05; **P < .01; ***P < .001. (C) LC3 A/B‐I/II puncta levels of AML cells were also assessed by immunofluorescence assay upon 24 h in normal growth medium. NB‐4, HL‐60 and KG‐1 cells were staining with goat LC3 anti‐Rabbit IgG antibody (red fluorescence) and samples were counter‐stained with the DNA dye DAPI (blue fluorescence). Representative images of immunofluorescence assay are presented. Bar = 20 μmCC BY · PubMed Central
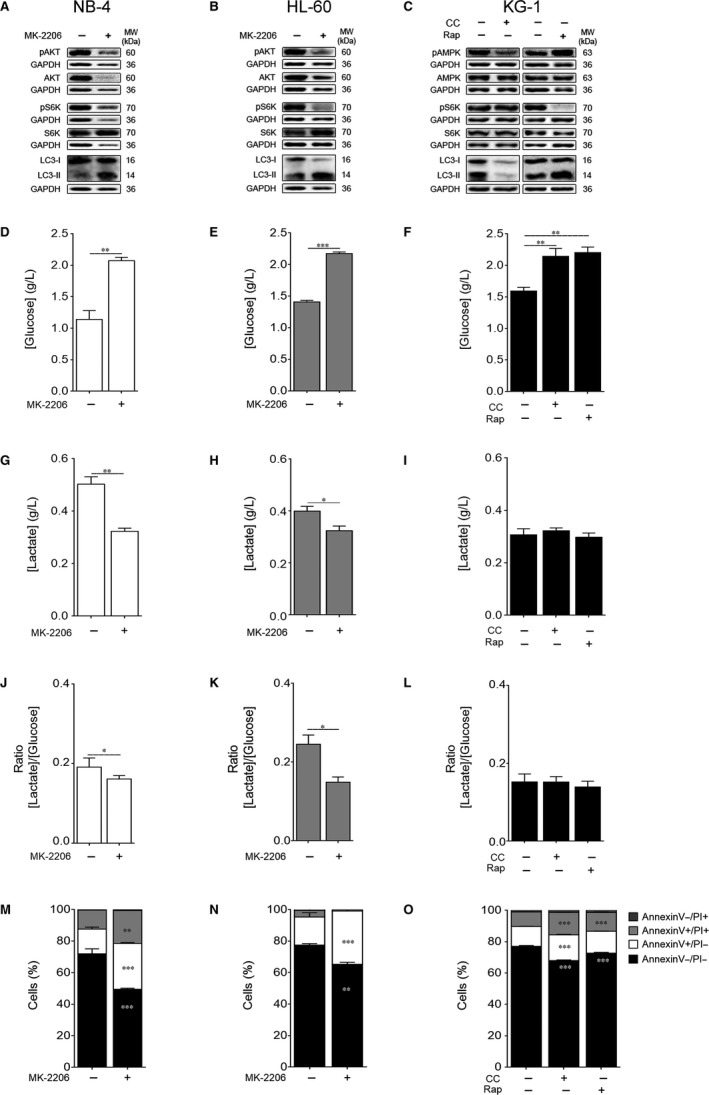
Figure 4 Autophagy and energetic metabolism are mainly regulated by AKT‐mTORC1 axis in NB‐4 and HL‐60 cells and by AMPK in KG‐1 cells. NB‐4 and HL‐60 cells were maintained for 24 h with or without MK‐2206 20 μmol/L while KG‐1 cells were cultured for 24 h with or without compound C (CC) 2.5 μmol/L or rapamycin (Rap) 2 μmol/L. (A‐C) Activation of AMPK, AKT and S6K as well as autophagy flux were assessed by immunoblotting analysis. Activation of AMPK and AKT was evaluated by immunoblotting analysis of phosphorylated (Thr172) AMPK and phosphorylated (Ser473) AKT levels, respectively. Activation of S6K was also evaluated by immunoblotting analysis of phosphorylated (Thr389) S6K levels. Autophagy flux was assessed by immunoblotting analysis of LC3 processing (I and II; all samples were incubated for 2 h with bafilomycin A1 [10 nmol/L] before the end of the experiment to block autophagy flux and to allow LC3‐II accumulation). GAPDH was used as loading control. The results are representative of, at least, 3 independent biological replicates. (D‐F) Extracellular glucose and (G‐I) lactate levels were determined using glucose and lactate enzymatic detection kits. (J‐L) Ratio between the extracellular lactate and glucose levels ([Lactate]/[Glucose]). The results presented as mean ± SEM of, at least, 3 independent biological replicates. Student's t test was applied to compare the extracellular glucose and lactate levels as well as the [Lactate]/[Glucose] ratio between untreated and MK‐2206‐treated NB‐4 and HL‐60 cells. One‐way ANOVA and Tukey's post hoc test were used to compare the extracellular glucose and lactate levels as well as the [Lactate]/[Glucose] ratio between untreated and CC‐ or Rap‐treated KG‐1 cells. *P < .05; **P < .01; ***P < .001. (M‐O) Cell viability quantification was determined by flow cytometry analysis of annexin V and PI‐stained NB‐4, HL‐60 or KG‐1 cells. The results presented as mean ± SEM of, at least, 3 independent biological replicates. Annexin V/PI data were analysed using the 2‐way ANOVA and Bonferroni's post hoc test. **P < .01; ***P < .001
Figure 4 Autophagy and energetic metabolism are mainly regulated by AKT‐mTORC1 axis in NB‐4 and HL‐60 cells and by AMPK in KG‐1 cells. NB‐4 and HL‐60 cells were maintained for 24 h with or without MK‐2206 20 μmol/L while KG‐1 cells were cultured for 24 h with or without compound C (CC) 2.5 μmol/L or rapamycin (Rap) 2 μmol/L. (A‐C) Activation of AMPK, AKT and S6K as well as autophagy flux were assessed by immunoblotting analysis. Activation of AMPK and AKT was evaluated by immunoblotting analysis of phosphorylated (Thr172) AMPK and phosphorylated (Ser473) AKT levels, respectively. Activation of S6K was also evaluated by immunoblotting analysis of phosphorylated (Thr389) S6K levels. Autophagy flux was assessed by immunoblotting analysis of LC3 processing (I and II; all samples were incubated for 2 h with bafilomycin A1 [10 nmol/L] before the end of the experiment to block autophagy flux and to allow LC3‐II accumulation). GAPDH was used as loading control. The results are representative of, at least, 3 independent biological replicates. (D‐F) Extracellular glucose and (G‐I) lactate levels were determined using glucose and lactate enzymatic detection kits. (J‐L) Ratio between the extracellular lactate and glucose levels ([Lactate]/[Glucose]). The results presented as mean ± SEM of, at least, 3 independent biological replicates. Student's t test was applied to compare the extracellular glucose and lactate levels as well as the [Lactate]/[Glucose] ratio between untreated and MK‐2206‐treated NB‐4 and HL‐60 cells. One‐way ANOVA and Tukey's post hoc test were used to compare the extracellular glucose and lactate levels as well as the [Lactate]/[Glucose] ratio between untreated and CC‐ or Rap‐treated KG‐1 cells. *P < .05; **P < .01; ***P < .001. (M‐O) Cell viability quantification was determined by flow cytometry analysis of annexin V and PI‐stained NB‐4, HL‐60 or KG‐1 cells. The results presented as mean ± SEM of, at least, 3 independent biological replicates. Annexin V/PI data were analysed using the 2‐way ANOVA and Bonferroni's post hoc test. **P < .01; ***P < .001CC BY · PubMed Central

Verification

Claims the paper makes

The claims and statistics of this paper haven’t been checked yet.

Run the check — free, no account needed. It reads the open-access text and checks the sources it cites.

A few free checks a day · papers already verified open instantly · results are public

Claims other papers make about this one

Each is checked against this paper’s own text: does it say what the citing paper says it does?

Self-check

Percentages, sums and reported differences re-computed from the paper’s own numbers.

The self-check needs the paper’s full text.

Citations

Cites

Research works printed but not linked: 51

  1. 10.1056/NEJM199909303411407 · DOI
  2. 10.1016/S0140-6736(06)69780-8 · DOI
  3. 10.1016/j.exphem.2009.04.002 · DOI
  4. 10.1182/blood-2012-02-392506 · DOI
  5. 10.1200/JCO.2012.42.2907 · DOI
  6. 10.1182/blood-2010-05-260117 · DOI
  7. 10.1002/cncr.23000 · DOI
  8. 10.1200/JCO.2005.05.010 · DOI
  9. 10.1158/2159-8290.CD-12-0345 · DOI
  10. 10.1016/j.cell.2011.02.013 · DOI · Paper page
  11. 10.1126/science.1160809 · DOI · Paper page
  12. 10.1182/blood-2014-02-554204 · DOI
  13. 10.1189/jlb.0710417 · DOI
  14. 10.1038/nrd3504 · DOI
  15. 10.3324/haematol.2009.013797 · DOI
  16. 10.1182/blood-2006-12-061283 · DOI
  17. 10.1182/blood-2002-11-3429 · DOI
  18. 10.1038/leu.2017.81 · DOI · Paper page
  19. 10.1038/leu.2013.107 · DOI
  20. 10.1016/j.stem.2015.08.019 · DOI
  21. 10.1016/j.celrep.2015.04.063 · DOI · Paper page
  22. 10.1080/23723556.2015.1071303 · DOI
  23. 10.1182/blood-2010-02-269837 · DOI · Paper page
  24. 10.1038/leu.2011.339 · DOI
  25. 10.1182/blood-2004-06-2494 · DOI
  26. 10.18632/oncotarget.2947 · DOI
  27. 10.1016/j.cmet.2011.01.009 · DOI
  28. 10.1016/j.febslet.2010.01.017 · DOI · Paper page
  29. 10.1002/path.2697 · DOI
  30. 10.1084/jem.20101145 · DOI · Paper page
  31. 10.1182/blood-2016-07-692707 · DOI
  32. 10.1615/CritRevEukarGeneExpr.v21.i1.50 · DOI
  33. 10.1016/j.ccr.2008.05.005 · DOI · Paper page
  34. 10.1016/S0021-9258(18)64100-6 · DOI
  35. 10.1080/14728222.2017.1333600 · DOI
  36. 10.4161/cc.24700 · DOI
  37. 10.1042/bj3450437 · DOI
  38. 10.1038/ncb2329 · DOI · Paper page
  39. 10.15698/mic2016.12.546 · DOI
  40. 10.1016/j.bbamcr.2014.09.023 · DOI
  41. 10.1186/s40591-015-0040-8 · DOI
  42. 10.1158/2159-8290.CD-16-0441 · DOI · Paper page
  43. 10.1021/cb900300j · DOI
  44. 10.1200/JCO.2005.04.5450 · DOI
  45. 10.3109/10428194.2010.512966 · DOI
  46. 10.3892/or.2013.2299 · DOI
  47. 10.1080/10245332.2017.1402454 · DOI
  48. 10.1016/j.cmet.2016.03.008 · DOI
  49. 10.1038/ncomms13254 · DOI · Paper page
  50. 10.1038/cddiscovery.2015.8 · DOI
  51. 10.1158/1078-0432.CCR-06-0764 · DOI

Cited by

Sorted by citations

See all 20

Metadata

Authors
Pereira, O., Teixeira, A., Sampaio‐Marques, B., Castro, I., Girão, H., & Ludovico, P.
Affiliations
  • Life and Health Sciences Research Institute (ICVS) School of Medicine University of Minho Braga Portugal
  • Institute for Biomedical Imaging and Life Science (IBILI) Faculty of Medicine University of Coimbra Coimbra Portugal
Venue
Journal of Cellular and Molecular Medicine
Publisher
Wiley
Published
2018-08-17
Volume
22
Issue
10
Pages
4807-4817
ISSN
  • 1582-1838
  • 1582-4934
Cited by
20
References
4
Language
en
Funders
Fundação para a Ciência e a Tecnologia (SFRH/BD/52292/2013, SFRH/BPD/90533/2012)

About these checks

Registry, retraction, Cites and statistics results are computed, not judged, with one exception: a printed reference that no index lists is read once by a model before it counts as a citation error. Claims are extracted by a model and kept only when their quote appears verbatim in the text; each cited source is then checked, with a model’s help, for whether it says what the claim relies on. Those verdicts can be wrong — read the claim’s quote and the cited source before relying on one.

Statistics and arithmetic are recomputed, not judged.

Confidence bands are shown only for fields calibrated on our annotated test set. None is calibrated yet, so no band is shown.

What counts as a claim ›How we measure confidence ›How we check this ›

Are you an author, or do you see a problem with this page? Request a review