

The DOI matches its Crossref record; 60 of the 60 references it cites were found in a registry or an index; none of the 67 sources its claims cite is checked for support yet.
Dietary Intake of Canadian Middle‐Aged Endurance Athletes
Open accessAbstract
Introduction: The purpose of the present study was to assess dietary intakes of Canadian non‐elite middle‐aged endurance athletes and explore potential sex differences. Methods: Non‐consecutive 3‐day food intake records (FIR) were analyzed using Cronometer. Intakes were compared to dietary reference intakes (DRIs), acceptable macronutrient distribution ranges (AMDRs), and sports nutrition guidelines when available. Dietary intakes, including the proportion of males versus females meeting recommendations for each nutrient, were assessed using descriptive statistics, independent t ‐tests, and/or Fisher's exact test. Results: A total of n = 44 (28 M/16 F) middle‐aged endurance athletes completed the study (age = 50.4 ± 7.2 years, BMI = 23.6 ± 3.2 kg/m 2 , moderate‐vigorous activity [MVA] = 627.0 ± 3.2 min/week). All athletes met recommendations for protein (PRO), but not carbohydrates (CHO; 20.5% met sport nutrition guidelines) or fat (FAT; 54.5% exceeded AMDRs), with no differences between males and females. Athletes did not meet the recommended intakes for vitamin D (4.5% [38.6% with supplementation]), vitamin E (34.1% [47.7% with supplementation]), potassium (15.9%), calcium (50.0% [61.4% with supplementation]), or magnesium (65.9% [78.0% with supplementation]), and exceed the recommended intake of sodium (70.5% exceeded DRI). Females were more likely than males to have intakes below the DRIs for several vitamins and minerals, however many of these differences disappeared when supplement use was considered. Conclusion: Middle‐aged athletes require diets that not only support physical performance but also promote healthy aging. Findings in the present study indicate that Canadian non‐elite middle‐aged endurance athletes are not meeting recommended intakes of CHO, FAT, and many micronutrients; improving adherence to recommended intakes may help these athletes achieve optimal performance, taking into consideration age‐ and sex‐related physiological changes. Future directions should investigate longitudinal dietary intake among middle‐aged endurance athletes, as well as dietary intake based on menopausal stage.
Overview
CoChat Summary
TL;DR
This cross-sectional study assessed 3-day food intake records from 44 Canadian non-elite middle-aged (40–65 y) endurance athletes and found widespread shortfalls in carbohydrate and micronutrient intake alongside excessive fat and sodium intake, with few sex differences once supplement use was accounted for. The authors conclude that improving adherence to dietary recommendations may support both performance and healthy aging in this population.
Key findings
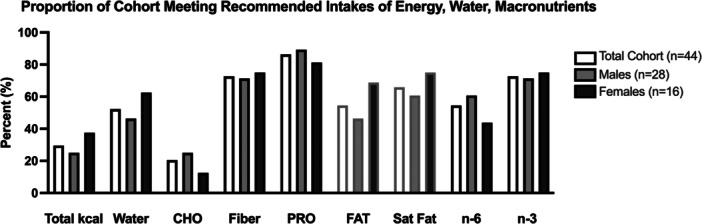
- All 44 athletes met the protein AMDR (10–35% of energy) and 86.4% (n = 38) met the sport nutrition guideline of 1.2–2.0 g/kg/day; only 64.3% of males and 43.8% of females met the 1.6 g/kg/day recommendation for masters athletes (p = 0.220).
- Carbohydrate intake fell short: 27.3% (n = 12) fell within the sport guideline of 50–65% of energy and only 20.5% (n = 9) met 5–10 g/kg/day. Conversely, 54.5% (n = 24) exceeded the fat AMDR upper limit of 35% of energy and 65.9% (n = 29) exceeded the saturated fat recommendation of < 10%.
- Only 29.5% (n = 13) met total energy requirements (EER) and 52.3% (n = 23) met the water AI; 72.7% (n = 32) met the fiber AI.
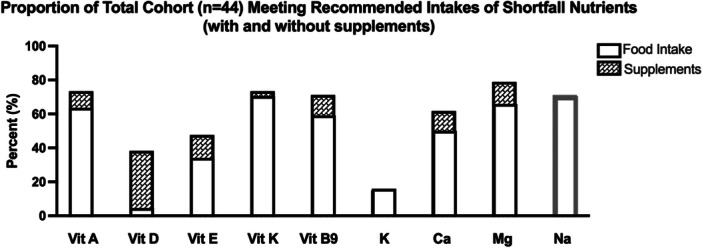
- Shortfall micronutrients (< 75% of cohort meeting DRI) were vitamin A (63.6%), vitamin D (4.5%), vitamin E (34.1%), vitamin K (70.5%), folate/B9 (59.1%), potassium (15.9%), calcium (50.0%) and magnesium (65.9%); 70.5% exceeded the sodium CDRR. With supplements added, meeting rates rose (e.g., vitamin D 4.5% to 38.6%, magnesium 65.9% to 78.0%).
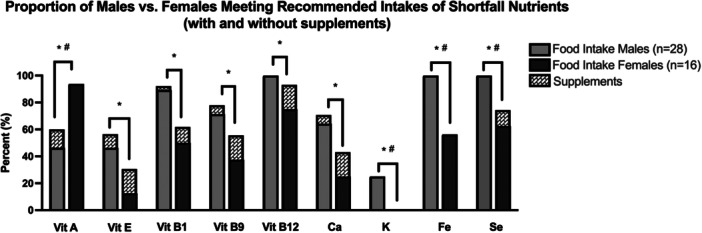
- Females were at greater risk than males of not meeting recommendations for vitamin E, B1, B9, B12, calcium, potassium, iron and selenium; differences for vitamin E, B1, B9, B12 and calcium disappeared with supplementation, while vitamin A (males at greater risk), potassium, iron and selenium persisted.
Methods
- Cross-sectional study; data collected January–August 2020 via social media, email and snowball sampling. Participants were 44 Canadian middle-aged (40–65 y) non-elite endurance athletes (28 M/16 F; age 50.4 ± 7.2 y; BMI 23.6 ± 3.2 kg/m²; 627.0 ± 232.0 min/week MVPA) training ≥ 8 h/week; exclusions included COVID-19-related diet/activity changes, pregnancy/breastfeeding, and digestive disorders.
- Participants completed an online survey (Qualtrics) for demographics, medical history, menopause status and IPAQ-SF physical activity, plus a 3-day food intake record on two non-consecutive weekdays and one weekend day, analyzed in Cronometer (v2.18.6); supplements were assessed separately and added to food intake for "total intake" analyses.
- Intakes were compared with DRIs (RDA/AI), AMDRs and sport nutrition guidelines; EER was calculated with the Mifflin-St Jeor equation. Descriptive statistics, independent t-tests and Fisher's exact test were used (SPSS v28; significance at p < 0.05), with post hoc power calculations reported as adequate for sex-based comparisons.
Limitations
- Stated by the authors: relatively small sample size and cross-sectional design that may not reflect long-term consumption patterns; reliance on self-reported body mass for body-mass-relative nutrient recommendations; no training volume or intensity recorded on food-record days; protein distribution across the day not assessed.
- Stated by the authors: the female subsample was too small to evaluate nutrient intake by menopause stage (data were pooled across pre-, peri- and post-menopausal participants).
- Evident from the text: the sample was geographically concentrated (26 of 44 in Saskatchewan, 15 in Ontario), and the 3-day FIR method carries potential for reactivity and underreporting as noted by the authors; the abstract reports MVA as 627.0 ± 3.2 min/week while Table 1 reports 627.0 ± 232.0 min/week, an internal inconsistency in the reporting.
Model-written summary. Check it against the paper before relying on it.
Integrity signals
Registry
Cites
Statistics
Figures
Verification
Claims the paper makes
0 Valid · 1 Not valid · 35 Not checked · 77 Own results and interpretations
A result the paper reports from its own data — it cites no other source for it, so there is none to check. The quote shows it is in the paper.
In the paper
“The entire cohort met the AMDR for PRO of 10%–35% of total kcal intake”
§ Dietary Intake of Canadian Middle‐Aged Endurance Athletes > Results > Proportion of Cohort Meeting Recommended Intakes
plain- Asserted: passes — The authors put it forward as true.
- Checkable: passes — It can be checked against evidence.
- Load-bearing: unclear — It is unclear whether the paper’s conclusions depend on it.
- Based: passes — The paper gives a reason why it holds.
A result the paper reports from its own data — it cites no other source for it, so there is none to check. The quote shows it is in the paper.
In the paper
“70.5% of the total cohort exceeded the DRI chronic disease risk reduction (CDRR) (n = 31)”
§ Dietary Intake of Canadian Middle‐Aged Endurance Athletes > Results > Proportion of Cohort Meeting Recommended Intakes
plainn = 31- Asserted: passes — The authors put it forward as true.
- Checkable: passes — It can be checked against evidence.
- Load-bearing: unclear — It is unclear whether the paper’s conclusions depend on it.
- Based: passes — The paper gives a reason why it holds.
- Rests on an assumption not shown here.
A result the paper reports from its own data — it cites no other source for it, so there is none to check. The quote shows it is in the paper.
In the paper
“magnesium (65.9%, n = 29)”
§ Dietary Intake of Canadian Middle‐Aged Endurance Athletes > Results > Proportion of Cohort Meeting Recommended Intakes
plainn = 29- Asserted: passes — The authors put it forward as true.
- Checkable: passes — It can be checked against evidence.
- Load-bearing: unclear — It is unclear whether the paper’s conclusions depend on it.
- Based: passes — The paper gives a reason why it holds.
- Rests on an assumption not shown here.
A result the paper reports from its own data — it cites no other source for it, so there is none to check. The quote shows it is in the paper.
In the paper
“calcium (50%, n = 22)”
§ Dietary Intake of Canadian Middle‐Aged Endurance Athletes > Results > Proportion of Cohort Meeting Recommended Intakes
plainn = 22- Asserted: passes — The authors put it forward as true.
- Checkable: passes — It can be checked against evidence.
- Load-bearing: unclear — It is unclear whether the paper’s conclusions depend on it.
- Based: passes — The paper gives a reason why it holds.
- Rests on an assumption not shown here.
A result the paper reports from its own data — it cites no other source for it, so there is none to check. The quote shows it is in the paper.
In the paper
“vitamin A (63.6% to 72.7%)”
§ Dietary Intake of Canadian Middle‐Aged Endurance Athletes > Results > Proportion of Cohort Meeting Recommended Intakes
plainstates a cause- Asserted: passes — The authors put it forward as true.
- Checkable: passes — It can be checked against evidence.
- Load-bearing: unclear — It is unclear whether the paper’s conclusions depend on it.
- Based: passes — The paper gives a reason why it holds.
- Rests on 2 assumptions not shown here.
55 more claims
Create a free account to see all 113 claims and to verify the 65 references still open.
- The quote only partly states this claim. 3
- It may state two separate claims as one. 37
- Probably not a substantial claim. 28
Self-check
Percentages, sums and reported differences re-computed from the paper’s own numbers.
Each contradiction between two passages listed here was confirmed by an independent check.
Rated major: it would touch a result — a value a result rests on, reported and recomputed p-values on opposite sides of the significance level, two passages that conflict with no sign which is right, or a cited work retracted before this paper was published.
In the paper
§ Dietary Intake of Canadian Middle‐Aged Endurance Athletes > Results
“| Vitamin A, IU | 4928 ± 3617 | 4170 ± 3669 | 4912 ± 2416 | 3000, 2333 ∣10,000 |”
§ Dietary Intake of Canadian Middle‐Aged Endurance Athletes > Results
“| Micronutrient | Total (n = 44) | Male (n = 28) | Female (n = 16) | DRI: M, F ∣UL |”
Rated major: it would touch a result — a value a result rests on, reported and recomputed p-values on opposite sides of the significance level, two passages that conflict with no sign which is right, or a cited work retracted before this paper was published.
In the paper
“potassium (M 25.0% [n = 11] v F 0.0% [n = 0], p = 0.037)”
§ Dietary Intake of Canadian Middle‐Aged Endurance Athletes > Results > Proportion of Cohort Meeting Recommended Intakes
Reported 25 · recomputed 39.285714
Rated minor: it would not touch a result — a value no result rests on, a p-value that stays on the same side of the significance level, or a conflict that is clerical, resolved elsewhere in the paper, or outside its own findings.
In the paper
§ Dietary Intake of Canadian Middle‐Aged Endurance Athletes > Discussion > Total Energy, Water, Macronutrients
“Further, contrary to previous work reporting low adherence to omega‐3 intake [10, 19], > 75% of the present cohort met the recommended intakes in the present study.”
§ Dietary Intake of Canadian Middle‐Aged Endurance Athletes > Results > Proportion of Cohort Meeting Recommended Intakes
“72.7% (n = 32) met the DRI AI for omega‐6 (M 60.7% [n = 17] v F 43.8% [n = 7]; p = 0.352) and omega‐3 (M 71.4% [n = 20] v F 75.0% [n = 12]; p = 1.0) intake (g/day), respectively.”
Rated minor: it would not touch a result — a value no result rests on, a p-value that stays on the same side of the significance level, or a conflict that is clerical, resolved elsewhere in the paper, or outside its own findings.
In the paper
§ Dietary Intake of Canadian Middle‐Aged Endurance Athletes > Abstract > Results
“MVA] = 627.0 ± 3.2 min/week”
§ Dietary Intake of Canadian Middle‐Aged Endurance Athletes > Results
“| MVPA, min/week | 627.0 ± 232.0 | 634.0 ± 266.7 | 615.9 ± 170. |”
Rated minor: it would not touch a result — a value no result rests on, a p-value that stays on the same side of the significance level, or a conflict that is clerical, resolved elsewhere in the paper, or outside its own findings.
In the paper
“| Never | 33 (75) | 24 (86) | 12 (75) |”
§ Dietary Intake of Canadian Middle‐Aged Endurance Athletes > Results
Reported 33 · recomputed 36
5 more findings
Create a free account to see every finding of this check.
Citations
Cites
International physical activity questionnaire: 12-country reliability and validity
CRAIG, C. L., MARSHALL, A. L., SJ??STR??M, M., BAUMAN, A. E., BOOTH, M. L., AINSWORTH, B. E., PRATT, M., EKELUND, U., YNGVE, A., SALLIS, J. F., et al. (2003) · Medicine & Science in Sports & Exercise · doi:10.1249/01.mss.0000078924.61453.fb · Cited by 21,619
The importance of the ratio of omega-6/omega-3 essential fatty acids
Simopoulos, A. P. (2002) · Biomedicine & Pharmacotherapy · doi:10.1016/s0753-3322(02)00253-6 · Cited by 4,131
Obesity and cardiovascular disease: a scientific statement from the American Heart Association
Powell-Wiley, T. M., Poirier, P., Burke, L. E., Després, J.-P., Gordon-Larsen, P., Lavie, C. J., Lear, S. A., Ndumele, C. E., Neeland, I. J., Sanders, P., et al. (2021) · Circulation · doi:10.1161/cir.0000000000000973 · Cited by 3,691
A new predictive equation for resting energy expenditure in healthy individuals
Mifflin, M., St Jeor, S., Hill, L., Scott, B., Daugherty, S., & Koh, Y. (1990) · The American Journal of Clinical Nutrition · doi:10.1093/ajcn/51.2.241 · Cited by 2,544
Nutrition and Athletic Performance
(2016) · Medicine & Science in Sports & Exercise · doi:10.1249/mss.0000000000000852 · Cited by 1,305
Djuricic, I., & Calder, P. C. (2021) · Nutrients · doi:10.3390/nu13072421 · Cited by 1,015
(2009) · Journal of the American Dietetic Association · doi:10.1016/j.jada.2009.01.005 · Cited by 912
Guidelines to classify subject groups in sport-science research
Pauw, K. D., Roelands, B., Cheung, S. S., de Geus, B., Rietjens, G., & Meeusen, R. (2013) · International Journal of Sports Physiology and Performance · doi:10.1123/ijspp.8.2.111 · Cited by 680
Clark, A., & Mach, N. (2016) · Journal of the International Society of Sports Nutrition · doi:10.1186/s12970-016-0155-6 · Cited by 583 · cited 1×
“…is, most athletes met the DRI AI for daily fiber intake (M 71.4% and F 75.0%), a critical nutrient for gastrointestinal health including gut microbiota composition and function [48], and microbial by-products (e.g. short chain fatty acids) that can subsequently impact athletic performance [49, 50].”
InfluentialLeucine Regulates Translation Initiation of Protein Synthesis in Skeletal Muscle after Exercise
Norton, L. E., & Layman, D. K. (2006) · The Journal of Nutrition · doi:10.1093/jn/136.2.533s · Cited by 333
Research works printed but not linked: 7
- Fink H. H., 2021, Chapter 12: Endurance and Ultra‐Endurance Athletes in Practical Applications in Sports Nutrition, Sixth Edition, 333
- 2025, Nutrition and Healthy Eating
- National Institutes of Health, 2024, Dietary Supplements, Multivitamin/Mineral Supplements
- Health Canada, 2012, Food and Nutrition Surveillance
- Barkell J. F., 2022, The Effects of a Low Carb High Fat or Ketogenic Diet on Athletic Performance, Journal of Physical Fitness, Medicine & Treatment in Sports, 9
- McCubbin A. J., 2025, Sodium Intake for Athletes Before, During and After Exercise: Review and Recommendations, Performance Nutrition, 1
- Mccubbin A. J., 2018, Impact of Sodium Ingestion During Exercise on Endurance Performance: A Systematic Review, International Journal of Sports Science, 8, 97
Cited by
Still being checked.
Metadata
- Authors
- Ghomeshi, B., McPhee, L., Morello, O., Ismail, M., Kebbe, M., & Totosy de Zepetnek, J. O.
- Affiliations
- Flinders University (AU)
- University of Regina (CA)
- Toronto Metropolitan University (CA)
- Western University (CA)
- University of New Brunswick (CA)
- Faculty of Kinesiology and Health Studies University of Regina Saskatchewan Canada
- ORCID
- Venue
- Journal of Human Nutrition and Dietetics
- Publisher
- Wiley
- Published
- 2025-12
- Volume
- 38
- Issue
- 6
- Pages
- e70182-e70182
- ISSN
- 0952-3871 (ISSN-L)
- 1365-277X
- PMC
- PMC12740459
- OpenAlex
- W7117323565
- Cited by
- 0
- References
- 60
- FWCI
- 0.00
- Type
- journal article
- Language
- en
- Open access
- hybrid
- doi.org
- Licence
- cc-by
- creativecommons.org/licenses/by/4.0/ (vor, 24 d)
- doi.wiley.com/10.1002/tdm_license_1.1 (tdm)
- Locations
- Journal of Human Nutrition and Dietetics (publishedVersion, cc-by)
- PubMed Central (publishedVersion, cc-by)
- PubMed (publishedVersion)
- Topics
- Health Sciences › Medicine › Public Health, Environmental and Occupational Health › Nutrition and Health Studies
- Health Sciences › Nursing › Nutrition and Dietetics › Nutrition, Health and Food Behavior
- Health Sciences › Nursing › Nutrition and Dietetics › Muscle metabolism and nutrition
- Keywords
- dietary intake, middle-aged athletes, endurance athletes, sex differences, micronutrient intake, macronutrient intake, vitamin D, vitamin E, potassium, calcium, magnesium, sodium intake, dietary supplementation, healthy aging
- MeSH terms
- Adult, Energy Intake, Canada, Diet, Dietary Proteins, Female, Humans, Male, Middle Aged, Physical Endurance, Sex Factors, Diet Records, Nutrition Policy, Athletes, Sports Nutritional Physiological Phenomena, Recommended Dietary Allowances
About these checks
Registry, retraction, Cites and statistics results are computed, not judged, with one exception: a printed reference that no index lists is read once by a model before it counts as a citation error. Claims are extracted by a model and kept only when their quote appears verbatim in the text; each cited source is then checked, with a model’s help, for whether it says what the claim relies on. Those verdicts can be wrong — read the claim’s quote and the cited source before relying on one.
A language model drew the claims from the paper on 2026-11-14, under version 3 of the claim definition (model deepseek-v4.1-flash, prompt extract-v3).
A second model labelled each claim on 2026-11-14 (model jev-1.13-20260917, definition revision gold-guideline-v0.2).
Statistics and arithmetic are recomputed, not judged.
Confidence bands are shown only for fields calibrated on our annotated test set. None is calibrated yet, so no band is shown.
What counts as a claim ›How we measure confidence ›How we check this ›
Are you an author, or do you see a problem with this page? Request a review
How to cite
Cite CoChat for the checks on this page, and the paper for its own findings.
- This page
- CoChat. (2026). Citation check: Dietary Intake of Canadian Middle‐Aged Endurance Athletes. https://app.cochat.ai/papers/10.1111/jhn.70182
- The paper
- Ghomeshi, B., McPhee, L., Morello, O., Ismail, M., Kebbe, M., & Totosy de Zepetnek, J. O. (2025). Dietary Intake of Canadian Middle‐Aged Endurance Athletes. Journal of Human Nutrition and Dietetics. https://doi.org/10.1111/jhn.70182
Data sources
Bibliographic data: Semantic Scholar, OpenAlex, Crossref.
Contains information from the Semantic Scholar Academic Graph Datasets, made available under the ODC Attribution License (ODC-BY 1.0).
Semantic Scholar’s data is described in: Kinney, R., et al. (2023). The Semantic Scholar Open Data Platform. arXiv:2301.10140.
