

The DOI matches its Crossref record; 62 of the 62 references it cites were found in a registry or an index.
Mitochondrial and lysosomal biogenesis are activated following PINK 1/parkin‐mediated mitophagy
Open accessAbstract
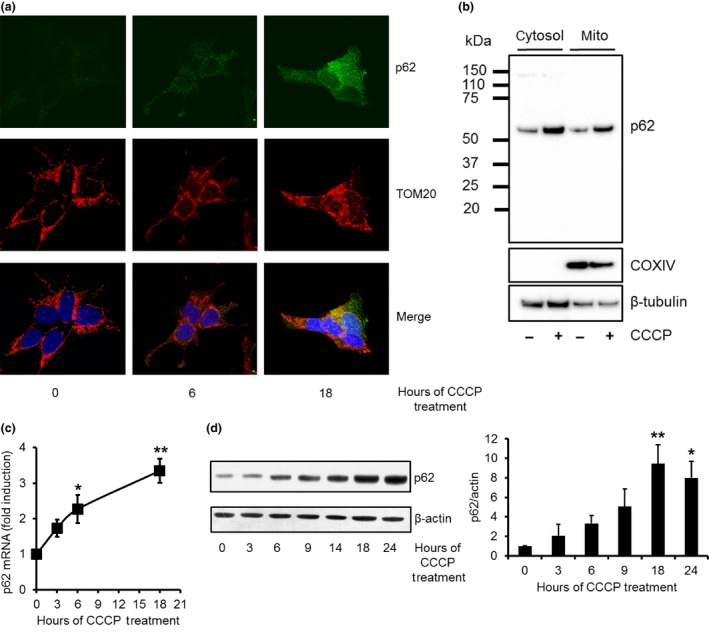
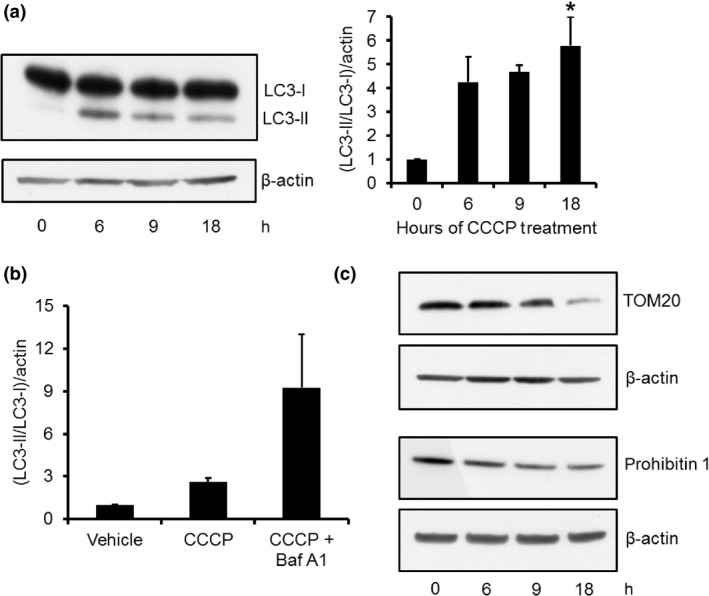
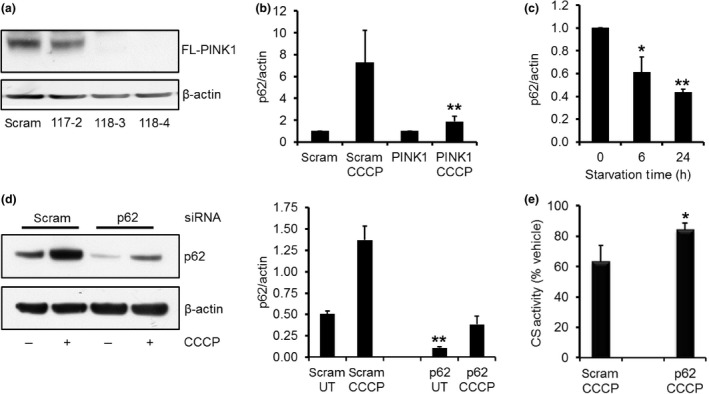
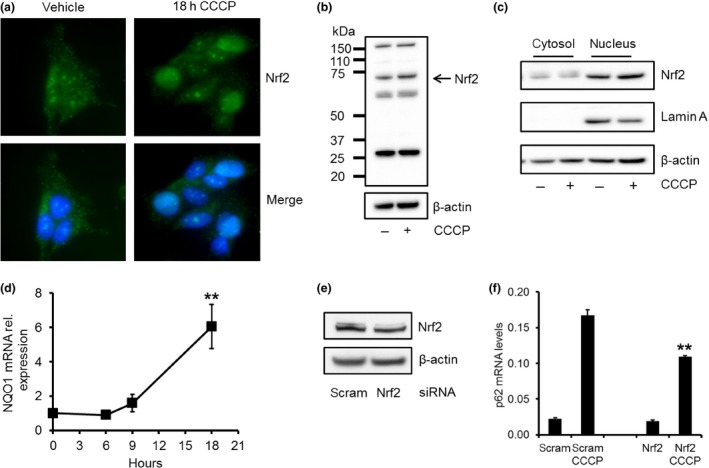
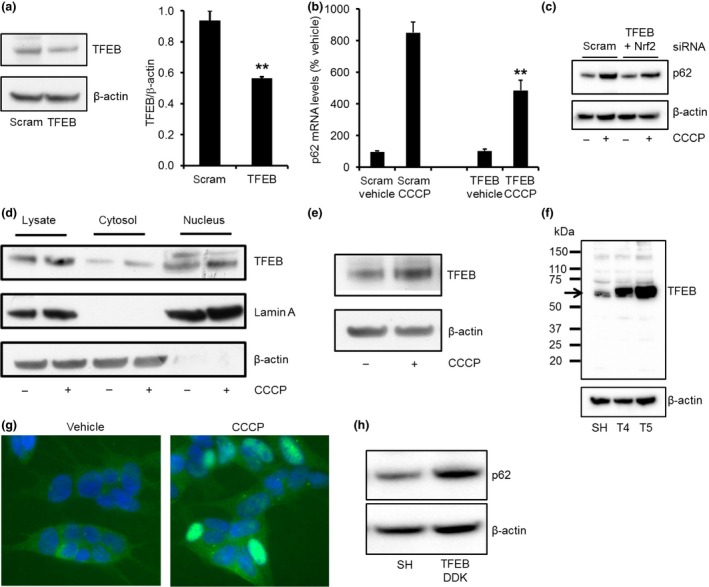
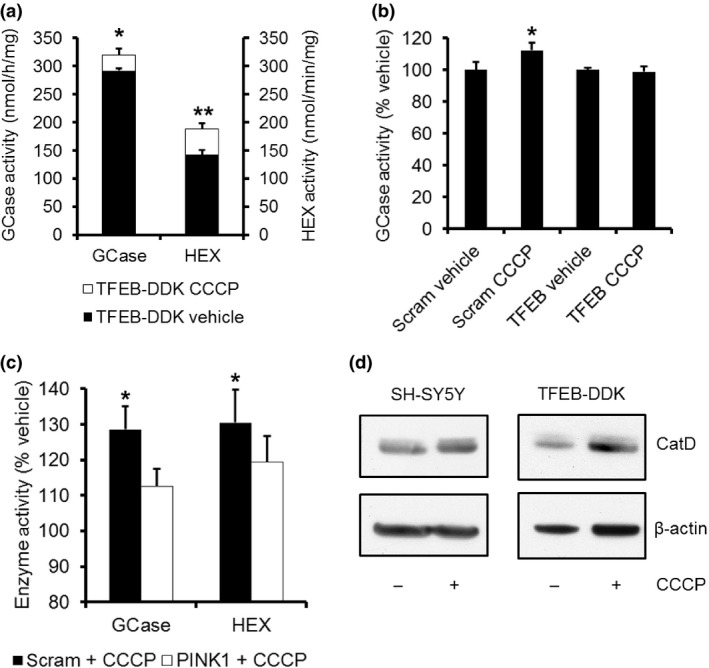
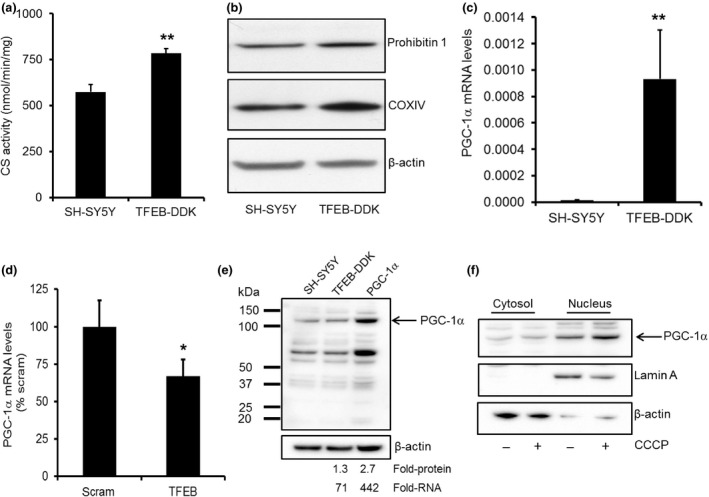
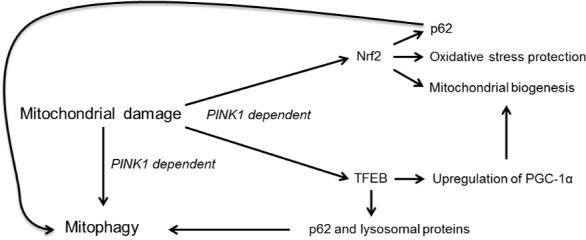
Impairment of the autophagy-lysosome pathway is implicated with the changes in α-synuclein and mitochondrial dysfunction observed in Parkinson's disease (PD). Damaged mitochondria accumulate PINK1, which then recruits parkin, resulting in ubiquitination of mitochondrial proteins. These can then be bound by the autophagic proteins p62/SQSTM1 and LC3, resulting in degradation of mitochondria by mitophagy. Mutations in PINK1 and parkin genes are a cause of familial PD. We found a significant increase in the expression of p62/SQSTM1 mRNA and protein following mitophagy induction in human neuroblastoma SH-SY5Y cells. p62 protein not only accumulated on mitochondria, but was also greatly increased in the cytosol. Increased p62/SQSMT1 expression was prevented in PINK1 knock-down cells, suggesting increased p62 expression was a consequence of mitophagy induction. The transcription factors Nrf2 and TFEB, which play roles in mitochondrial and lysosomal biogenesis, respectively, can regulate p62/SQSMT1. We report that both Nrf2 and TFEB translocate to the nucleus following mitophagy induction and that the increase in p62 mRNA levels was significantly impaired in cells with Nrf2 or TFEB knockdown. TFEB translocation also increased expression of itself and lysosomal proteins such as glucocerebrosidase and cathepsin D following mitophagy induction. We also report that cells with increased TFEB protein have significantly higher PGC-1α mRNA levels, a regulator of mitochondrial biogenesis, resulting in increased mitochondrial content. Our data suggests that TFEB is activated following mitophagy to maintain autophagy-lysosome pathway and mitochondrial biogenesis. Therefore, strategies to increase TFEB may improve both the clearance of α-synuclein and mitochondrial dysfunction in PD. Damaged mitochondria are degraded by the autophagy-lysosome pathway and is termed mitophagy. Following mitophagy induction, the transcription factors Nrf2 and TFEB translocate to the nucleus, inducing the transcription of genes encoding for autophagic proteins such as p62, as well as lysosomal and mitochondrial proteins. We propose that these events maintain autophagic flux, replenish lysosomes and replace mitochondria.
Overview
The claims and statistics of this paper haven’t been checked yet.
Run the check — free, no account needed. It reads the open-access text and checks the sources it cites.
Integrity signals
Registry
Cites
Statistics
Figures
Verification
Claims the paper makes
The claims and statistics of this paper haven’t been checked yet.
Run the check — free, no account needed. It reads the open-access text and checks the sources it cites.
Claims other papers make about this one
Each is checked against this paper’s own text: does it say what the citing paper says it does?
In the citing paper
“As expected, shortly after mitophagy initiation by CCCP, the transcription factors Nrf2 (Nuclear factor erythroid 2-related factor 2) and TFEB are both translocated to the nucleus [132].”
From Mitochondrial Uncoupling: A Key Controller of Biological Processes in Physiology and Diseases (2019) · cites this paper as [132]
Self-check
Percentages, sums and reported differences re-computed from the paper’s own numbers.
The self-check needs the paper’s full text.
Citations
Cites
Repertoires of Autophagy in the Pathogenesis of Ocular Diseases
Li, Y., Jiang, Q. L., Cao, G.-F., Yao, J., & Yan, B. (2015) · Cellular Physiology and Biochemistry · doi:10.1159/000373980 · Cited by 16,351
Mutations in the parkin gene cause autosomal recessive juvenile parkinsonism
Kitada, T., Asakawa, S., Hattori, N., Matsumine, H., Yamamura, Y., Minoshima, S., Yokochi, M., Mizuno, Y., & Shimizu, N. (1998) · Nature · doi:10.1038/33416 · Cited by 5,227
Cui, C., Cui, J., Jin, F., Cui, Y., Li, R., Jiang, X., Tian, Y., Wang, R. C., Jiang, P., & Gao, J. (2017) · Cellular Physiology and Biochemistry · doi:10.1159/000479571 · Cited by 5,214
Parkin is recruited selectively to impaired mitochondria and promotes their autophagy
Narendra, D., Tanaka, A., Suen, D.-F., & Youle, R. J. (2008) · The Journal of Cell Biology · doi:10.1083/jcb.200809125 · Cited by 4,026
Hereditary Early-Onset Parkinson's Disease Caused by Mutations in PINK1
Valente, E. M., Abou-Sleiman, P. M., Caputo, V., Muqit, M. M. K., Harvey, K., Gispert, S., Ali, Z., Del Turco, D., Bentivoglio, A. R., Healy, D. G., et al. (2004) · Science · doi:10.1126/science.1096284 · Cited by 3,481
PINK1 Is Selectively Stabilized on Impaired Mitochondria to Activate Parkin
Narendra, D. P., Jin, S. M., Tanaka, A., Suen, D.-F., Gautier, C. A., Shen, J., Cookson, M. R., & Youle, R. J. (2010) · PLoS Biology · doi:10.1371/journal.pbio.1000298 · Cited by 2,944
PINK1/Parkin-mediated mitophagy is dependent on VDAC1 and p62/SQSTM1
Geisler, S., Holmström, K. M., Skujat, D., Fiesel, F. C., Rothfuss, O. C., Kahle, P. J., & Springer, W. (2010) · Nature Cell Biology · doi:10.1038/ncb2012 · Cited by 2,835
A Gene Network Regulating Lysosomal Biogenesis and Function
Sardiello, M., Palmieri, M., di Ronza, A., Medina, D. L., Valenza, M., Gennarino, V. A., Di Malta, C., Donaudy, F., Embrione, V., Polishchuk, R. S., et al. (2009) · Science · doi:10.1126/science.1174447 · Cited by 2,543
Multicenter Analysis of Glucocerebrosidase Mutations in Parkinson's Disease
Sidransky, E., Nalls, M. A., Aasly, J. O., Aharon-Peretz, J., Annesi, G., Barbosa, E. R., Bar-Shira, A., Berg, D., Bras, J., Brice, A., et al. (2009) · New England Journal of Medicine · doi:10.1056/nejmoa0901281 · Cited by 2,135
The role of autophagy in neurodegenerative disease
Nixon, R. A. (2013) · Nature Medicine · doi:10.1038/nm.3232 · Cited by 2,059
Cited by
Sorted by citations
The mitophagy pathway and its implications in human diseases
Wang, S., Long, H., Hou, L., Feng, B., Ma, Z., Wu, Y., Zeng, Y., Cai, J., Zhang, D., & Zhao, G. (2023) · Signal Transduction and Targeted Therapy · doi:10.1038/s41392-023-01503-7 · Cited by 959
Deciphering the Molecular Signals of PINK1/Parkin Mitophagy
Nguyen, T. N., Padman, B. S., & Lazarou, M. (2016) · Trends in Cell Biology · doi:10.1016/j.tcb.2016.05.008 · Cited by 749
Gureev, A. P., Shaforostova, E. A., & Popov, V. N. (2019) · Frontiers in Genetics · doi:10.3389/fgene.2019.00435 · Cited by 663
Moldogazieva, N. T., Mokhosoev, I. M., Melnikova, T. I., Porozov, Y. B., & Terentiev, A. A. (2019) · Oxidative Medicine and Cellular Longevity · doi:10.1155/2019/3085756 · Cited by 510
Mitochondrial Uncoupling: A Key Controller of Biological Processes in Physiology and Diseases
Demine, S., Renard, P., & Arnould, T. (2019) · Cells · doi:10.3390/cells8080795 · Cited by 476
Yao, R.-Q., Ren, C., Xia, Z.-F., & Yao, Y.-M. (2021) · Autophagy · doi:10.1080/15548627.2020.1725377 · Cited by 441
Beclin-1-Dependent Autophagy Protects the Heart During Sepsis
Sun, Y., Yao, X., Zhang, Q.-J., Zhu, M., Liu, Z.-P., Ci, B., Xie, Y., Carlson, D., Rothermel, B. A., Sun, Y., et al. (2018) · Circulation · doi:10.1161/circulationaha.117.032821 · Cited by 381
Mechanisms of mitophagy: PINK1, Parkin, USP30 and beyond
Bingol, B., & Sheng, M. (2016) · Free Radical Biology and Medicine · doi:10.1016/j.freeradbiomed.2016.04.015 · Cited by 338
The Role of Autophagy and Mitophagy in Bone Metabolic Disorders
Wang, S., Deng, Z., Ma, Y., Jin, J., Qi, F., Li, S., Liu, C., Lyu, F., & Zheng, Q. (2020) · International Journal of Biological Sciences · doi:10.7150/ijbs.46627 · Cited by 333
Crosstalk between mitochondrial biogenesis and mitophagy to maintain mitochondrial homeostasis
Liu, L., Li, Y., Chen, G., & Chen, Q. (2023) · Journal of Biomedical Science · doi:10.1186/s12929-023-00975-7 · Cited by 309
Mitochondria–Lysosome Crosstalk: From Physiology to Neurodegeneration
Deus, C. M., Yambire, K. F., Oliveira, P. J., & Raimundo, N. (2019) · Trends in Molecular Medicine · doi:10.1016/j.molmed.2019.10.009 · Cited by 296
Autophagy and mitophagy in cancer metabolic remodelling
Ferro, F., Servais, S., Besson, P., Roger, S., Dumas, J., & Brisson, L. (2019) · Seminars in Cell and Developmental Biology · doi:10.1016/j.semcdb.2019.05.029 · Cited by 288
Sarkar, S., Malovic, E., Harischandra, D. S., Ghaisas, S., Panicker, N., Charli, A., Palanisamy, B. N., Rokad, D., Jin, H., Anantharam, V., et al. (2017) · npj Parkinson s Disease · doi:10.1038/s41531-017-0032-2 · Cited by 288
p62/SQSTM1 – steering the cell through health and disease
Sánchez‐Martín, P., & Komatsu, M. (2018) · Journal of Cell Science · doi:10.1242/jcs.222836 · Cited by 287
Mai, C.-T., Wu, M., Wang, C., Su, Z., Cheng, Y., & Zhang, X. (2018) · Molecular Immunology · doi:10.1016/j.molimm.2018.10.015 · Cited by 197
SQSTM1/p62 and PPARGC1A/PGC-1alpha at the interface of autophagy and vascular senescence
Salazar, G., Cullen, A. E., Huang, J., Zhao, Y., Serino, A., Hilenski, L. L., Patrushev, N. A., Forouzandeh, F., & Hwang, H. S. (2019) · Autophagy · doi:10.1080/15548627.2019.1659612 · Cited by 185
Sánchez-Martínez, Á., Beavan, M. S., Gegg, M. E., Chau, K., Whitworth, A. J., & Schapira, A. H. V. (2016) · Scientific Reports · doi:10.1038/srep31380 · Cited by 162
Self-citationMitophAging: Mitophagy in Aging and Disease
Bakula, D., & Scheibye‐Knudsen, M. (2020) · Frontiers in Cell and Developmental Biology · doi:10.3389/fcell.2020.00239 · Cited by 151
Mitochondrial Dysfunction and Parkinson’s Disease: Pathogenesis and Therapeutic Strategies
Vastegani, S. M., Nasrolahi, A., Ghaderi, S., Belali, R., Rashno, M., Farzaneh, M., & Khoshnam, S. E. (2023) · Neurochemical Research · doi:10.1007/s11064-023-03904-0 · Cited by 145
Mitochondrial Involvement in Cisplatin Resistance
Cocetta, V., Ragazzi, E., & Montopoli, M. (2019) · International Journal of Molecular Sciences · doi:10.3390/ijms20143384 · Cited by 145
Hong, C.-T., Chen, K.-Y., Wang, W., Chiu, J.-Y., Wu, D., Chao, T.-Y., Hu, C.-J., Chau, K.-Y., & Bamodu, O. (2020) · Cells · doi:10.3390/cells9030740 · Cited by 133
Self-citationTubular Mitochondrial Dysfunction, Oxidative Stress, and Progression of Chronic Kidney Disease
Fontecha‐Barriuso, M., López-Diaz, A. M., Guerrero‐Mauvecin, J., Miguel, V., Ramos, A. M., Sánchez-Niño, M. D., Ruiz‐Ortega, M., Ortíz, A., & Sanz, A. B. (2022) · Antioxidants · doi:10.3390/antiox11071356 · Cited by 132
Gastrointestinal Dysfunctions in Parkinson’s Disease: Symptoms and Treatments
Poirier, A.-A., Aubé, B., Côté, M., Morin, N., Di Paolo, T., & Soulet, D. (2016) · Parkinson s Disease · doi:10.1155/2016/6762528 · Cited by 130
Klotho, Oxidative Stress, and Mitochondrial Damage in Kidney Disease
Donate‐Correa, J., Martín-Carro, B., Cannata-Andía, J. B., Fernández, C. M., & Navarro‐González, J. F. (2023) · Antioxidants · doi:10.3390/antiox12020239 · Cited by 137
From autophagy to mitophagy: the roles of P62 in neurodegenerative diseases
Liu, H., Dai, C., Fan, Y., Guo, B., Ren, K., Sun, T., & Wang, W. (2017) · Journal of Bioenergetics and Biomembranes · doi:10.1007/s10863-017-9727-7 · Cited by 128
Mitochondria, lysosomes, and dysfunction: their meaning in neurodegeneration
Audano, M., Schneider, A., & Mitro, N. (2018) · Journal of Neurochemistry · doi:10.1111/jnc.14471 · Cited by 118
Arribat, Y., Broskey, N. T., Greggio, C., Boutant, M., Conde Alonso, S., Kulkarni, S. S., Lagarrigue, S., Carnero, E. A., Besson, C., Cantó, C., et al. (2019) · Acta Physiologica · doi:10.1111/apha.13179 · Cited by 112
Exercise induces TFEB expression and activity in skeletal muscle in a PGC-1α-dependent manner
Erlich, A. T., Brownlee, D., Beyfuss, K. A., & Hood, D. A. (2017) · American Journal of Physiology-Cell Physiology · doi:10.1152/ajpcell.00162.2017 · Cited by 112
Current mechanistic insights into the CCCP-induced cell survival response
Kane, M. S., Paris, A., Codron, P., Cassereau, J., Procaccio, V., Lenaers, G., Reynier, P., & Chevrollier, A. (2017) · Biochemical Pharmacology · doi:10.1016/j.bcp.2017.12.018 · Cited by 112
Mechanisms of Mitochondrial Dysfunction in Lysosomal Storage Disorders: A Review
Stępień, K. M., Roncaroli, F., Turton, N., Hendriksz, C. J., Roberts, M., Heaton, R. A., & Hargreaves, I. P. (2020) · Journal of Clinical Medicine · doi:10.3390/jcm9082596 · Cited by 108
Mitochondrial metabolism and targeted treatment strategies in ischemic-induced acute kidney injury
Chen, Y., Li, Z., Zhang, H., Chen, H.-X., Hao, J., Liu, H.-F., & Li, X. (2024) · Cell Death Discovery · doi:10.1038/s41420-024-01843-5 · Cited by 106
ISG15 governs mitochondrial function in macrophages following vaccinia virus infection
Baldanta, S., Fernández‐Escobar, M., Acín‐Pérez, R., Albert, M., Camafeita, E., Jorge, I., Vázquez, J., Enrı́quez, J. A., & Guerra, S. (2017) · PLoS Pathogens · doi:10.1371/journal.ppat.1006651 · Cited by 109
How to get rid of mitochondria: crosstalk and regulation of multiple mitophagy pathways
Zimmermann, M., & Reichert, A. S. (2017) · Biological Chemistry · doi:10.1515/hsz-2017-0206 · Cited by 103
Fernández-Mosquera, L., Diogo, C. V., Yambire, K. F., Santos, G. L., Luna‐Sánchez, M., Bénit, P., Rustin, P., López, L. C., Milošević, I., & Raimundo, N. (2017) · Scientific Reports · doi:10.1038/srep45076 · Cited by 96
The NRF2/KEAP1 Axis in the Regulation of Tumor Metabolism: Mechanisms and Therapeutic Perspectives
Panieri, E., Telkoparan‐Akillilar, P., Süzen, S., & Saso, L. (2020) · Biomolecules · doi:10.3390/biom10050791 · Cited by 101
Effects of ambroxol on the autophagy-lysosome pathway and mitochondria in primary cortical neurons
Magalhães, J., Gegg, M. E., Migdalska‐Richards, A., & Schapira, A. H. V. (2018) · Scientific Reports · doi:10.1038/s41598-018-19479-8 · Cited by 94
Self-citationEmerging roles and regulation of MiT/TFE transcriptional factors
Yang, M., Liu, E., Tang, L., Lei, Y., Sun, X., Hu, J., Dong, H., Yang, S., Gao, M., & Tang, B. (2018) · Cell Communication and Signaling · doi:10.1186/s12964-018-0242-1 · Cited by 92
Cathepsin D—Managing the Delicate Balance
Mijanović, O., Petushkova, A. I., Branković, A., Turk, B., Solovieva, A. B., Nikitkina, A. I., Bolevich, S., Timashev, P. S., Parodi, A., & Zamyatnin, A. A. (2021) · Pharmaceutics · doi:10.3390/pharmaceutics13060837 · Cited by 94
Involvement of PINK1/parkin-mediated mitophagy in ZnO nanoparticle-induced toxicity in BV-2 cells
Wei, L., Wang, J., Chen, A., Liu, J., Feng, X., & Shao, L. (2017) · International Journal of Nanomedicine · doi:10.2147/ijn.s129375 · Cited by 83
Mitochondrial quality control in AMD: does mitophagy play a pivotal role?
Hyttinen, J. M. T., Viiri, J., Kaarniranta, K., & Błasiak, J. (2018) · Cellular and Molecular Life Sciences · doi:10.1007/s00018-018-2843-7 · Cited by 80
Packer, M. (2020) · European Heart Journal · doi:10.1093/eurheartj/ehaa360 · Cited by 78
Hederagenin improves Alzheimer's disease through PPARα/TFEB-mediated autophagy
Xie, Z.-S., Zhao, J.-P., Wu, L.-M., Chu, S., Cui, Z.-H., Sun, Y.-R., Wang, H., Ma, H.-F., Ma, D.-R., Wang, P., et al. (2023) · Phytomedicine · doi:10.1016/j.phymed.2023.154711 · Cited by 77
Zhao, X., Wang, Z., Wang, L., Jiang, T., Dong, D., & Sun, M. (2024) · Pharmacological Research · doi:10.1016/j.phrs.2024.107466 · Cited by 76
Target acquired: Selective autophagy in cardiometabolic disease
Evans, T. D., Sergin, I., Zhang, X., & Razani, B. (2017) · Science Signaling · doi:10.1126/scisignal.aag2298 · Cited by 74
Li, H., Qin, S., Liang, Q., Xi, Y., Bo, W., Cai, M., & Tian, Z. (2021) · Biomedicines · doi:10.3390/biomedicines9060701 · Cited by 73
Glucocerebrosidase-associated Parkinson disease: Pathogenic mechanisms and potential drug treatments
Gegg, M. E., Menozzi, E., & Schapira, A. H. V. (2022) · Neurobiology of Disease · doi:10.1016/j.nbd.2022.105663 · Cited by 72
Self-citationMechanism of Mitophagy and Its Role in Sepsis Induced Organ Dysfunction: A Review
Zhu, C., Yao, R.-Q., Li, L.-X., Li, P., Xie, J., Wang, J., & Deng, X. (2021) · Frontiers in Cell and Developmental Biology · doi:10.3389/fcell.2021.664896 · Cited by 68
Tian, L., Li, N., Li, K., Tan, Y., Han, J., Lin, B., Lai, W., Liu, H., Shi, Y., Xi, Z., et al. (2022) · Ecotoxicology and Environmental Safety · doi:10.1016/j.ecoenv.2022.113663 · Cited by 68
Nahapetyan, H., Moulis, M., Grousset, E., Faccini, J., Grazide, M.-H., Mucher, E., Elbaz, M., Martinet, W., & Vindis, C. (2019) · Cell Death and Disease · doi:10.1038/s41419-019-1400-0 · Cited by 70
Sun, Y., Cai, Y., & Zang, Q. S. (2019) · Cells · doi:10.3390/cells8020141 · Cited by 69
Elorza, Á. A., & Soffia, J. P. (2021) · Frontiers in Cell and Developmental Biology · doi:10.3389/fcell.2021.625020 · Cited by 64
Rescue of Pink1 Deficiency by Stress-Dependent Activation of Autophagy
Zhang, Y., Nguyen, D. T., Olzomer, E. M., Poon, G. P., Cole, N. J., Puvanendran, A., Phillips, B. R., & Hesselson, D. (2017) · Cell chemical biology · doi:10.1016/j.chembiol.2017.03.005 · Cited by 64
Pomegranate activates TFEB to promote autophagy-lysosomal fitness and mitophagy
Tan, S., Yu, C. Y., Sim, Z. W., Low, Z. S., Lee, B., See, F., Min, N., Gautam, A. S., Chu, J. J. H., Ng, K. W., et al. (2019) · Scientific Reports · doi:10.1038/s41598-018-37400-1 · Cited by 65
Emerging role of transcription factor EB in mitochondrial quality control
Wang, S., Chen, Y., Li, X., Zhang, W., Liu, Z., Wu, M., Pan, Q., & Liu, H. (2020) · Biomedicine & Pharmacotherapy · doi:10.1016/j.biopha.2020.110272 · Cited by 64
Wu, M., Lu, G. X., Lao, Y., Zhang, H., Zheng, D., Zheng, Z., Yi, J., Xiang, Q., Wang, L., Tan, H., et al. (2020) · Acta Pharmacologica Sinica · doi:10.1038/s41401-020-0480-9 · Cited by 62
Liao, J., He, W., Li, L., Wang, J., Gong, L., Zhang, Q., & Lin, Z. (2025) · Cell Biomaterials · doi:10.1016/j.celbio.2025.100016 · Cited by 63
Phillipson, O. T. (2017) · Ageing Research Reviews · doi:10.1016/j.arr.2017.09.006 · Cited by 60
TFEB is a central regulator of the aging process and age-related diseases
Abokyi, S., Ghartey‐Kwansah, G., & Tse, D. Y. (2023) · Ageing Research Reviews · doi:10.1016/j.arr.2023.101985 · Cited by 61
Sequestosome 1/p62: A multitasker in the regulation of malignant tumor aggression (Review)
Tang, J., Li, Y., Xia, S., Li, J., Yang, Q., Ding, K., & Zhang, H. (2021) · International Journal of Oncology · doi:10.3892/ijo.2021.5257 · Cited by 56
The Role and Regulatory Mechanism of Transcription Factor EB in Health and Diseases
Zhu, S., Yao, R.-Q., Li, Y., Zhao, P., Ren, C., Du, X., & Yao, Y.-M. (2021) · Frontiers in Cell and Developmental Biology · doi:10.3389/fcell.2021.667750 · Cited by 56
Devi, T. S., Yumnamcha, T., Yao, F., Somayajulu, M., Kowluru, R. A., & Singh, L. P. (2019) · Biology Open · doi:10.1242/bio.038521 · Cited by 58
Coordinated Action of miR-146a and Parkin Gene Regulate Rotenone-induced Neurodegeneration
Jauhari, A., Singh, T., Mishra, S., Shankar, J., & Yadav, S. (2020) · Toxicological Sciences · doi:10.1093/toxsci/kfaa066 · Cited by 56
Han, X., Wang, J., Li, R., Huang, M., Yue, G., Guan, L., Deng, Y., Cai, W., & Xu, J. (2023) · International Journal of Molecular Sciences · doi:10.3390/ijms24054696 · Cited by 55
Molecular mechanisms of mitochondrial quality control
Li, W., Gui, Y., Guo, C., Huang, Y.-T., Liu, Y., Yu, X., Zhang, H., Wang, J., Liu, R., Mahaman, Y. A. R., et al. (2025) · Translational Neurodegeneration · doi:10.1186/s40035-025-00505-5 · Cited by 57
Mitochondrial adventures at the organelle society
Diogo, C. V., Yambire, K. F., Fernández-Mosquera, L., Fonseca, T. B., & Raimundo, N. (2017) · Biochemical and Biophysical Research Communications · doi:10.1016/j.bbrc.2017.04.124 · Cited by 55
From mitochondria to sarcopenia: role of 17β-estradiol and testosterone
Tian, X., Lou, S., & Shi, R. (2023) · Frontiers in Endocrinology · doi:10.3389/fendo.2023.1156583 · Cited by 54
“This process is regulated by some proteins, among which the PTENinduced putative kinase 1 (PINK1) and E3-ubiquitin ligase Parkinson juvenile disease protein 2 (PARK2) are served to recognize damaged mitochondria and localize them to the autophagosome, which then fuses with lysosomes to form autophagolysosomes (35, 36).”
BackgroundMao, Y., Du, J., Chen, X., Mamun, A. A., Cao, L., Yang, Y., Mubwandarikwa, J., Zaeem, M., Zhang, W., Chen, Y., et al. (2022) · Oxidative Medicine and Cellular Longevity · doi:10.1155/2022/1337630 · Cited by 53
Qin, C., Wang, Y., Zhao, B., Li, Z., Li, T., Yang, X., Zhao, Y., & Wang, W. (2023) · Cell Death and Disease · doi:10.1038/s41419-023-05711-5 · Cited by 55
NRF2 Activation and Downstream Effects: Focus on Parkinson’s Disease and Brain Angiotensin
Parga, J. A., Rodriguez-Perez, A. I., García-Garrote, M., Rodríguez‐Pallares, J., & Labandeira-García, J. L. (2021) · Antioxidants · doi:10.3390/antiox10111649 · Cited by 56
Mechanisms of communication between mitochondria and lysosomes
Raimundo, N., Fernández-Mosquera, L., Yambire, K. F., & Diogo, C. V. (2016) · The International Journal of Biochemistry & Cell Biology · doi:10.1016/j.biocel.2016.08.020 · Cited by 52
Mitophagy Transcriptome: Mechanistic Insights into Polyphenol‐Mediated Mitophagy
Tan, S., & Wong, E. S. P. (2017) · Oxidative Medicine and Cellular Longevity · doi:10.1155/2017/9028435 · Cited by 47
Pyrroloquinoline Quinone Inhibits Rotenone-Induced Microglia Inflammation by Enhancing Autophagy
Zhang, Q., Zhou, J., Shen, M., Xu, H., Yu, S., Cheng, Q., & Ding, F. (2020) · Molecules · doi:10.3390/molecules25194359 · Cited by 47
Morris, G., Walder, K. R., Berk, M., Marx, W., Walker, A. J., Maes, M. H. J., & Puri, B. K. (2020) · Molecular Biology Reports · doi:10.1007/s11033-020-05590-5 · Cited by 47
Pereira, S. L., Großmann, D., Delcambre, S., Hermann, A., & Grünewald, A. (2023) · Current Opinion in Neurobiology · doi:10.1016/j.conb.2023.102720 · Cited by 48
Hou, J., Zhao, L., Tang, H., He, X., Ye, G., Shi, F., Kang, M., Chen, H., & Li, Y. (2021) · Biological Trace Element Research · doi:10.1007/s12011-020-02212-w · Cited by 45
González‐Casacuberta, I., Juárez‐Flores, D. L., Morén, C., & Garrabou, G. (2019) · Frontiers in Neuroscience · doi:10.3389/fnins.2019.00894 · Cited by 44
de Luna, N., Turon-Sans, J., Cortés‐Vicente, E., Carrasco‐Rozas, A., Illán‐Gala, I., Dols‐Icardo, O., Clarimón, J., Lleó, A., Gallardo, E., Illa, I., et al. (2020) · Scientific Reports · doi:10.1038/s41598-020-61246-1 · Cited by 43
Melatonin Represses Mitophagy to Protect Mouse Granulosa Cells from Oxidative Damage
Jiang, Y., Shen, M., Chen, Y., Wei, Y., Tao, J., & Liu, H. (2021) · Biomolecules · doi:10.3390/biom11070968 · Cited by 43
TFEB and TFE3: The art of multi-tasking under stress conditions
Martina, J. A., & Puertollano, R. (2016) · Transcription · doi:10.1080/21541264.2016.1264353 · Cited by 42
Hsp70 participates in PINK1-mediated mitophagy by regulating the stability of PINK1
Zheng, Q., Huang, C., Guo, J., Tan, J., Wang, C., Tang, B., & Zhang, H. (2017) · Neuroscience Letters · doi:10.1016/j.neulet.2017.10.051 · Cited by 42
Liu, S., Li, X., Zhang, S., Yang, Z., Wang, K., Lü, F., Wang, C., & Yuan, C. (2018) · Chinese Journal of Integrative Medicine · doi:10.1007/s11655-018-2935-5 · Cited by 41
Irisin at the crossroads of inter-organ communications: Challenge and implications
Zhao, R. (2022) · Frontiers in Endocrinology · doi:10.3389/fendo.2022.989135 · Cited by 40
Wang, F., Bai, J., Zhang, X., Wang, D., Zhang, X., Xue, J., Chen, H., Wang, S., Chi, B., Li, J., et al. (2023) · Journal of Diabetes Investigation · doi:10.1111/jdi.14113 · Cited by 40
Multimodal assessment of mitochondrial function in Parkinson's disease
Payne, T., Burgess, T., Bradley, S., Roscoe, S., Sassani, M., Dunning, M., Hernandez, D. G., Scholz, S. W., McNeill, A., Taylor, R. N., et al. (2023) · Brain · doi:10.1093/brain/awad364 · Cited by 39
Okarmus, J., Bogetofte, H., Schmidt, S. I., Ryding, M., García‐López, S., Ryan, B. J., Martı́nez-Serrano, A., Hyttel, P., & Meyer, M. (2020) · Scientific Reports · doi:10.1038/s41598-020-67091-6 · Cited by 40
Pathophysiology of diabetic kidney disease and autophagy: A review
Yu, J., Liu, Y., Li, H., & Zhang, P. (2023) · Medicine · doi:10.1097/md.0000000000033965 · Cited by 39
Duan, J., Huang, Z., Qin, S., Li, B., Zhang, Z., Liu, R., Wang, K., Nice, E. C., Jiang, J., & Huang, C. (2024) · Journal of Extracellular Vesicles · doi:10.1002/jev2.12468 · Cited by 38
Mitochondrial biology in airway pathogenesis and the role of NRF2
Cho, H., & Kleeberger, S. R. (2019) · Archives of Pharmacal Research · doi:10.1007/s12272-019-01182-5 · Cited by 39
Shi, X., Li, Y., Wang, Y., Ding, T., Zhang, X., & Wu, N. (2021) · Toxicology and Applied Pharmacology · doi:10.1016/j.taap.2021.115668 · Cited by 38
Deciphering therapeutic options for neurodegenerative diseases: insights from SIRT1
Wang, R., Wu, Y., Liu, R., Liu, M., Li, Q., Ba, Y., & Huang, H. (2022) · Journal of Molecular Medicine · doi:10.1007/s00109-022-02187-2 · Cited by 38
Gao, Y., Wang, C., Jiang, D. M., An, G., Jin, F. J., Zhang, J., Han, G., Cui, C., & Jiang, P. (2022) · Frontiers in Cell and Developmental Biology · doi:10.3389/fcell.2022.994037 · Cited by 37
Cheng, Y., Liu, M., Tang, H., Chen, B., Yang, G., Zhao, W., Cai, Y., & Shang, H. (2021) · Oxidative Medicine and Cellular Longevity · doi:10.1155/2021/6630281 · Cited by 36
Induction of Mitochondrial Fragmentation and Mitophagy after Neonatal Hypoxia–Ischemia
Nair, S., Leverin, A., Rocha‐Ferreira, E., Sobotka, K. S., Thornton, C., Mallard, C. E., & Hagberg, H. (2022) · Cells · doi:10.3390/cells11071193 · Cited by 35
Mitochondrial-based therapies for neurodegenerative diseases: a review of the current literature
Wadan, A. S., Shaaban, A., El-Sadek, M. Z., Mostafa, S. A., Moshref, A. S., El‐Hussein, A., Ellakwa, D. E., & Mehanny, S. (2025) · Naunyn-Schmiedeberg s Archives of Pharmacology · doi:10.1007/s00210-025-04014-0 · Cited by 38
SVIP alleviates CCl4-induced liver fibrosis via activating autophagy and protecting hepatocytes
Jia, D. T., Wang, Y. Y., Wang, P., Huang, Y., Wang, D., Wang, D., Zhang, C., Zhang, C., Guo, L., Liang, P., et al. (2019) · Cell Death and Disease · doi:10.1038/s41419-019-1311-0 · Cited by 35
Mitophagy: A potential therapeutic target for insulin resistance
Ning, P., Jiang, X., Yang, J., Zhang, J., Yang, F., & Cao, H. (2022) · Frontiers in Physiology · doi:10.3389/fphys.2022.957968 · Cited by 35
Lang, M., Pramstaller, P. P., & Pichler, I. (2022) · Molecular Neurodegeneration · doi:10.1186/s13024-022-00555-7 · Cited by 35
Zhang, Y., Dong, F., Wang, Z., Xu, B., Zhang, T., Wang, Q., & Lin, Q. (2022) · Biological Trace Element Research · doi:10.1007/s12011-022-03450-w · Cited by 34
Ji, H., Zhao, Y., Ma, X., Wu, L., Guo, F., Huang, F., Song, Y., Wang, J., & Qin, G. (2023) · Inflammation · doi:10.1007/s10753-023-01940-0 · Cited by 34
Mitophagy: A key regulator of radiotherapy resistance in the tumor immune microenvironment
Xia, J., Jin, J., Dai, S., Fan, H., Chen, K., Li, J., Luo, F., & Peng, X. (2025) · Molecular Aspects of Medicine · doi:10.1016/j.mam.2025.101385 · Cited by 34
Metadata
- Authors
- Ivankovic, D., Chau, K., Schapira, A. H. V., & Gegg, M. E.
- Affiliations
- UCL Queen Square Institute of Neurology (GB)
- Corresponding author
- Gegg, Matthew E.
- Venue
- Journal of Neurochemistry
- Publisher
- Wiley
- Published
- 2015-11-24
- Volume
- 136
- Issue
- 2
- Pages
- 388-402
- ISSN
- 0022-3042 (ISSN-L)
- 1471-4159
- PMC
- PMC4949652
- OpenAlex
- W1853148353
- Cited by
- 264
- References
- 62
- Citations by year
- 2026: 22 · 2025: 31 · 2024: 28 · 2023: 30 · 2022: 33 · 2021: 28 · 2020: 24 · 2019: 24 · 2018: 16 · 2017: 18 · 2016: 9
- FWCI
- 11.24
- Type
- journal article
- Language
- en
- Open access
- hybrid
- doi.org
- Licence
- Locations
- Journal of Neurochemistry (publishedVersion, cc-by)
- Europe PMC (PubMed Central) (publishedVersion, cc-by)
- PubMed Central (publishedVersion, cc-by)
- PubMed (publishedVersion)
- UCL Discovery (University College London) (submittedVersion)
- Funders
- Medical Research Council (MR/M006646/1)
- Topics
- Life Sciences › Biochemistry, Genetics and Molecular Biology › Cell Biology › Autophagy in Disease and Therapy
- Health Sciences › Medicine › Clinical Neurology › Parkinson's Disease Mechanisms and Treatments
- Life Sciences › Biochemistry, Genetics and Molecular Biology › Molecular Biology › Nuclear Receptors and Signaling
- Keywords
- mitophagy, PINK1, Parkin, autophagy-lysosome pathway, mitochondrial biogenesis, lysosomal biogenesis, p62, Nrf2, TFEB, PGC-1α, alpha-synuclein, Parkinson's disease, glucocerebrosidase, cathepsin D, mitochondrial dysfunction, SH-SY5Y cells
- MeSH terms
- Sequestosome-1 Protein, Mitochondrial Precursor Protein Import Complex Proteins, PTEN-Induced Putative Kinase, Carbonyl Cyanide m-Chlorophenyl Hydrazone, Cell Nucleolus, Cytosol, Gene Expression Regulation, Heat-Shock Proteins, Humans, Lysosomes, Mitochondria, Neuroblastoma, Protein Kinases, Receptors, Cell Surface, Time Factors, Transfection, Tubulin, Gene Expression Regulation, Neoplastic, Membrane Transport Proteins, RNA, Small Interfering, Ubiquitin-Protein Ligases, Cell Line, Tumor, Basic Helix-Loop-Helix Leucine Zipper Transcription Factors, Proton Ionophores, Mitophagy
About these checks
Registry, retraction, Cites and statistics results are computed, not judged, with one exception: a printed reference that no index lists is read once by a model before it counts as a citation error. Claims are extracted by a model and kept only when their quote appears verbatim in the text; each cited source is then checked, with a model’s help, for whether it says what the claim relies on. Those verdicts can be wrong — read the claim’s quote and the cited source before relying on one.
Statistics and arithmetic are recomputed, not judged.
Confidence bands are shown only for fields calibrated on our annotated test set. None is calibrated yet, so no band is shown.
What counts as a claim ›How we measure confidence ›How we check this ›
Are you an author, or do you see a problem with this page? Request a review
