Cited by 7Facial Rejuvenation and Surgery TechniquesSurgical Sutures and Adhesivesbiodegradable polymer synthesis and properties

The DOI matches its Crossref record; 24 of the 24 references it cites were found in a registry or an index.

Efficacy of Lifting Threads Composed of Poly(L‐Lactide‐Co‐ε‐Caprolactone) Copolymers Coated With Hyaluronic Acid: A Long‐Term Study on Biorevitalizing Properties in Skin Remodeling

Open access
Burko, Pavel, Sulamanidze, George, Nikishin, Dmitriy·2025·Journal of Cosmetic Dermatology

Abstract

Background: Facial thread lifting, which is popular in aesthetic medicine because of its minimal invasiveness, has led to advancements in the use of biodegradable polymers such as poly(L‐lactide‐co‐ε‐caprolactone) (P(LA/CL)) and its hyaluronic acid‐coated variant (P(LA/CL)‐HA). These developments enhance biocompatibility and efficacy, offering prolonged benefits through better biostimulation and tissue integration. Methods: A controlled experiment involving five 4‐month‐old female pigs compared the effectiveness of P(LA/CL) and P(LA/CL)‐HA threads over six months. After being implanted into the subcutaneous layer parallel to the skin of each pig, the threads were evaluated through histological analysis at intervals (7, 21, 30, 90, and 180 days) to assess changes in dermal and hypodermal structures, collagen types, elastin levels, and tissue integration via stains such as hematoxylin and eosin (H&E), Weigert‐Van Gieson, and Sirius Red. Results: P(LA/CL) and P(LA/CL)‐HA threads significantly led to dermal and hypodermal remodeling. By day 180, a comparative analysis via the Wilcoxon test revealed that P(LA/CL)‐HA significantly outperformed P(LA/CL) in most histological indicators because of the biostimulatory effects of hyaluronic acid. Conclusions: Our study investigated the effects of two types of bioabsorbable threads, P(LA/CL) and P(LA/CL)‐HA, on skin remodeling over 180 days in a porcine model. These results highlight the significant role of thread composition in tissue remodeling and suggest that incorporating HA could optimize therapeutic and aesthetic outcomes. Further clinical research is necessary to confirm these findings in human subjects.

Overview

The claims and statistics of this paper haven’t been checked yet.

Run the check — free, no account needed. It reads the open-access text and checks the sources it cites.

A few free checks a day · papers already verified open instantly · results are public

Integrity signals

Registry

Crossref · 10.1111/jocd.70077

Cites

24 of 24 references verified0 citation errors · 0 not checkable

Statistics

Figures

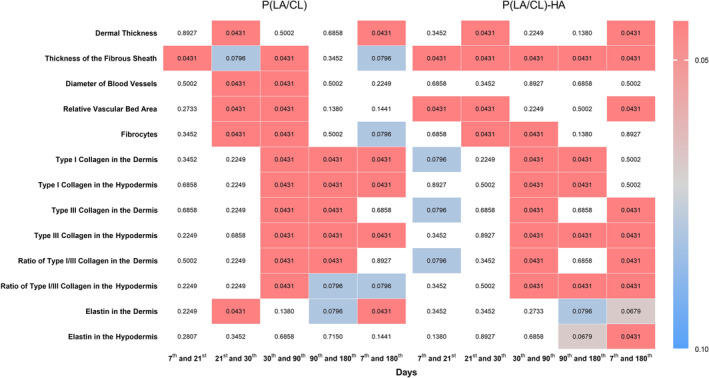
FIGURE 1 The heatmap represents the data across different indicators and time intervals for the P(LA/CL) and P(LA/CL)‐HA threads. Each cell's color intensity varies according to the p‐value, providing a visual representation of significance levels at various points. The results were considered statistically significant at p < 0.05, and a tendency toward a significant difference was suggested for 0.05 < p < 0.1, indicating that significance might be established with an increased number of samples analyzed. The non‐colored cells indicate a p‐value outside the defined range.
FIGURE 1 The heatmap represents the data across different indicators and time intervals for the P(LA/CL) and P(LA/CL)‐HA threads. Each cell's color intensity varies according to the p‐value, providing a visual representation of significance levels at various points. The results were considered statistically significant at p < 0.05, and a tendency toward a significant difference was suggested for 0.05 < p < 0.1, indicating that significance might be established with an increased number of samples analyzed. The non‐colored cells indicate a p‐value outside the defined range.CC BY · PubMed Central
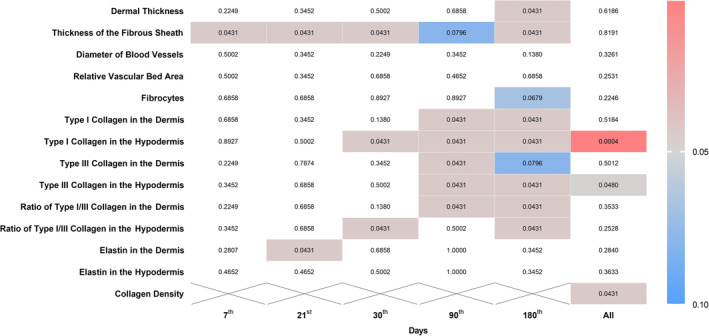
FIGURE 2 The heatmap represents the data across different indicators and days comparing P(LA/CL) and P(LA/CL)‐HA threads. Each cell's color intensity varies according to the p‐value, providing a visual representation of significance levels at various points. The results were considered statistically significant at p < 0.05, and a tendency toward a significant difference was suggested for 0.05 < p < 0.1, indicating that significance might be established with an increased number of samples analyzed. The non‐colored cells indicate a p‐value outside the defined range.
FIGURE 2 The heatmap represents the data across different indicators and days comparing P(LA/CL) and P(LA/CL)‐HA threads. Each cell's color intensity varies according to the p‐value, providing a visual representation of significance levels at various points. The results were considered statistically significant at p < 0.05, and a tendency toward a significant difference was suggested for 0.05 < p < 0.1, indicating that significance might be established with an increased number of samples analyzed. The non‐colored cells indicate a p‐value outside the defined range.CC BY · PubMed Central
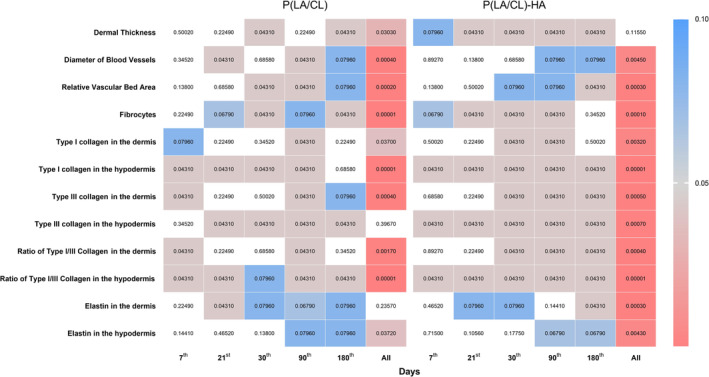
FIGURE 3 The heatmap represents the data across different indicators and days, comparing P(LA/CL) and P(LA/CL)‐HA threads with the control for each of them separately. Each cell's color intensity varies according to the p‐value, providing a visual representation of significance levels at various points. The results were considered statistically significant at p < 0.05, and a tendency toward a significant difference was suggested for 0.05 < p < 0.1, indicating that significance might be established with an increased number of samples analyzed. The non‐colored cells indicate a p‐value outside the defined range.
FIGURE 3 The heatmap represents the data across different indicators and days, comparing P(LA/CL) and P(LA/CL)‐HA threads with the control for each of them separately. Each cell's color intensity varies according to the p‐value, providing a visual representation of significance levels at various points. The results were considered statistically significant at p < 0.05, and a tendency toward a significant difference was suggested for 0.05 < p < 0.1, indicating that significance might be established with an increased number of samples analyzed. The non‐colored cells indicate a p‐value outside the defined range.CC BY · PubMed Central
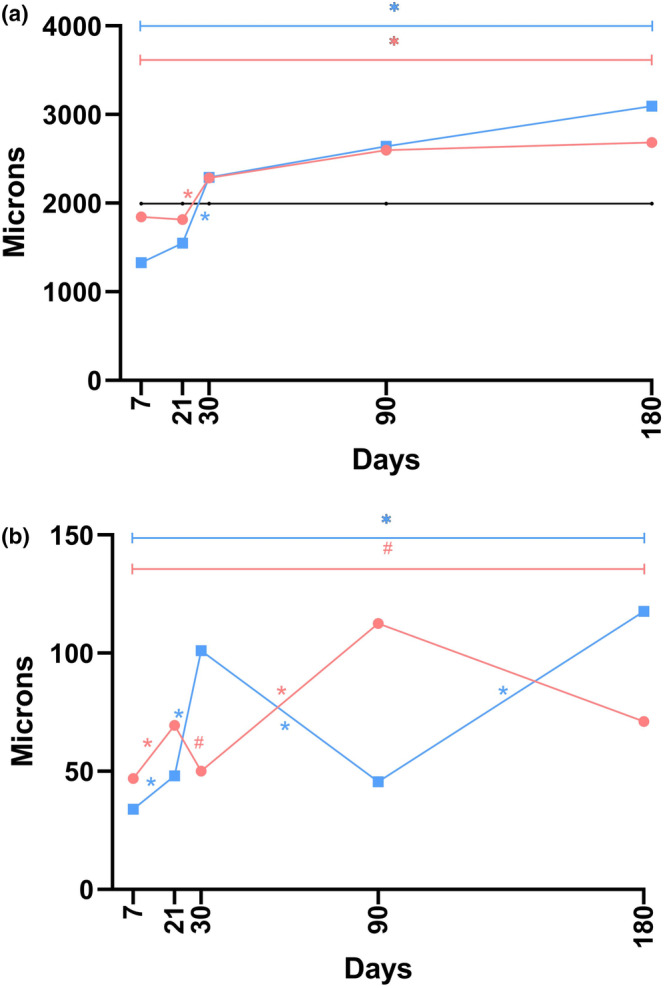
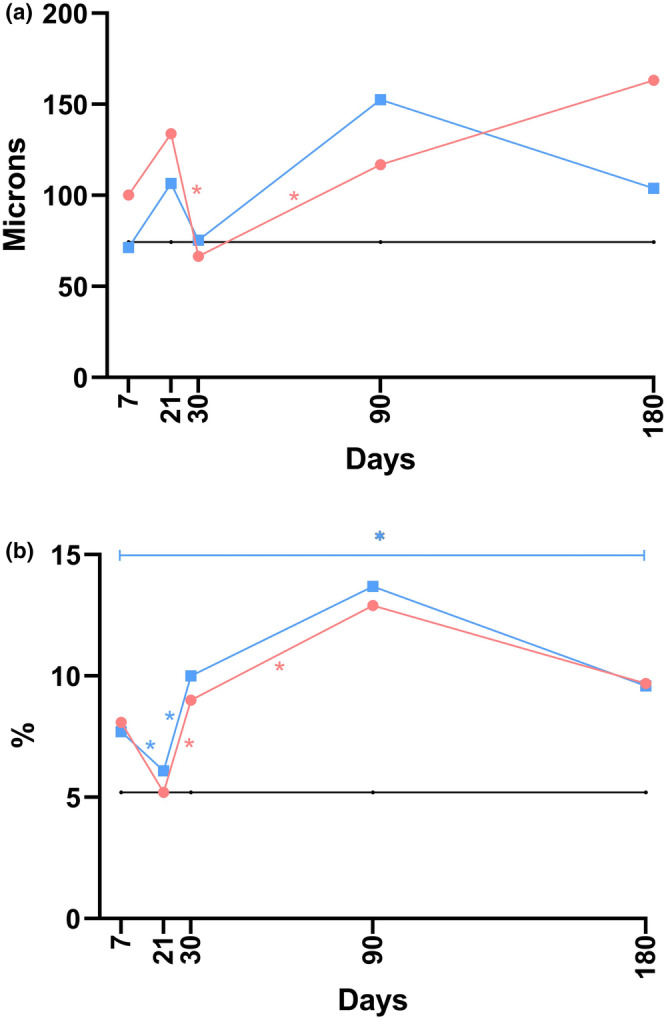
FIGURE 4 The linear graphs display data across the dermal thickness (a) and the thickness of the fibrous sheath (b) at five time points during the post‐implantation examination, constructed from median values. In the graphs, black represents the control, blue indicates P(LA/CL)‐HA, and red specifies P(LA/CL). The results were considered statistically significant at p < 0.05 (* for 0.01 ≤ p < 0.05), and a tendency toward a significant difference was suggested for 0.05 < p < 0.1 (#), indicating that significance might be established with an increased number of samples analyzed.
FIGURE 4 The linear graphs display data across the dermal thickness (a) and the thickness of the fibrous sheath (b) at five time points during the post‐implantation examination, constructed from median values. In the graphs, black represents the control, blue indicates P(LA/CL)‐HA, and red specifies P(LA/CL). The results were considered statistically significant at p < 0.05 (* for 0.01 ≤ p < 0.05), and a tendency toward a significant difference was suggested for 0.05 < p < 0.1 (#), indicating that significance might be established with an increased number of samples analyzed.CC BY · PubMed Central
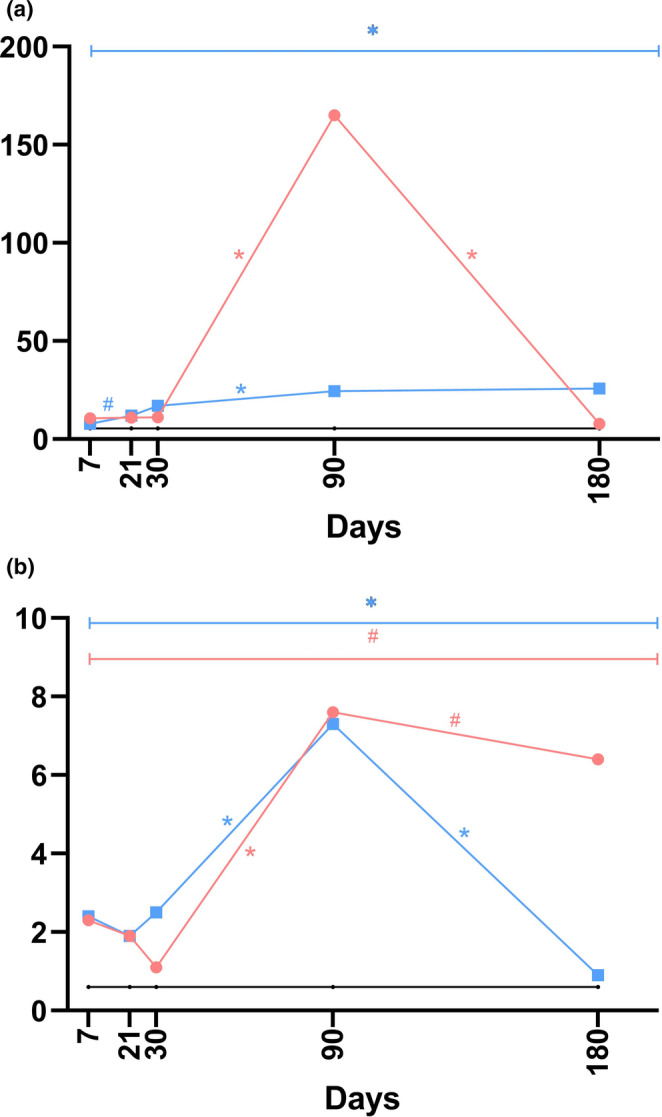
FIGURE 5 The linear graphs visually represent data pertaining to the diameter of blood vessels (a) and the relative vascular bed area (b) at five distinct time points during the post‐implantation period, utilizing median values for construction. Within these graphs, the black line denotes the control group, blue signifies the P(LA/CL)‐HA threads, and red is indicative of the P(LA/CL) threads. The results that reached a p‐value of less than 0.05 were deemed statistically significant (* denoting 0.01 ≤ p < 0.05).
FIGURE 5 The linear graphs visually represent data pertaining to the diameter of blood vessels (a) and the relative vascular bed area (b) at five distinct time points during the post‐implantation period, utilizing median values for construction. Within these graphs, the black line denotes the control group, blue signifies the P(LA/CL)‐HA threads, and red is indicative of the P(LA/CL) threads. The results that reached a p‐value of less than 0.05 were deemed statistically significant (* denoting 0.01 ≤ p < 0.05).CC BY · PubMed Central
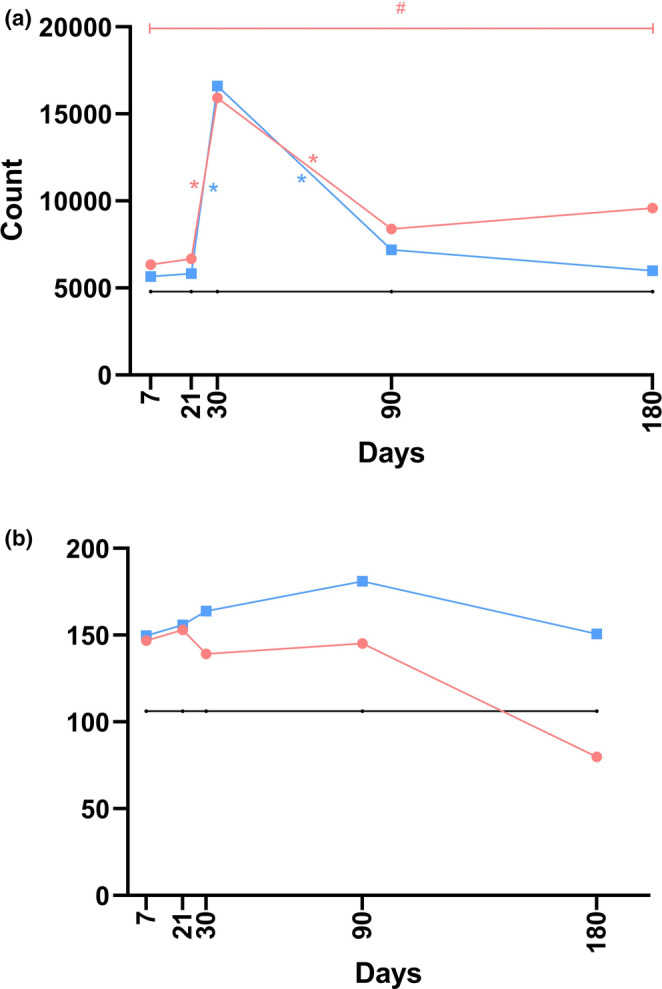
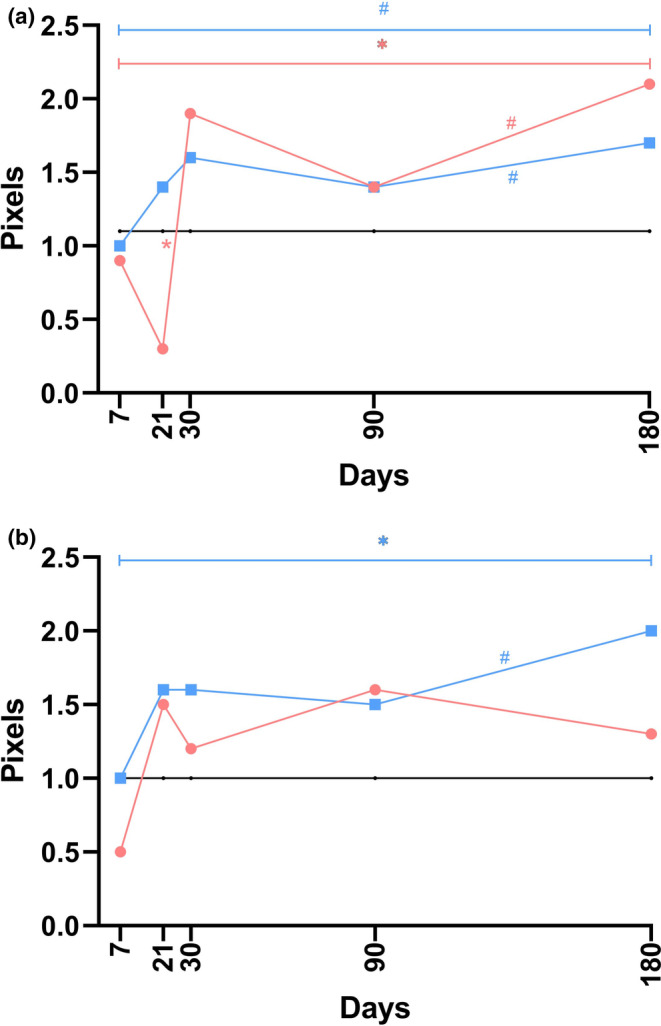
FIGURE 6 The linear graphs visually display data related to fibrocyte count (a) and collagen density (b) across five distinct time points in the post‐implantation period, constructed from median values. In these graphs, the black line represents the control group, the blue line indicates the P(LA/CL)‐HA threads, and the red line corresponds to the P(LA/CL) threads. The results were considered statistically significant at p < 0.05 (* for 0.01 ≤ p < 0.05), whereas a p‐value ranging from 0.05 to 0.1 (#) suggested a potential trend toward significance, implying that further significance could be achieved with an increased sample size.
FIGURE 6 The linear graphs visually display data related to fibrocyte count (a) and collagen density (b) across five distinct time points in the post‐implantation period, constructed from median values. In these graphs, the black line represents the control group, the blue line indicates the P(LA/CL)‐HA threads, and the red line corresponds to the P(LA/CL) threads. The results were considered statistically significant at p < 0.05 (* for 0.01 ≤ p < 0.05), whereas a p‐value ranging from 0.05 to 0.1 (#) suggested a potential trend toward significance, implying that further significance could be achieved with an increased sample size.CC BY · PubMed Central
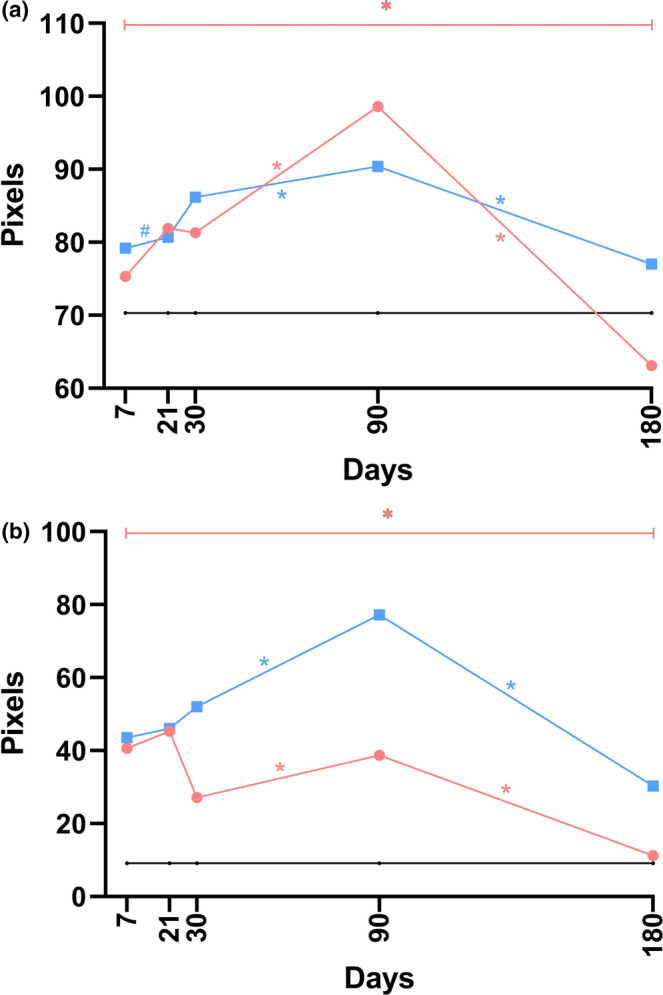
FIGURE 7 The linear graphs methodically present data concerning the density of type I collagen in the dermis (a) and hypodermis (b) at five separate time points following implantation, using median values for graphical construction. In these visual representations, the black line denotes the control group, whereas the blue and red lines indicate the P(LA/CL)‐HA threads and P(LA/CL) threads, respectively. The results were considered statistically significant at p < 0.05 (* for 0.01 ≤ p < 0.05), and a tendency toward a significant difference was suggested for 0.05 < p < 0.1 (#), indicating that significance might be established with an increased number of samples analyzed.
FIGURE 7 The linear graphs methodically present data concerning the density of type I collagen in the dermis (a) and hypodermis (b) at five separate time points following implantation, using median values for graphical construction. In these visual representations, the black line denotes the control group, whereas the blue and red lines indicate the P(LA/CL)‐HA threads and P(LA/CL) threads, respectively. The results were considered statistically significant at p < 0.05 (* for 0.01 ≤ p < 0.05), and a tendency toward a significant difference was suggested for 0.05 < p < 0.1 (#), indicating that significance might be established with an increased number of samples analyzed.CC BY · PubMed Central
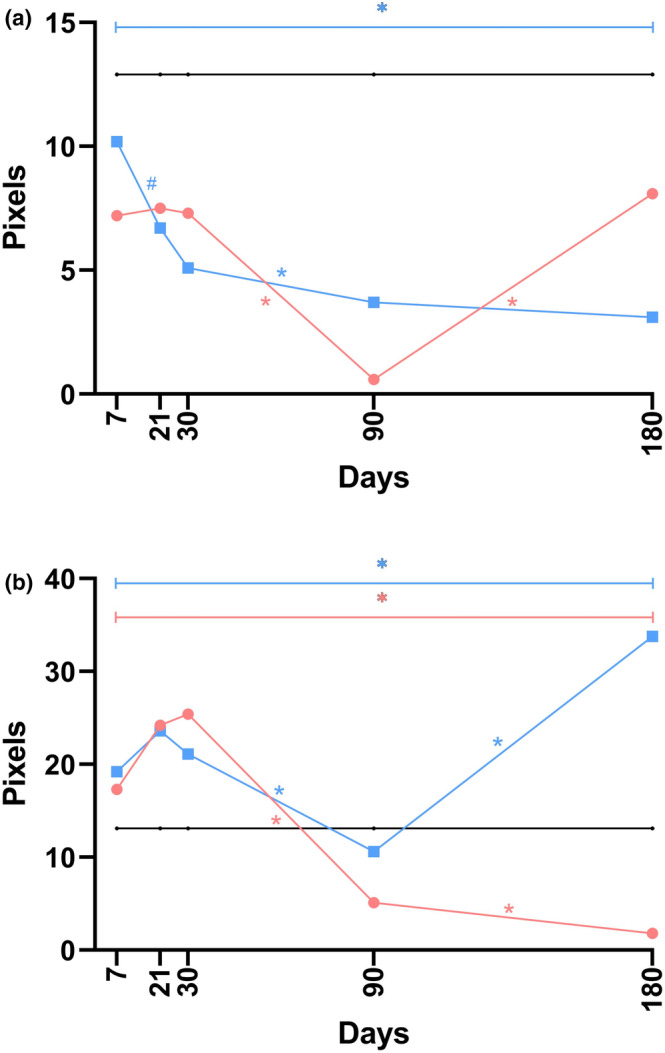
FIGURE 8 The linear graphs systematically depict data related to the density of type III collagen in the dermis (a) and hypodermis (b) across five distinct time points post‐implantation, constructed using median values. Within these graphical representations, the black line represents the control group, whereas the blue and red lines correspond to the P(LA/CL)‐HA threads and P(LA/CL) threads, respectively. The results with a p‐value less than 0.05 were deemed statistically significant (* for 0.01 ≤ p < 0.05), and a p‐value ranging from 0.05 to 0.1 (#) indicated a potential trend toward significance, suggesting that definitive significance could be reached with a larger dataset.
FIGURE 8 The linear graphs systematically depict data related to the density of type III collagen in the dermis (a) and hypodermis (b) across five distinct time points post‐implantation, constructed using median values. Within these graphical representations, the black line represents the control group, whereas the blue and red lines correspond to the P(LA/CL)‐HA threads and P(LA/CL) threads, respectively. The results with a p‐value less than 0.05 were deemed statistically significant (* for 0.01 ≤ p < 0.05), and a p‐value ranging from 0.05 to 0.1 (#) indicated a potential trend toward significance, suggesting that definitive significance could be reached with a larger dataset.CC BY · PubMed Central
FIGURE 9 The linear graphs methodically represent data pertaining to the ratio of type I to type III collagen in the dermis (a) and hypodermis (b) at five separate time points following implantation, utilizing median values for the construction. In these visual representations, the black line denotes the control group, whereas the blue and red lines indicate the P(LA/CL)‐HA threads and P(LA/CL) threads, respectively. The results that yielded a p‐value of less than 0.05 were considered statistically significant (* for 0.01 ≤ p < 0.05), and a p‐value ranging from 0.05 to 0.1 (#) suggested a potential trend toward significance, implying that conclusive significance could be achieved with an expanded sample size.
FIGURE 9 The linear graphs methodically represent data pertaining to the ratio of type I to type III collagen in the dermis (a) and hypodermis (b) at five separate time points following implantation, utilizing median values for the construction. In these visual representations, the black line denotes the control group, whereas the blue and red lines indicate the P(LA/CL)‐HA threads and P(LA/CL) threads, respectively. The results that yielded a p‐value of less than 0.05 were considered statistically significant (* for 0.01 ≤ p < 0.05), and a p‐value ranging from 0.05 to 0.1 (#) suggested a potential trend toward significance, implying that conclusive significance could be achieved with an expanded sample size.CC BY · PubMed Central
FIGURE 10 The linear graphs methodically illustrate data concerning the density of elastin in the dermis (a) and hypodermis (b) at five specific time points during the post‐implantation period, constructed from median values. In these visual representations, the black line denotes the control group, whereas the blue and red lines represent the P(LA/CL)‐HA threads and P(LA/CL) threads, respectively. The results were considered statistically significant at p < 0.05 (* for 0.01 ≤ p < 0.05), whereas a p‐value ranging from 0.05 to 0.1 (#) suggested a potential trend toward significance, implying that further significance could be achieved with an increased sample size.
FIGURE 10 The linear graphs methodically illustrate data concerning the density of elastin in the dermis (a) and hypodermis (b) at five specific time points during the post‐implantation period, constructed from median values. In these visual representations, the black line denotes the control group, whereas the blue and red lines represent the P(LA/CL)‐HA threads and P(LA/CL) threads, respectively. The results were considered statistically significant at p < 0.05 (* for 0.01 ≤ p < 0.05), whereas a p‐value ranging from 0.05 to 0.1 (#) suggested a potential trend toward significance, implying that further significance could be achieved with an increased sample size.CC BY · PubMed Central

Verification

Claims the paper makes

The claims and statistics of this paper haven’t been checked yet.

Run the check — free, no account needed. It reads the open-access text and checks the sources it cites.

A few free checks a day · papers already verified open instantly · results are public

Claims other papers make about this one

Each is checked against this paper’s own text: does it say what the citing paper says it does?

Self-check

Percentages, sums and reported differences re-computed from the paper’s own numbers.

The self-check needs the paper’s full text.

Citations

Cites

Show all 24 references

Research works printed but not linked: 1

  1. Berardesca E., 2020, Reshaping With Barbed Threads. 2020th

Cited by

Sorted by citations

Metadata

Authors
Burko, P., Sulamanidze, G., & Nikishin, D.
Affiliations
  • University of Palermo (IT)
  • Headquarter of the APTOS LLC Tbilisi Georgia
  • Russian Office of the APTOS LLC Moscow Russia
Corresponding author
Burko, Pavel
Venue
Journal of Cosmetic Dermatology
Publisher
Wiley
Published
2025-03
Volume
24
Issue
3
Pages
e70077-e70077
ISSN
  • 1473-2130 (ISSN-L)
  • 1473-2165
OpenAlex
W4408368596
Cited by
7
References
24
Citations by year
2026: 4 · 2025: 3
FWCI
6.65
Type
journal article
Language
en
Open access
Locations
  • Journal of Cosmetic Dermatology (publishedVersion, cc-by)
  • PubMed Central (publishedVersion, cc-by)
  • PubMed (publishedVersion)
Funders
Università degli Studi di Palermo (PJ_DR_D24_INCR10_37_523976_BURKO)
Topics
  • Health Sciences › Medicine › Dermatology › Facial Rejuvenation and Surgery Techniques
  • Health Sciences › Medicine › Surgery › Surgical Sutures and Adhesives
  • Physical Sciences › Materials Science › Biomaterials › biodegradable polymer synthesis and properties
Keywords
poly(L-lactide-co-ε-caprolactone), hyaluronic acid coating, biodegradable polymers, dermal remodeling, collagen, elastin, tissue integration, biostimulation, porcine model, subcutaneous implantation, aesthetic medicine
MeSH terms
Dermal Fillers, Animals, Collagen, Cosmetic Techniques, Elastin, Female, Hyaluronic Acid, Polyesters, Skin, Swine, Skin Aging, Coated Materials, Biocompatible, Absorbable Implants

About these checks

Registry, retraction, Cites and statistics results are computed, not judged, with one exception: a printed reference that no index lists is read once by a model before it counts as a citation error. Claims are extracted by a model and kept only when their quote appears verbatim in the text; each cited source is then checked, with a model’s help, for whether it says what the claim relies on. Those verdicts can be wrong — read the claim’s quote and the cited source before relying on one.

Statistics and arithmetic are recomputed, not judged.

Confidence bands are shown only for fields calibrated on our annotated test set. None is calibrated yet, so no band is shown.

What counts as a claim ›How we measure confidence ›How we check this ›

Are you an author, or do you see a problem with this page? Request a review