

Machine-knitted washable sensor array textile for precise epidermal physiological signal monitoring
Open accessThe DOI matches its Crossref record; 51 of the 51 references it cites were found in a registry or an index.
Abstract
A triboelectric all-textile sensor with high pressure sensitivity and comfort was been developed for health monitoring.
Overview
The claims and statistics of this paper haven’t been checked yet.
Free: it reads the open-access text and checks the first 5 claims that cite a source we can check. Create a free account to check every claim.
Integrity signals
Registry
Cites
Statistics
Figures
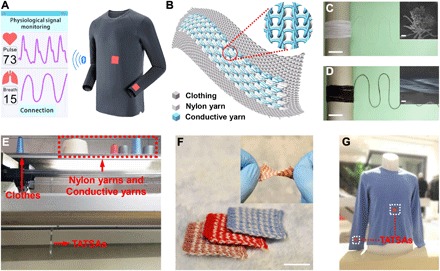
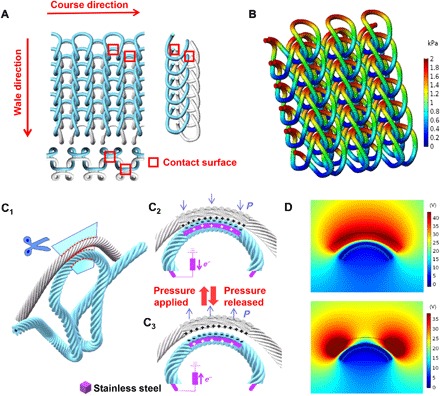
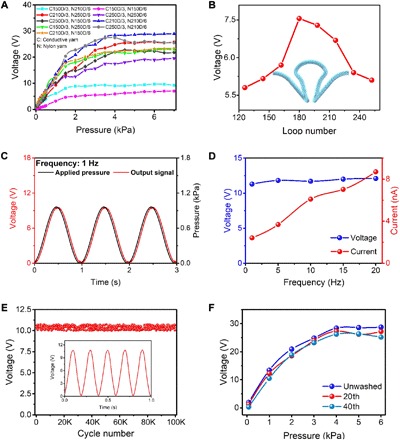
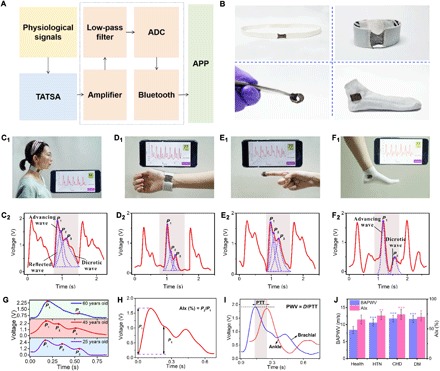
Verification
Claims the paper makes
The claims and statistics of this paper haven’t been checked yet.
Free: it reads the open-access text and checks the first 5 claims that cite a source we can check. Create a free account to check every claim.
Claims other papers make about this one
Each is checked against this paper’s own text: does it say what the citing paper says it does?
The source backs part of the claim, not all of it — or backs it for a different population, condition or comparison.
In the citing paper
“biofuel cells,[615] piezoelectric,[122] triboelectric,[127] solar[616] and other self-powered methods are prominent representatives of power supply for low-energy devices, truly enabling the user to move freely.”
From Flexible Electronics and Devices as Human–Machine Interfaces for Medical Robotics (2022) · cites this paper as [127]
Experimental — accuracy not yet measured
Self-check
Percentages, sums and reported differences re-computed from the paper’s own numbers.
The self-check needs the paper’s full text.
Citations
Cites
A wearable and highly sensitive pressure sensor with ultrathin gold nanowires
Gong, S., Schwalb, W., Wang, Y., Chen, Y., Tang, Y., Si, J., Shirinzadeh, B., & Cheng, W. (2014) · Nature Communications · doi:10.1038/ncomms4132 · Cited by 2,064
Schwartz, G., Tee, B. C.-K., Mei, J., Appleton, A. L., Kim, D. H., Wang, H., & Bao, Z. (2013) · Nature Communications · doi:10.1038/ncomms2832 · Cited by 2,042 · cited 1×
“As a result, tapes, Band-Aids, or other mechanical fixtures are required to establish a compact contact between wearable electronics and human skin, which can cause irritation and inconvenience during extended periods of use ( 27 , 28 ).”
Soft Microfluidic Assemblies of Sensors, Circuits, and Radios for the Skin
Xu, S., Zhang, Y., Jia, L., Mathewson, K. E., Jang, K.-I., Kim, J., Fu, H., Huang, X., Chava, P., Wang, R., et al. (2014) · Science · doi:10.1126/science.1250169 · Cited by 1,199
Conductive Fiber‐Based Ultrasensitive Textile Pressure Sensor for Wearable Electronics
Lee, J., Kwon, H., Seo, J., Shin, S., Koo, J. H., Pang, C., Son, S., Kim, J. H., Jang, Y. H., Kim, D. E., et al. (2015) · Advanced Materials · doi:10.1002/adma.201500009 · Cited by 1,152
Noninvasive determination of age-related changes in the human arterial pulse.
Kelly, R., Hayward, C., Avolio, A., & O'Rourke, M. (1989) · Circulation · doi:10.1161/01.cir.80.6.1652 · Cited by 1,141
Self-powered ultra-flexible electronics via nano-grating-patterned organic photovoltaics
Park, S., Heo, S. W., Lee, W., Inoue, D., Jiang, Z., Yu, K., Jinno, H., Hashizume, D., Sekino, M., Yokota, T., et al. (2018) · Nature · doi:10.1038/s41586-018-0536-x · Cited by 1,068
Micro-cable structured textile for simultaneously harvesting solar and mechanical energy
Chen, J., Huang, Y., Zhang, N., Zou, H., Liu, R., Tao, C., Fan, X., & Wang, Z. L. (2016) · Nature Energy · doi:10.1038/nenergy.2016.138 · Cited by 1,060
Self-citationClinical measurement of arterial stiffness obtained from noninvasive pressure waveforms
NICHOLS, W. (2005) · American Journal of Hypertension · doi:10.1016/j.amjhyper.2004.10.009 · Cited by 1,001
Dagdeviren, C., Su, Y., Joe, P., Yona, R., Liu, Y., Kim, Y.-S., Huang, Y., Damadoran, A. R., Xia, J., Martin, L. W., et al. (2014) · Nature Communications · doi:10.1038/ncomms5496 · Cited by 987
Park, J., Kim, M., Lee, Y., Lee, H. S., & Ko, H. (2015) · Science Advances · doi:10.1126/sciadv.1500661 · Cited by 939
Cited by
Items 401–500 of 522
Triboelectric Nanogenerator for Healthcare
Xiao, X., Yin, J., & Chen, J. (2023) · Springer eBooks · doi:10.1007/978-3-031-28111-2_18 · Cited by 6
Recent trend in stretchable composite sensors for wearable robot applications
Zaheer, M. U., & Chang, S. (2023) · Advanced Composite Materials · doi:10.1080/09243046.2023.2270379 · Cited by 6
“Array-type sensors with specifically-shaped unit cells [85–87] or knitting units [88] have been developed for electric functions to detect the various physical changes in temperature, pressure, and humidity through contact.”
BackgroundChen, P., Peng, W., Yang, W., Wang, S., Wu, Y., Chen, S., Huang, Y., Tsai, C., Lu, H., Wang, X., et al. (2026) · Advanced Functional Materials · doi:10.1002/adfm.74388 · Cited by 5
“…form is the fabric-based TENG (f-TENG), which demonstrates great potential for wearable applications due to its seamless integrability into textiles, including health monitors [11, 37], motion sensors [4, 11, 33, 38], speech recognition interfaces [4, 39], and wireless controllers [11, 40].”
Ren, H., Li, Y., Zhang, H., Hu, Z., Wang, J., Song, Y., Su, K., Ding, G., Liu, H., & Yang, Z. (2023) · IEEE Sensors Journal · doi:10.1109/jsen.2023.3322683 · Cited by 5
“Therefore, a great number of methods have been developed for affordable and convenient monitoring of respiration in the past few decades [12], [13].”
BackgroundZhou, D., Yin, M., Wang, C., Wang, X., Li, Y., Shen, Y., Fang, Q., Chen, K., & Qiao, S. (2024) · Nano Today · doi:10.1016/j.nantod.2024.102613 · Cited by 5
Advances in flexible sensor monitoring technology for neurodegenerative diseases in the elderly
Zhu, Z., Wang, H. L., Zhang, L., Zeng, L., Gan, L., & Jia, B. (2025) · Nanotechnology · doi:10.1088/1361-6528/adddc5 · Cited by 6
Respiratory Monitoring Smart Vest Based on Flexible Pressure Sensor
Xiao, S., & He, Y. (2022) · AATCC Journal of Research · doi:10.1177/24723444221136624 · Cited by 5
Pawłowski, S., Plewako, J., & Korzeniewska, E. (2023) · Sensors · doi:10.3390/s23031487 · Cited by 5
“The weaving of metal wires or conductive threads [1], or covering them with metal [9] or conductive polymers [10] in the process of knitting [11] or weaving, are among the known methods of producing such elements.”
BackgroundConformable Wearable Electrodes: From Fabrication to Electrophysiological Assessment
Galliani, M., Ferrari, L. M., & Ismailova, E. (2022) · Journal of Visualized Experiments · doi:10.3791/63204 · Cited by 5
Debnath, B., Gharami, S., Bhattacharyya, S., Das, A., & Das, A. (2022) · Wiley eBooks · doi:10.1002/9781119905301.ch20 · Cited by 6
Design, preparation, and performance research of a knitted sensor for respiratory rate detection
Zhou, M., Cai, Q., Chen, W., & Wang, J. (2023) · Materials Today Communications · doi:10.1016/j.mtcomm.2023.107234 · Cited by 5
Electrical output performance of triboelectric nanogenerator based on magnetic high entropy alloy
Liu, M., Wang, L.-Y., Wang, P., Wu, L., Yin, F., Zhang, J., & Long, Y. (2025) · Rare Metals · doi:10.1007/s12598-024-03112-x · Cited by 4
Smart textile-integrated thermochromic display for real-time temperature monitoring in elderly care
Lee, C. H., Tan, J., Tang, H. T., Yu, A., Tan, J. J., Lam, N. Y. K., & Tse, K. W. (2025) · Discover Applied Sciences · doi:10.1007/s42452-025-07532-x · Cited by 6
“These innovations have led to the development of textiles designed for fall detection, cardiovascular monitoring, and thermoregulation, offering valuable real-time health insights while ensuring wearer comfort [5–11].”
Wearable fabric electronics for sensing, memory and neuromorphic computing applications
Sun, B., Lin, L., Meng, J., & Wang, T. (2026) · FlexMat. · doi:10.1002/flm2.70035 · Cited by 6
Smart Textiles: An Interdisciplinary Overview of Advances, Applications, and Future Prospects
Ovi, F. I., Shova, R. J., Rahman, M. A. (. )., & Ghosh, N. C. (2025) · Biomaterials Connect · doi:10.69709/biomatc.2025.148814 · Cited by 4
ZnO Nanostructure-Based Flexible Pressure Sensors Deposited on Filter Paper for Wearable Application
Ding, J., Zhao, P., & Chen, H. (2025) · Langmuir · doi:10.1021/acs.langmuir.5c01404 · Cited by 4
Kuo, C., Tu, K.-Y., Song, G.-Z., & Hu, L. (2025) · Chemical Engineering Journal · doi:10.1016/j.cej.2025.164092 · Cited by 4
Wide Linearity Range and Rapid‐Response Tactile Sensor Inspired by Parallel Structures
Gao, W., Yao, J., Yu, X., Ma, G., Wang, D., Yu, H., Han, Z., & Ren, L. (2025) · Advanced Science · doi:10.1002/advs.202506783 · Cited by 5
Jointly Modeling Spatio-Temporal Features of Tactile Signals for Action Classification
Lin, J., Li, J., Gao, J., Ma, W., & Liu, Y. (2024) · Proceedings of the AAAI Conference on Artificial Intelligence · doi:10.1609/aaai.v38i12.29288 · Cited by 4
“In recent years, various wearable electronics have been designed to collect tactile signals, which are widely used in multiple scenarios, especially in healthcare and robotics (Zhu et al. 2019; Fan et al. 2020; Lou et al. 2020; Okunevich et al. 2021).”
BackgroundResearch and application of flexible wearable electronics based on nanogenerator in touch sensor
Wang, C., Bao, R., & Pan, C. (2021) · Acta Physica Sinica · doi:10.7498/aps.70.20202157 · Cited by 5
In-situ sugar-templated porous elastomer sensor with high sensitivity for wearables
Ren, M., Fang, Y. Z., Zhang, Y., Deng, H., Zhang, D., Lin, H., Chen, Y., & Xiong, J. (2022) · Frontiers of Materials Science · doi:10.1007/s11706-022-0597-5 · Cited by 4
Fiber- and Textile-Based Triboelectric Nanogenerators
Jiang, F. Y., Zhou, X., & Lee, P. S. (2023) · Springer eBooks · doi:10.1007/978-3-031-28111-2_25 · Cited by 4
Song, J. E., Kim, H., Lim, D., & Lee, S. (2024) · Journal of Engineered Fibers and Fabrics · doi:10.1177/15589250241255105 · Cited by 3
“5,13 Thus, when measuring sEMG, it is inevitable to wear the textile electrodes tightly to ensure adherence to the skin.”
Flexible pressure sensor based on Cu mesh/ZnO nanorod/graphene
Zheng, P., Zhao, P., Ding, J., Chen, H., & Qu, Y. (2025) · Materials Research Bulletin · doi:10.1016/j.materresbull.2025.113735 · Cited by 3
Electret-based wrist-worn pressure sensor for non-invasive monitoring of pulse and blood pressure
Li, Y., Lü, J., Zhou, Y., Wang, X., Luo, Z., Gui, Y., Lu, W., & Li, L. (2025) · Cell Reports Physical Science · doi:10.1016/j.xcrp.2025.102914 · Cited by 4
Heartbeat signal quality assessment in smart clothing based on signal imaging and transfer learning
Yan, B., Jiang, Z., Zhao, S., Wang, C., Ma, J., & Zhang, X. (2025) · Biomedical Signal Processing and Control · doi:10.1016/j.bspc.2025.109240 · Cited by 3
Xiong, S., Yang, Q., Li, X., Ren, D., Li, G., Liang, Z., Zhu, J., Zhou, Y., Cheng, J., Lu, Z., et al. (2026) · Advanced Energy Materials · doi:10.1002/aenm.70840 · Cited by 3
“Additionally, respiratory monitoring sensors based on rigid mask-type [5, 30, 31], hydrogel [32–34], and fiber structures [35–41] face challenges related to large size and structural rigidity [42, 43], which compromise both wearing comfort and response speed.”
Triboelectric Nanogenerators for Challenging Operating Environments
Yin, T., Guan, X., Chen, J., Zhang, H., Huang, F., & Xu, B. (2026) · Advanced Functional Materials · doi:10.1002/adfm.202524063 · Cited by 3
Triboelectric nanogenerators enabled smart wearables for health monitoring
Hasan, M. Z., Akter, A., Luo, L., Motaleb, K. Z. M. A., Ünal, M., Sha, S., Zhang, R., Zhu, J., & Zhu, L. C. (2026) · Chemical Engineering Journal · doi:10.1016/j.cej.2026.178369 · Cited by 3
From Flexible to Conformable Pressure Sensors: Mechanisms, Materials, and Biomedical Applications
Mishra, R., Ottomaniello, A., & Mattoli, V. (2026) · Advanced Electronic Materials · doi:10.1002/aelm.202600015 · Cited by 3
Subgroup State Prediction under Different Noise Levels Using MODWT and XGBoost
Zhao, X., & Nie, X. (2023) · Journal of Healthcare Engineering · doi:10.1155/2023/6406275 · Cited by 3
Niu, L., Zhao, S., Liu, Q., Wu, G., Chen, C., & Ma, P. (2021) · Textile Research Journal · doi:10.1177/00405175211044545 · Cited by 4
Jang, H., Jung, W. T., Chung, C., Kim, M., So, Y., Song, S., & Kim, B. H. (2022) · ACS Applied Electronic Materials · doi:10.1021/acsaelm.2c00511 · Cited by 3
Replaceable Bilayer Structure for Two-Dimensional Resistive Sensor Array
Wu, J., Yang, P., Hu, H.-Y., Hu, C., & Liu, B. (2022) · IEEE Sensors Journal · doi:10.1109/jsen.2022.3191311 · Cited by 3
Smart Nanotextiles for Energy Generation
Xiong, J., & Lee, P. S. (2022) · Wiley eBooks · doi:10.1002/9781119654872.ch8 · Cited by 5
Triboelectric Nanogenerator for Sports
Prasanna, A. P. S., Khandelwal, G., & Kim, S. (2023) · Springer eBooks · doi:10.1007/978-3-031-28111-2_28 · Cited by 3
Big Fiber Slicing for Dynamic Multimodal Multipreference Applications of Smart Fabrics
Liu, J., Zheng, H., Huo, D., Hao, Y., Niyato, D. T., AlQahtani, S. A., & Chen, M. (2024) · IEEE Internet of Things Journal · doi:10.1109/jiot.2024.3380640 · Cited by 5
“Their applications are broad, and they rely on different sensing principles such as piezoelectricity [8], triboelectricity [9], and optics [10], which enable monitoring variables like electrocardiograms, respiration, and pulse.”
BackgroundHighly Stretchable Electromechanical Sensors with Ionotronic Knots Based on Hydrogel Fibers
Li, P., Liu, J., Wang, S., Tao, C., Yang, Y. W., Wang, J., & Wang, J. (2024) · Advanced Materials Technologies · doi:10.1002/admt.202302202 · Cited by 3
Development of a Body-Worn Textile-Based Strain Sensor: Application to Diabetic Foot Assessment
Turnbull, R. P., Corser, J., Orlando, G., Venkatraman, P. D., Yoldi, I., Bradbury, K. J., Reeves, N. D., & Culmer, P. (2025) · Sensors · doi:10.3390/s25072057 · Cited by 3
“Several authors have demonstrated triboelectric generators in human interface applications [8,50–52].”
Zhang, M., Su, H., Zhang, C., & Wen, X. (2024) · Measurement · doi:10.1016/j.measurement.2024.116044 · Cited by 2
Towards out-of-studio motion capture through wearable sensors
Joung, J., Kim, J., & Kim, D. (2025) · Journal of Industrial and Engineering Chemistry · doi:10.1016/j.jiec.2025.08.032 · Cited by 3
AI-powered electronic skin: from smart design to cognitive interaction
Wang, B., Kong, D., Yang, H., Xu, K., & Yang, G. (2026) · Bio-Design and Manufacturing · doi:10.1631/bdm.2500376 · Cited by 2
“Piezo-and tribo-electric sensors are limited to dynamic force detection but offer the advantages of rapid-response time and self-powering capability, respectively [143–146].”
Review: integration of 3D printing and embroidery technology in smart textiles functionalities
Anan, J., Sayam, S., Amin, J., Siddiqua, A., Mamun, A. A., & Uddin, M. A. (2026) · Journal of Materials Science · doi:10.1007/s10853-026-12898-3 · Cited by 2
Nanogenerators from wearable sensors to implantable therapeutic systems
Goharian, H., Ji, X., Ranjbar, F., & Saberian, M. (2026) · Sensors and Actuators A Physical · doi:10.1016/j.sna.2026.118093 · Cited by 2
Knittable electronic textiles for intelligent soft wearables
Takahashi, R., Chen, H. H., Mao, H., Yukita, W., Yokota, T., Someya, T., Kawahara, Y., Luo, Y., & Wicaksono, I. (2026) · npj Flexible Electronics · doi:10.1038/s41528-026-00611-y · Cited by 3
Kuang, Y., Rui, X., Lou, L., Li, L., Huang, H.-X., Ding, X., Yan, Y., & Wang, Q. (2023) · Textile Research Journal · doi:10.1177/00405175231199258 · Cited by 2
Fatema, A., Mishra, S. B., & Hussain, A. M. (2024) · IEEE International Conference on Flexible and Printable Sensors and Systems (FLEPS) · doi:10.1109/fleps61194.2024.10603507 · Cited by 2
“Textile-based sensors can be used in numerous applications like augmented reality (AR), [3], [4], electronic skin [5], [6], healthcare [7], [8], motion detection such as breathing, speaking, joint movements [9]–[11], and pressure mapping [12], [13].”
BackgroundEnergy harvesting from clothing
Wang, S., Lu, F., Guan, W., You, Z., Liao, B., Huang, M., Li, Y., Fang, W., & Liu, Y. (2025) · Nanoscale · doi:10.1039/d4nr03719g · Cited by 3
Seamless integration of touch sensing smart textiles through computerized machine knitting
Hosen, M. M., & Ahmed, S. (2025) · Journal of Engineered Fibers and Fabrics · doi:10.1177/15589250251331051 · Cited by 3
Sofronova, D. (2020) · E3S Web of Conferences · doi:10.1051/e3sconf/202020703001 · Cited by 2
Application of flexible pressure sensor based on AgNWs in human motion detection
Zhang, H., Zhang, J., Zhang, Y., Ye, X., Li, Y., & Wang, P. (2023) · International Journal of Clothing Science and Technology · doi:10.1108/ijcst-09-2022-0127 · Cited by 3
Zhang, M., Su, H., Zhang, C., Sun, Z., & Jiang, Z. Z. (2023) · Textile Research Journal · doi:10.1177/00405175231153224 · Cited by 2
“However, they have low air permeability, resulting in being uncomfortable for long-term and continuous health monitoring.(9) Compared with traditional electronic sensors, optical fiber sensors offer advantages such as small size, light weight, low cost, and immunity to electromagnetic interference.”
BackgroundFardadidokht, S., & Yavandhasani, J. (2024) · Journal of Electronic Materials · doi:10.1007/s11664-024-11316-1 · Cited by 3
“Hence, for some wearable CSTENGs in which a thin dielectric layer is required, 44–46 utilizing materials with the lowest dielectric constant is essential to obtaining maximum power.”
Self-powered triboelectric sensors for biomedical applications
Lincy, R. B., Rubia, J. J., Shibi, C. S., Kanimozhi, N., Sheeba, C. S., & Sumathy, G. (2024) · Elsevier eBooks · doi:10.1016/b978-0-443-13792-1.00005-5 · Cited by 2
Fully textile striped triboelectric electroactive sensors for motion monitoring
Blūms, J., Kataševs, A., Mileika, E., Gorņevs, I., Jurķāns, V., Balgale, I., Baltiņa, I., & Okss, A. (2025) · Journal of the Textile Institute · doi:10.1080/00405000.2025.2502892 · Cited by 1
“Most developed textile-based TENGs, including knitted TENGs (t-TENGs), incorporate specially designed core-spun or core-sheath wires and yarns, which have essential thickness and relatively low flexibility compared to traditional yarns (Fan et al., 2020; Pu et al., 2016; Yu et al., 2017).”
Bio-Fabrication Techniques for Eco-Friendly Biomedical Devices
Kirtania, M. D., Pal, R., Ashique, S., Kumar, A., & De, S. (2025) · Springer eBooks · doi:10.1007/978-3-031-91790-5_5 · Cited by 1
Self-powered cardiovascular medical devices: From monitoring to therapy
Peng, C., Yuan, X., Zou, Y., & Li, Z. (2025) · Cardiac Research · doi:10.1097/re9.0000000000000005 · Cited by 2
Noble Metal-Based Hybrid Nanogenerators for Sustainable Energy and Optoelectronic Innovation
Kumar, R. R., & Punetha, D. (2025) · Progress in optical science and photonics · doi:10.1007/978-981-95-1687-2_5 · Cited by 1
Yue, X., Yao, Q., & Liu, H. (2025) · Science China Materials · doi:10.1007/s40843-025-3720-2 · Cited by 1
“Xiaoyan Yue, Qizhi Yao and Hu Liu * The rise of smart textiles and wearable electronics is reshaping the demands placed on conductive fibers, shifting the focus from static conductivity toward dynamic electromechanical resilience [1–3].”
Zhou, Y., Rees, J., Matcham, F., Patel, A. S., Antonelli, M., Tinker, A., Ourselin, S., & Liu, W. (2025) · Journal of Medical Internet Research · doi:10.2196/81027 · Cited by 1
Shang, C., Qi, H., Wang, Z., Meng, K., Liu, Z., Meng, Z., Yang, Y., Wang, J., & Jiang, S. (2026) · Advanced Science · doi:10.1002/advs.202516891 · Cited by 1
“In addition, they provide advantages such as high breathability, lightweight construction, and enhanced comfort for wearable applications [ 130– 134 ].”
Self-citationAdvanced applications of triboelectric sensors across human body regions
Hong, S., Duan, Y., Zhang, Y., Xu, Q., & Wang, P. (2026) · Renewable and Sustainable Energy Reviews · doi:10.1016/j.rser.2025.116694 · Cited by 1
Structure‐Driven Smart Textiles for Self‐Powered Wearable Systems
Ryu, H., Lee, S., & Kim, S. (2026) · Small Structures · doi:10.1002/sstr.202500910 · Cited by 1
“Biomechanical energy harvesters capitalize on kinetic stimuli, ranging from limb motion to respiration and physiological deformations, to provide an intuitive, motion-synchronous energy supply [79 – 81].”
InfluentialImpact of operation modes on the performance of textile triboelectric generators
Kataševs, A., Gorņevs, I., Jurķāns, V., Okss, A., & Blūms, J. (2026) · Sensors and Actuators A Physical · doi:10.1016/j.sna.2026.118193 · Cited by 1
Liu, C., Guo, Z., Gao, Q., Du, Y., Yan, D., Lin, H., Dong, L., Qian, E., Yang, J., Yang, W., et al. (2026) · Cell Reports Physical Science · doi:10.1016/j.xcrp.2026.103538
Self-citationAdvances in flexible triboelectric pressure sensor for physiological signal monitoring
Peng, T., Shen, L., Gao, Z., Sima, Z., Yeshmukhametov, A., Kalimuldina, G., Liu, Y., & Wen, Z. (2026) · Journal of Semiconductors · doi:10.1088/1674-4926/26050029 · Cited by 1
Yu, J., Chen, Z., Zeng, H., Ji, B., Wu, Z., Wu, J., Li, Y., Xie, J., Chang, H., & Tao, K. (2021) · IEEE International Conference on Nano/Micro Engineered and Molecular Systems · doi:10.1109/nems51815.2021.9451511 · Cited by 1
Triboelectric Nanogenerator for Healthcare
Xiao, X., Yin, J., & Chen, J. (2022) · Springer eBooks · doi:10.1007/978-3-031-05722-9_18-1 · Cited by 2
Integrated Sensing Devices for Brain-Computer Interfaces
Do, T., Duong, N. M. H., & Lin, C. (2023) · Springer eBooks · doi:10.1007/978-3-031-21610-7_7 · Cited by 2
Fiber- and Textile-Based Triboelectric Nanogenerators
Jiang, F. Y., Zhou, X., & Lee, P. S. (2023) · Springer eBooks · doi:10.1007/978-3-031-05722-9_25-1 · Cited by 1
Wireless CardioS framework for continuous ECG acquisition
Sriraam, N., Srinivasulu, A., & Prakash, V. S. R. (2023) · Journal of Medical Engineering & Technology · doi:10.1080/03091902.2023.2267116 · Cited by 1
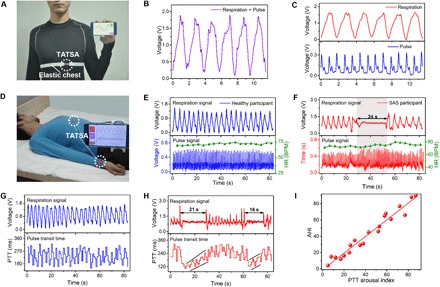
“[34], the researchers fabricated a triboelectric all-textile sensor array with an elastic belt to simultaneously acquire pulse and respiratory signals.”
BackgroundUpdates of Wearing Devices (WDs) In Healthcare, And Disease Monitoring
Naser, M., Nasr, M., & Shehata, L. H. (2023) · International Journal of Progressive Sciences and Technologies · doi:10.52155/ijpsat.v39.1.5361 · Cited by 1
Onggar, T., Frankenbach, L. A., & Cherif, C. (2024) · Coatings · doi:10.3390/coatings14111424 · Cited by 1
Kim, J., & Kim, J. (2025) · Fibers and Polymers · doi:10.1007/s12221-025-00942-z · Cited by 1
Analysis and design of a flexible exoskeleton for the upper limbs
Samper-Escudero, J. L. (2021) · UPM Digital Archive (Technical University of Madrid) · doi:10.20868/upm.thesis.69054 · Cited by 1
Towards Self‐Powered Electronic Textiles
Fan, X. H., Zhang, N., & Wang, Y. (2021) · Wiley eBooks · doi:10.1002/9783527818235.ch9
Tseghai, G. B., Tahir, H. R., Malengier, B., Hertleer, C., Fante, K. A., & Langenhove, L. V. (2022) · Elsevier eBooks · doi:10.1016/b978-0-12-822548-6.00121-7
Wu, Y., Chen, C., Han, F., & Chen, W. (2022) · PubMed Central · doi:10.7507/1001-5515.202112066
Artificial Intelligence Algorithm for Flexible Sensors
(2022) · Wiley eBooks · doi:10.1002/9783527833115.ch11
Dispositivos electrónicos impresos sobre sustratos textiles mediante la técnica de flexografía
Rodes-Carbonell, A. M. (2022) · RiuNet (Universitat Politècnica de València) · doi:10.4995/thesis/10251/189164
Review and Assessment of Carbon Nanotube Based Actuating Textiles
Dalrymple, J., Doumit, M., & Green, D. A. (2022) · World Automation Congress (WAC) · doi:10.23919/wac55640.2022.9934163
“Exploitation of actuating textiles has garnered significant interest in many industries for a range of applications including for health monitoring [1], [2], softbodied assistive devices [3]–[5] and fashion [6]–[9].”
BackgroundTriboelectricity: New paradigms for energy harvesting and point-of-care applications
Awan, H. T. A., & Khalid, M. (2022) · Materials Today Proceedings · doi:10.1016/j.matpr.2022.11.311 · Cited by 1
Triboelectric Nanogenerator for Sports
Prasanna, A. P. S., Khandelwal, G., & Kim, S. (2023) · Springer eBooks · doi:10.1007/978-3-031-05722-9_28-1
İplik Tasarımında İnovasyonun Tekstil ve Moda Tasarımına Katkısı
Tokgöz, S. (2023) · Art-e Sanat Dergisi · doi:10.21602/sduarte.1366284
Understanding and supporting wearable technologies for freedivers
Bube, B. (2023) · Repositorio Institucional de la Universidad de Burgos (University of Burgos) · doi:10.36443/10259/9230
Mu, J., Zou, J., Wang, Y., Lei, Y., He, J., Hou, X., Zhang, L., Yu, J., & Chou, X. (2024) · SSRN Electronic Journal · doi:10.2139/ssrn.4944532
E-Textiles and Wearables for Healthcare
Thakur, R., & Chavhan, M. V. (2024) · SDGs and textiles · doi:10.1007/978-981-97-6496-9_17
Wang, X., Xu, H., Lim, E. G., Hoettges, K. F., Wei, X., Niu, F., & Song, P. (2024) · SSRN Electronic Journal · doi:10.2139/ssrn.5067337
A Flexible Sensor Based on PVC Gel for Detections of Robotic Grasping
Zhong, Q., He, Q., Xie, L., & Shi, Z. (2025) · Lecture notes in computer science · doi:10.1007/978-981-96-0795-2_23
Self-citationChen, C., Wang, W., Shen, Y., Zhao, Y., Su, Z., Wang, K., Cong, H., Jiang, G., Zhang, A., Yu, H., et al. (2025) · SSRN Electronic Journal · doi:10.2139/ssrn.5243892
Numerical analysis and modeling of shape memory alloy with stochastic structural variations
Wang, J., Bian, W., Li, X., Zhu, Y., & Wang, G. (2025) · Journal of Physics Conference Series · doi:10.1088/1742-6596/3021/1/012075
“Integrating SMA with textile techniques [1] such as weaving, knitting, and mesh structures enables the development [2] of lightweight, flexible, and responsive functional materials, with applications in actuators [3], sensors [4], and energy harvesting devices [5][6].”
Wang, Z., Li, H., Qin, A., Zhang, W., Zhang, Y., Huang, J., & Zhang, F. (2025) · ACS Applied Polymer Materials · doi:10.1021/acsapm.5c02645
Self-citationConstant Charge Characteristics of TENG in Wireless Energy Transmission
Sun, J., Sun, H., Gao, W., Qi, C., Zhi, J., Ma, J., Yang, Z., Liu, S., & Qin, Y. (2025) · ACS Applied Materials & Interfaces · doi:10.1021/acsami.5c17256
Triboelectric nanogenerator based on inkjet-printed electrode for cultural relic protection
Liu, M., Zhu, K.-R., Wu, L., Zhang, J. P., & Long, Y. (2025) · Materials & Design · doi:10.1016/j.matdes.2025.115157
Yao, J., Fei, X., Yu, X., CHE, B., Gao, H., & Han, B. (2025) · Advanced Engineering Materials · doi:10.1002/adem.202502126
Chen, P., Li, M., Yu, B., Jiang, C., Liu, Y., Wang, S., Yan, W., Cong, Z., Guo, M., & Sun, Y. W. (2025) · Measurement · doi:10.1016/j.measurement.2025.119935
Rashid, M., Khan, A., & Hossain, G. (2025) · ACS Applied Materials & Interfaces · doi:10.1021/acsami.5c16911
ПЕРСПЕКТИВЫ РАЗВИТИЯ ТЕКСТИЛЬНЫХ ИЗДЕЛИЙ С ЗАДАННОЙ ЭЛЕКТРОПРОВОДНОСТЬЮ ("ЭЛЕКТРОТЕКСТИЛЬ")
Джамалович, А. Р. (2023) · Zenodo (CERN European Organization for Nuclear Research) · doi:10.5281/zenodo.8374253
TENG‐Based Wearable Biomechanical Sensors and Human–Machine Interface
Zi, Y., Guo, H., Wang, J., Zhang, C., Chen, X., & Zhao, Q. (2025) · Wiley eBooks · doi:10.1002/9783527837908.ch11
IoT-Based Heart Monitoring Using Digital Twin
Nalina, V., Shashank, S., Samarth, S., D’Souza, S., & Jayarekha, P. (2025) · Lecture notes in networks and systems · doi:10.1007/978-981-96-4142-0_38
Metadata
- Authors
- Fan, W., He, Q., Meng, K., Tan, X., Zhou, Z., Zhang, G., Yang, J., & Wang, Z. L.
- Affiliations
- Chongqing University (CN)
- Georgia Institute of Technology (US)
- Corresponding author
- Yang, Jin
- Wang, Zhong Lin
- Venue
- Science Advances
- Published
- 2020-03-13
- Volume
- 6
- Issue
- 11
- Pages
- eaay2840-eaay2840
- ISSN
- 2375-2548 (ISSN-L)
- PMC
- PMC7069695
- OpenAlex
- W3010850830
- Cited by
- 516
- References
- 51
- Citations by year
- 2026: 45 · 2025: 79 · 2024: 91 · 2023: 96 · 2022: 109 · 2021: 69 · 2020: 27
- FWCI
- 23.63
- Type
- journal article
- Language
- en
- Open access
- gold
- doi.org
- Licence
- cc-by-nc
- Locations
- Science Advances (publishedVersion, cc-by-nc)
- PubMed Central (publishedVersion, cc-by-nc)
- PubMed (publishedVersion)
- Funders
- National Natural Science Foundation of China (51675069)
- Topics
- Physical Sciences › Engineering › Biomedical Engineering › Advanced Sensor and Energy Harvesting Materials
- Physical Sciences › Engineering › Biomedical Engineering › Non-Invasive Vital Sign Monitoring
- Life Sciences › Neuroscience › Cellular and Molecular Neuroscience › Neuroscience and Neural Engineering
- Keywords
- sensor arrays, respiratory monitoring, wearable health monitoring, cardiovascular disease, sleep apnea, non-invasive monitoring, smart textiles
- MeSH terms
- Wearable Electronic Devices, Epidermis, Humans, Monitoring, Physiologic, Pulse, Respiration, Textiles, Reproducibility of Results, Biosensing Techniques, Telemedicine, Wireless Technology
About these checks
Registry, retraction, Cites and statistics results are computed, not judged, with one exception: a printed reference that no index lists is read once by a model before it counts as a citation error. Claims are extracted by a model and kept only when their quote appears verbatim in the text; each cited source is then checked, with a model’s help, for whether it says what the claim relies on. Those verdicts can be wrong — read the claim’s quote and the cited source before relying on one.
Statistics and arithmetic are recomputed, not judged.
Confidence bands are shown only for fields calibrated on our annotated test set. None is calibrated yet, so no band is shown.
What counts as a claim ›How we measure confidence ›How we check this ›
Are you an author, or do you see a problem with this page? Request a review
Data sources
Bibliographic data: Semantic Scholar, OpenAlex, Crossref.
Contains information from the Semantic Scholar Academic Graph Datasets, made available under the ODC Attribution License (ODC-BY 1.0).
Semantic Scholar’s data is described in: Kinney, R., et al. (2023). The Semantic Scholar Open Data Platform. arXiv:2301.10140.
