

The DOI matches its Crossref record; 19 of the 19 references it cites were found in a registry or an index.
Rapid implementation of mobile technology for real-time epidemiology of COVID-19
Open accessPublished version of a preprint
Abstract
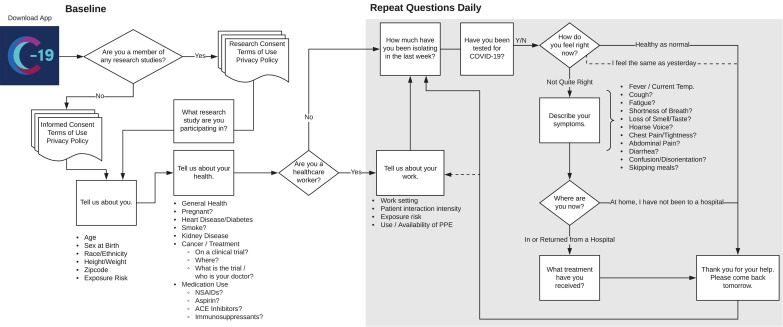
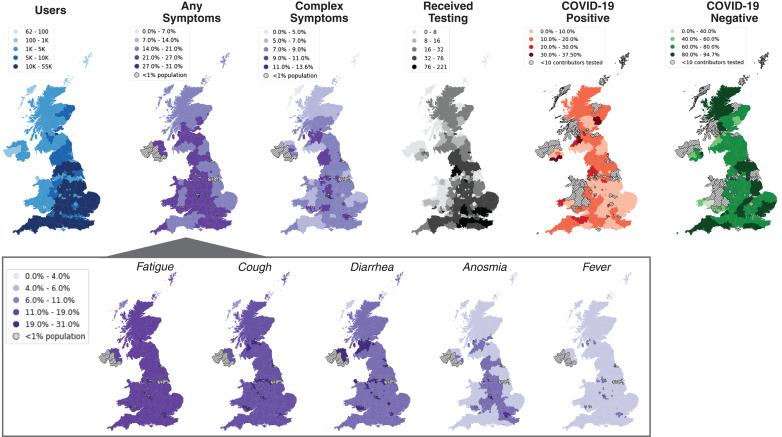
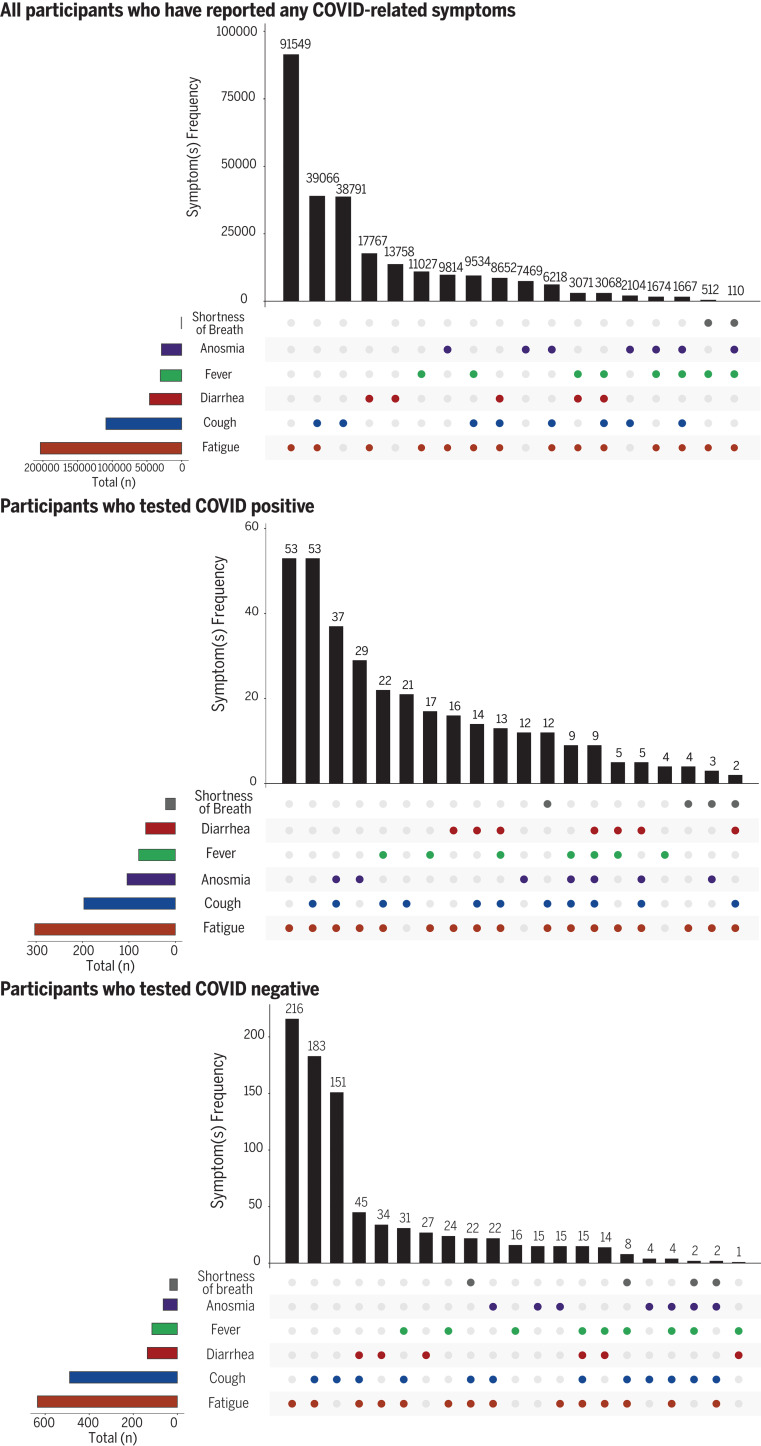
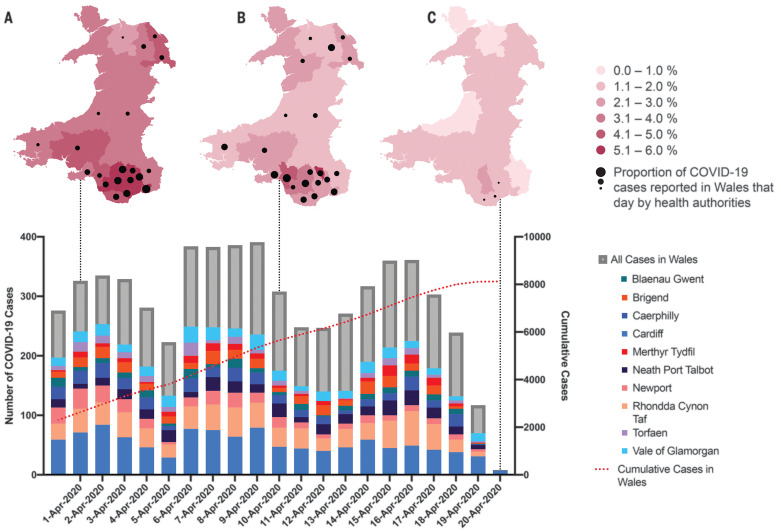
Mobile symptom tracking: The rapidity with which severe acute respiratory syndrome coronavirus 2 (SARS-CoV-2) spreads through a population is defying attempts at tracking it, and quantitative polymerase chain reaction testing so far has been too slow for real-time epidemiology. Taking advantage of existing longitudinal health care and research patient cohorts, Drew et al. pushed software updates to participants to encourage reporting of potential coronavirus disease 2019 (COVID-19) symptoms. The authors recruited about 2 million users (including health care workers) to the COVID Symptom Study (previously known as the COVID Symptom Tracker) from across the United Kingdom and the United States. The prevalence of combinations of symptoms (three or more), including fatigue and cough, followed by diarrhea, fever, and/or anosmia, was predictive of a positive test verification for SARS-CoV-2. As exemplified by data from Wales, United Kingdom, mathematical modeling predicted geographical hotspots of incidence 5 to 7 days in advance of official public health reports. Science , this issue p. 1362
Overview
The claims and statistics of this paper haven’t been checked yet.
Run the check — free, no account needed. It reads the open-access text and checks the sources it cites.
Integrity signals
Registry
Cites
Statistics
Figures
Verification
Claims the paper makes
The claims and statistics of this paper haven’t been checked yet.
Run the check — free, no account needed. It reads the open-access text and checks the sources it cites.
Self-check
Percentages, sums and reported differences re-computed from the paper’s own numbers.
The self-check needs the paper’s full text.
Citations
Cites
Clinical features of patients infected with 2019 novel coronavirus in Wuhan, China
Huang, C., Wang, Y., Li, X., Ren, L., Zhao, J., Hu, Y., Zhang, L., Fan, G., Xu, J., Gu, X., et al. (2020) · The Lancet · doi:10.1016/s0140-6736(20)30183-5 · Cited by 48,884
Clinical characteristics of coronavirus disease 2019 in China
Guan, W.-J., Ni, Z.-Y., Hu, Y., Liang, W.-H., Ou, C.-Q., He, J.-X., Liu, L., Shan, H., Lei, C.-L., Hui, D. S. C., et al. (2020) · New England Journal of Medicine · doi:10.1056/nejmoa2002032 · Cited by 30,246
Zhou, F., Yu, T., Du, R., Fan, G., Liu, Y., Liu, Z., Xiang, J., Wang, Y., Song, B., Gu, X., et al. (2020) · The Lancet · doi:10.1016/s0140-6736(20)30566-3 · Cited by 27,263
Chen, N., Zhou, M., Dong, X., Qu, J., Gong, F., Han, Y., Qiu, Y., Wang, J., Liu, Y., Wei, Y., et al. (2020) · The Lancet · doi:10.1016/s0140-6736(20)30211-7 · Cited by 21,415
Wang, D., Hu, B., Hu, C., Zhu, F., Liu, X., Zhang, J., Wang, B., Xiang, H., Cheng, Z., Xiong, Y., et al. (2020) · JAMA · doi:10.1001/jama.2020.1585 · Cited by 20,148
La certeza de lo impredecible: Cultura Educación y Sociedad en tiempos de COVID19
Martínez González, M. (2020) · DSPACE System - Metalibrary (University of the Coast) · Cited by 18,463
Yang, X., Yu, Y., Xu, J., Shu, H., Xia, J., Liu, H., Wu, Y., Zhang, L., Yu, Z., Fang, M., et al. (2020) · The Lancet Respiratory Medicine · doi:10.1016/s2213-2600(20)30079-5 · Cited by 10,066
Wu, C., Chen, X., Cai, Y., Xia, J., Zhou, X., Xu, S., Huang, H., Zhang, L., Zhou, X., Du, C., et al. (2020) · JAMA Internal Medicine · doi:10.1001/jamainternmed.2020.0994 · Cited by 8,249
Are patients with hypertension and diabetes mellitus at increased risk for COVID-19 infection?
Fang, L., Karakiulakis, G., & Roth, M. (2020) · The Lancet Respiratory Medicine · doi:10.1016/s2213-2600(20)30116-8 · Cited by 2,947
Xu, X., Wu, X., Jiang, X., Xu, K., Ying, L.-J., Ma, C., Li, S., Wang, H., Zhang, S., Gao, H., et al. (2020) · BMJ · doi:10.1136/bmj.m606 · Cited by 2,068
Cited by
Sorted by citations
Attributes and predictors of long COVID
Sudre, C. H., Murray, B., Varsavsky, T., Graham, M. S., Penfold, R. S., Bowyer, R. C., Pujol, J. C., Klaser, K., Antonelli, M., Canas, L. S., et al. (2021) · Nature Medicine · doi:10.1038/s41591-021-01292-y · Cited by 2,707
Self-citationNguyen, L. H., Drew, D. A., Graham, M. S., Joshi, A. D., Guo, C., Ma, W., Mehta, R. S., Warner, E. T., Sikavi, D. R., Lo, C., et al. (2020) · The Lancet Public Health · doi:10.1016/s2468-2667(20)30164-x · Cited by 2,454
Self-citationReal-time tracking of self-reported symptoms to predict potential COVID-19
Menni, C., Valdes, A. M., Freidin, M. B., Sudre, C. H., Nguyen, L. H., Drew, D. A., Ganesh, S., Varsavsky, T., Cardoso, M. J., El-Sayed Moustafa, J. S., et al. (2020) · Nature Medicine · doi:10.1038/s41591-020-0916-2 · Cited by 1,517
Self-citationMenni, C., Klaser, K., May, A., Polidori, L., Capdevila, J., Louca, P., Sudre, C. H., Nguyen, L. H., Drew, D. A., Merino, J., et al. (2021) · The Lancet Infectious Diseases · doi:10.1016/s1473-3099(21)00224-3 · Cited by 1,031
Self-citationAutonomic dysfunction in ‘long COVID’: rationale, physiology and management strategies
Dani, M., Dirksen, A., Taraborrelli, P., Torocastro, M., Panagopoulos, D., Sutton, R., & Lim, P. B. (2020) · Clinical Medicine · doi:10.7861/clinmed.2020-0896 · Cited by 769
Metadata
- Authors
- Drew, D. A., Nguyen, L. H., Steves, C. J., Menni, C., Freydin, M., Varsavsky, T., Sudre, C. H., Cardoso, M. J., Ourselin, S., Wolf, J., Spector, T. D., Chan, A. T., COPE Consortium, Chan, A. T., Drew, D. A., Nguyen, L. H., Joshi, A. D., Guo, C.-G., Ma, W., Lo, C.-H., Mehta, R. S., Kwon, S., Sikavi, D. R., Magicheva-Gupta, M. V., Fatehi, Z. S., Flynn, J. J., Leonardo, B. M., Albert, C. M., Andreotti, G., Beane-Freeman, L. E., Balasubramanian, B. A., Brownstein, J. S., Bruinsma, F., Cowan, A. N., Deka, A., Ernst, M. E., Figueiredo, J. C., Franks, P. W., Gardner, C. D., Ghobrial, I. M., Haiman, C. A., Hall, J. E., Deming-Halverson, S. L., Kirpach, B., Lacey, J. V., Le Marchand, L., Marinac, C. R., Martinez, M. E., Milne, R. L., Murray, A. M., Nash, D., Palmer, J. R., Patel, A. V., Rosenberg, L., Sandler, D. P., Sharma, S. V., Schurman, S. H., Wilkens, L. R., Chavarro, J. E., Eliassen, A. H., Hart, J. E., Kang, J. H., Koenen, K. C., Kubzansky, L. D., Mucci, L. A., Ourselin, S., Rich-Edwards, J. W., Song, M., Stampfer, M. J., Steves, C. J., Willett, W. C., Wolf, J., & Spector, T.
- Affiliations
- King's College London (GB)
- Department of Twin Research and Genetic Epidemiology, King’s College London, Westminster Bridge Road, London SE1 7EH, UK.
- Harvard University (US)
- ORCID
- Menni, Cristina
- Freydin, Maxim
- Varsavsky, Thomas
- Sudre, Carole H.
- Cardoso, M. Jorge
- Spector, Tim D.
- Joshi, Amit D.
- Guo, Chuan-Guo
- Ma, Wenjie
- Lo, Chun-Han
- Kwon, Sohee
- Magicheva-Gupta, Marina V.
- Fatehi, Zahra S.
- Albert, Christine M.
- Andreotti, Gabriella
- Balasubramanian, Bijal A.
- Brownstein, John S.
- Bruinsma, Fiona
- Cowan, Annie N.
- Deka, Anusila
- Ernst, Michael E.
- Figueiredo, Jane C.
- Franks, Paul W.
- Gardner, Christopher D.
- Ghobrial, Irene M.
- Haiman, Christopher A.
- Hall, Janet E.
- Kirpach, Brenda
- Lacey, James V.
- Marinac, Catherine R.
- Milne, Roger L.
- Murray, Anne M.
- Nash, Denis
- Palmer, Julie R.
- Patel, Alpa V.
- Rosenberg, Lynn
- Sandler, Dale P.
- Sharma, Shreela V.
- Schurman, Shepherd H.
- Wilkens, Lynne R.
- Chavarro, Jorge E.
- Eliassen, A. Heather
- Kang, Jae Hee
- Koenen, Karestan C.
- Kubzansky, Laura D.
- Mucci, Lorelei A.
- Rich-Edwards, Janet W.
- Song, Mingyang
- Stampfer, Meir J.
- Willett, Walter C.
- Venue
- Science
- Published
- 2020-06-19
- Volume
- 368
- Issue
- 6497
- Pages
- 1362-1367
- ISSN
- 0036-8075 (ISSN-L)
- 1095-9203
- PMC
- PMC7200009
- OpenAlex
- W3022622144
- Cited by
- 389
- References
- 19
- Citations by year
- 2026: 8 · 2025: 9 · 2024: 23 · 2023: 47 · 2022: 82 · 2021: 119 · 2020: 101
- FWCI
- 62.76
- Type
- journal article
- Language
- en
- Open access
- hybrid
- doi.org
- Licence
- Locations
- Science (publishedVersion, cc-by)
- medRxiv (acceptedVersion, cc-by-nc-nd)
- PubMed Central (publishedVersion, cc-by)
- PubMed (publishedVersion)
- Archivio Istituzionale della Ricerca (Universita Degli Studi Di Milano) (submittedVersion, other-oa)
- UCL Discovery (University College London) (submittedVersion)
- Research Portal (King's College London) (submittedVersion, cc-by)
- Funders
- Massachusetts General Hospital (Stuart and Suzanne Steele MGH Research Scholar Award)
- Wellcome Trust Centre for Mitochondrial Research
- Zoe Global Ltd.
- Topics
- Health Sciences › Medicine › Epidemiology › Data-Driven Disease Surveillance
- Physical Sciences › Computer Science › Information Systems › COVID-19 Digital Contact Tracing
- Health Sciences › Health Professions › General Health Professions › Mobile Health and mHealth Applications
- Keywords
- COVID-19 pandemic, SARS-CoV-2, mobile health apps, symptom monitoring, big data, risk factors, clinical outcomes, pandemic response
- MeSH terms
- Betacoronavirus, Big Data, COVID-19, SARS-CoV-2, Data Collection, United Kingdom, Humans, International Cooperation, Models, Theoretical, Pneumonia, Viral, United States, Global Health, Coronavirus Infections, Pandemics, Mobile Applications
About these checks
Registry, retraction, Cites and statistics results are computed, not judged, with one exception: a printed reference that no index lists is read once by a model before it counts as a citation error. Claims are extracted by a model and kept only when their quote appears verbatim in the text; each cited source is then checked, with a model’s help, for whether it says what the claim relies on. Those verdicts can be wrong — read the claim’s quote and the cited source before relying on one.
Statistics and arithmetic are recomputed, not judged.
Confidence bands are shown only for fields calibrated on our annotated test set. None is calibrated yet, so no band is shown.
What counts as a claim ›How we measure confidence ›How we check this ›
Are you an author, or do you see a problem with this page? Request a review
