

The DOI matches its Crossref record; 24 of the 24 references it cites were found in a registry or an index.
Household COVID-19 risk and in-person schooling
Open accessPublished version of a preprint
Abstract
Back to school—safely: Severe COVID-19 in children is rare, but many schools remain closed because the transmission risk that school contact poses to adults and the wider community is unknown. Observing the heterogeneity of approaches taken among U.S. school districts, Lessler et al. investigated how different strategies influence COVID-19 transmission rates in the wider community using COVID-19 Symptom Survey data from Carnegie Mellon and Facebook. The authors found that when mitigation measures are in place, transmission within schools is limited and infection rates mirror that of the surrounding community. Science , abh2939, this issue p. 1092
Overview
The claims and statistics of this paper haven’t been checked yet.
Run the check — free, no account needed. It reads the open-access text and checks the sources it cites.
Integrity signals
Registry
Cites
Statistics
Figures
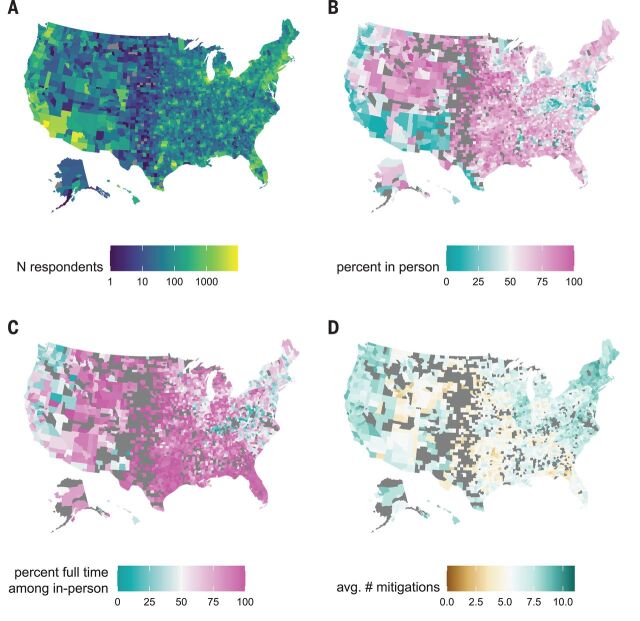
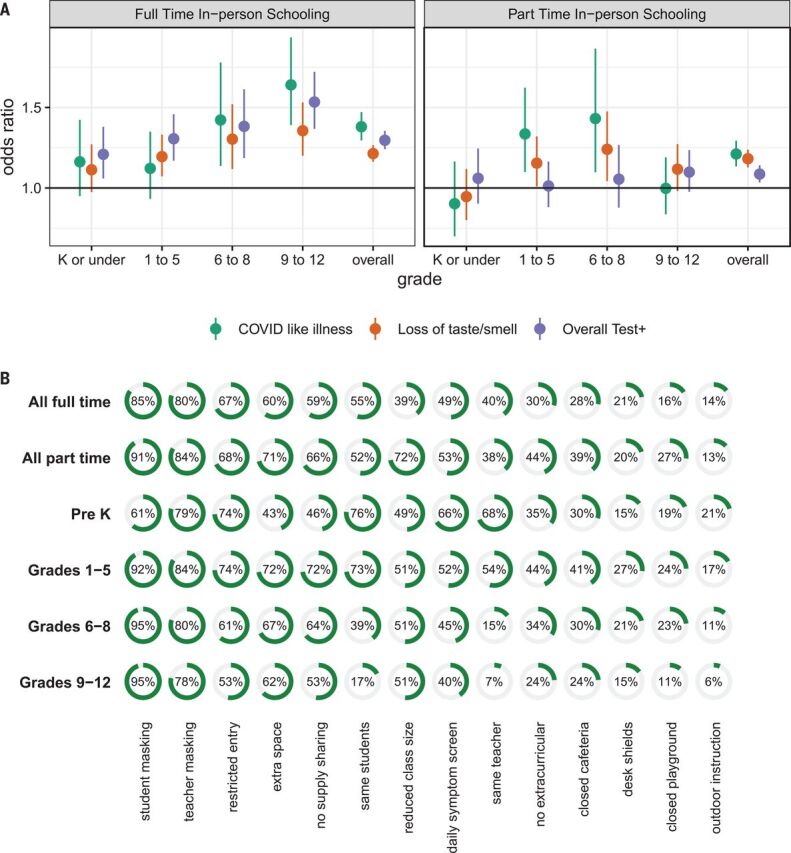
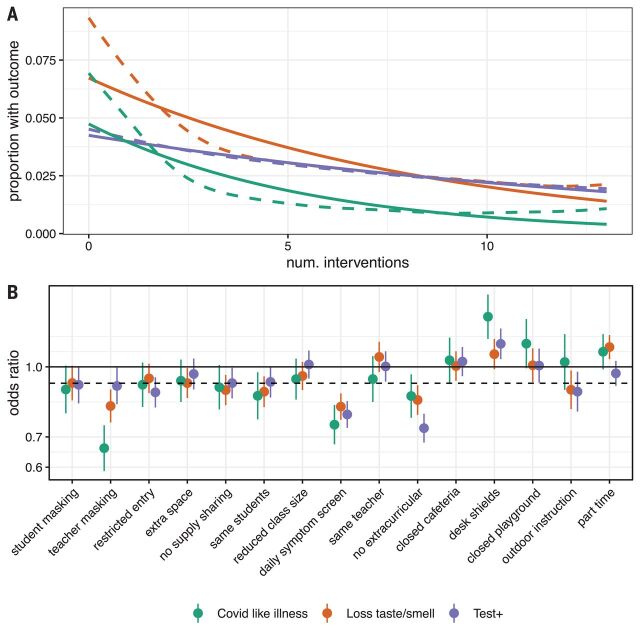
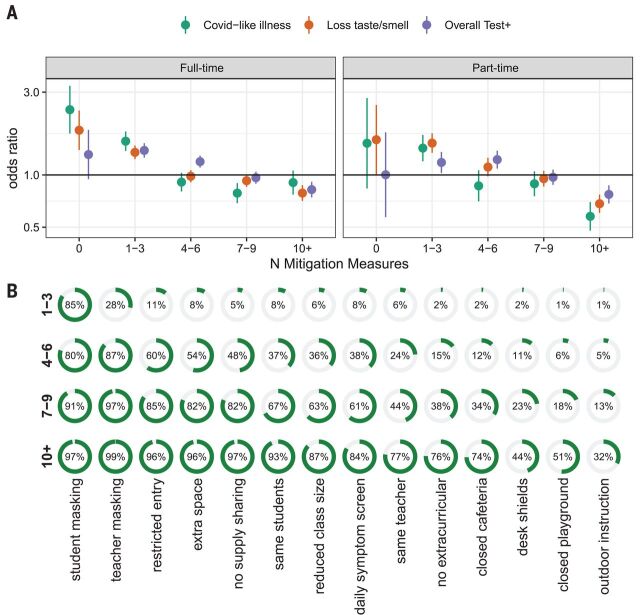
Verification
Claims the paper makes
The claims and statistics of this paper haven’t been checked yet.
Run the check — free, no account needed. It reads the open-access text and checks the sources it cites.
Claims other papers make about this one
Each is checked against this paper’s own text: does it say what the citing paper says it does?
In the citing paper
“it is possible to keep schools open without putting students and adults at excessive risk.”
From The Lancet Commission on lessons for the future from the COVID-19 pandemic (2022) · cites this paper as [319]
Self-check
Percentages, sums and reported differences re-computed from the paper’s own numbers.
The self-check needs the paper’s full text.
Citations
Cites
An interactive web-based dashboard to track COVID-19 in real time
Dong, E., Du, H., & Gardner, L. (2020) · The Lancet Infectious Diseases · doi:10.1016/s1473-3099(20)30120-1 · Cited by 10,048
ranger : A Fast Implementation of Random Forests for High Dimensional Data in C++ and R
Wright, M. N., & Ziegler, A. (2017) · Journal of Statistical Software · doi:10.18637/jss.v077.i01 · Cited by 4,185
Estimating the effects of non-pharmaceutical interventions on COVID-19 in Europe
Flaxman, S. R., Mishra, S., Gandy, A., Unwin, H. J. T., Mellan, T. A., Coupland, H., Whittaker, C., Zhu, H., Berah, T., Eaton, J. W., et al. (2020) · Nature · doi:10.1038/s41586-020-2405-7 · Cited by 3,398
Changes in contact patterns shape the dynamics of the COVID-19 outbreak in China
Zhang, J., Litvinova, M., Liang, Y., Wang, Y., Wang, W., Zhao, S., Wu, Q., Merler, S., Viboud, C., Vespignani, A., et al. (2020) · Science · doi:10.1126/science.abb8001 · Cited by 1,107
Susceptibility to SARS-CoV-2 Infection Among Children and Adolescents Compared With Adults
Viner, R., Mytton, O. T., Bonell, C. P., Meléndez‐Torres, G. J., Ward, J., Hudson, L. D., Waddington, C. S., Thomas, J., Russell, S., van der Klis, F. R. M., et al. (2020) · Archives of Pediatrics and Adolescent Medicine · doi:10.1001/jamapediatrics.2020.4573 · Cited by 893
Li, Y., Campbell, H. J., Kulkarni, D., Harpur, A., Nundy, M., Wang, X., & Nair, H. (2020) · The Lancet Infectious Diseases · doi:10.1016/s1473-3099(20)30785-4 · Cited by 446
A large COVID-19 outbreak in a high school 10 days after schools’ reopening, Israel, May 2020
Stein‐Zamir, C., Abramson, N., Shoob, H., Libal, E., Bitan, M., Cardash, T., Cayam, R., & Miskin, I. N. (2020) · Eurosurveillance · doi:10.2807/1560-7917.es.2020.25.29.2001352 · Cited by 409
Ismail, S., Saliba, V., Bernal, J. L., Ramsay, M. E., & Ladhani, S. N. (2020) · The Lancet Infectious Diseases · doi:10.1016/s1473-3099(20)30882-3 · Cited by 332
SARS-CoV-2 Transmission and Infection Among Attendees of an Overnight Camp — Georgia, June 2020
Szablewski, C. M., Chang, K. T., Brown, M. M., Chu, V. T., Yousaf, A. R., Anyalechi, N., Aryee, P. A., Kirking, H. L., Lumsden, M., Mayweather, E., et al. (2020) · MMWR. Morbidity and Mortality Weekly Report · doi:10.15585/mmwr.mm6931e1 · Cited by 214
Falk, A., Benda, A., Falk, P., Steffen, S., Wallace, Z., & Høeg, T. B. (2021) · MMWR Morbidity and Mortality Weekly Report · doi:10.15585/mmwr.mm7004e3 · Cited by 165
The effects of school closures on SARS-CoV-2 among parents and teachers
Vlachos, J., Hertegård, E., & Svaleryd, H. (2021) · Proceedings of the National Academy of Sciences · doi:10.1073/pnas.2020834118 · Cited by 148
Lopez, A. S., Hill, M., Antezano, J., Vilven, D., Rutner, T., Bogdanow, L., Claflin, C., Kracalik, I. T., Fields, V. L., Dunn, A. C., et al. (2020) · MMWR Morbidity and Mortality Weekly Report · doi:10.15585/mmwr.mm6937e3 · Cited by 146
Insights into household transmission of SARS-CoV-2 from a population-based serological survey
Bi, Q., Lessler, J., Eckerle, I., Lauer, S. A., Kaiser, L., Vuilleumier, N., Cummings, D. A. T., Flahault, A., Petrovic, D., Guessous, I., et al. (2021) · Nature Communications · doi:10.1038/s41467-021-23733-5 · Cited by 109
Self-citationwsrf : An R Package for Classification with Scalable Weighted Subspace Random Forests
Zhao, H., Williams, G. J., & Huang, J. Z. (2017) · Journal of Statistical Software · doi:10.18637/jss.v077.i03 · Cited by 91
Open Schools, Covid-19, and Child and Teacher Morbidity in Sweden
Ludvigsson, J. F., Engerström, L., Nordenhäll, C., & Larsson, E. (2021) · New England Journal of Medicine · doi:10.1056/nejmc2026670 · Cited by 90
The role of schools and school-aged children in SARS-CoV-2 transmission
Flasche, S., & Edmunds, W. J. (2020) · The Lancet Infectious Diseases · doi:10.1016/s1473-3099(20)30927-0 · Cited by 64
Yang, B., Huang, A. T., García‐Carreras, B., Hart, W. E., Staid, A., Hitchings, M. D. T., Lee, E. C., Howe, C. J., Grantz, K. H., Wesolowski, A., et al. (2021) · Nature Communications · doi:10.1038/s41467-021-23865-8 · Cited by 63
Self-citationPartnering with a global platform to inform research and public policy making
Kreuter, F., Barkay, N., Bilinski, A., Bradford, A., Chiu, S., Eliat, R., Fan, J., Galili, T., Haimovich, D., Kim, B., et al. (2020) · Survey research methods · doi:10.18148/srm/2020.v14i2.7761 · Cited by 52
Self-citationBarkay, N., Cobb, C., Eilat, R., Galili, T., Haimovich, D., LaRocca, S., Morris, K., & Sarig, T. (2020) · arXiv · doi:10.48550/arxiv.2009.14675 · Cited by 48
Household Transmission of SARS-CoV-2: Insights from a Population-based Serological SurveyPreprint
Bi, Q., Lessler, J., Eckerle, I. A., et al. (2020) · medRxiv · doi:10.1101/2020.11.04.20225573 · Cited by 33
Self-citationYang, B., Huang, A. T., García‐Carreras, B., et al. (2020) · medRxiv · doi:10.1101/2020.10.29.20221036 · Cited by 19
Consistency between Household and County Measures of Onsite Schooling during the COVID-19 Pandemic
Lupton‐Smith, C., Goicoechea, E. B., Collins, M. E., Lessler, J., Grabowski, M. K., & Stuart, E. A. (2022) · Journal of Research on Educational Effectiveness · doi:10.1080/19345747.2022.2131660 · Cited by 6
Self-citationHopkinsIDD/inperson-schooling-covid-survey: second release with updated supplement
Lessler, J., Grabowski, M. K., Grantz, K. H., et al. (2021) · Zenodo (CERN European Organization for Nuclear Research) · doi:10.5281/zenodo.4710757 · Cited by 1
Self-citationHopkinsIDD/inperson-schooling-covid-survey: initial release
Lessler, J., Grabowski, M. K., Grantz, K. H., Badillo-Goicoechea, E., Metcalf, C. J. E., Lupton-Smith, C. P., Azman, A. S., & Stuart, E. A. (2021) · Zenodo (CERN European Organization for Nuclear Research) · doi:10.5281/zenodo.4635397 · Cited by 1
Self-citation
Cited by
Sorted by citations
Airborne transmission of respiratory viruses
Wang, C. C., Prather, K. A., Sznitman, J., Jimenez, J. L., Lakdawala, S. S., Tüfekçi, Z., & Marr, L. C. (2021) · Science · doi:10.1126/science.abd9149 · Cited by 1,631
The Lancet Commission on lessons for the future from the COVID-19 pandemic
Sachs, J. D., Karim, S. S. A., Aknin, L., Allen, J., Brosbøl, K., Colombo, F., Barron, G. C., Espinosa, M. F., Gaspar, V., Gaviria, A., et al. (2022) · The Lancet · doi:10.1016/s0140-6736(22)01585-9 · Cited by 842
Mendez-Brito, A., El Bcheraoui, C., & Pozo-Martin, F. (2021) · Journal of Infection · doi:10.1016/j.jinf.2021.06.018 · Cited by 269
Escandón-Vargas, K., Rasmussen, A. L., Bogoch, I. I., Murray, E. J., Escandón, K., Popescu, S. V., & Kindrachuk, J. (2021) · BMC Infectious Diseases · doi:10.1186/s12879-021-06357-4 · Cited by 206
Salomon, J. A., Reinhart, A., Bilinski, A., Chua, E. J., Motte‐Kerr, W. L., Rönn, M. M., Reitsma, M. B., Morris, K. A., LaRocca, S., Farag, T. H., et al. (2021) · Proceedings of the National Academy of Sciences · doi:10.1073/pnas.2111454118 · Cited by 159
Metadata
- Authors
- Lessler, J., Grabowski, M. K., Grantz, K. H., Badillo-Goicoechea, E., Metcalf, C. J. E., Lupton-Smith, C., Azman, A. S., & Stuart, E. A.
- Affiliations
- Johns Hopkins University (US)
- Department of Mental Health, Johns Hopkins Bloomberg School of Public Health, Baltimore, MD, USA.
- Princeton University (US)
- Department of Biostatistics, Johns Hopkins Bloomberg School of Public Health, Baltimore, MD, USA.
- University of Geneva (CH)
- Corresponding author
- Lessler, Justin
- ORCID
- Venue
- Science
- Published
- 2021-06-04
- Volume
- 372
- Issue
- 6546
- Pages
- 1092-1097
- ISSN
- 0036-8075 (ISSN-L)
- 1095-9203
- PMC
- PMC8168618
- OpenAlex
- W3157264684
- Cited by
- 233
- References
- 21
- Citations by year
- 2026: 14 · 2025: 15 · 2024: 28 · 2023: 42 · 2022: 61 · 2021: 73
- FWCI
- 19.72
- Type
- journal article
- Language
- en
- Open access
- hybrid
- doi.org
- Licence
- Locations
- Science (publishedVersion, cc-by)
- medRxiv (acceptedVersion, cc-by)
- PubMed Central (publishedVersion, cc-by)
- PubMed (publishedVersion)
- Archive ouverte UNIGE (University of Geneva) (submittedVersion, cc-by)
- Funders
- U.S. Department of Health and Human Services
- Johns Hopkins University
- Topics
- Physical Sciences › Mathematics › Modeling and Simulation › COVID-19 epidemiological studies
- Social Sciences › Education › Education during COVID-19 pandemic
- Health Sciences › Medicine › Infectious Diseases › SARS-CoV-2 and COVID-19 Research
- Keywords
- COVID-19 pandemic, in-person schooling, household transmission, symptom screening, extracurricular activities, teachers, occupational risk, SARS-CoV-2
- MeSH terms
- School Teachers, Physical Distancing, COVID-19, Adolescent, Child, Child, Preschool, Communicable Disease Control, Family Characteristics, Humans, Masks, Surveys and Questionnaires, Schools, Students, United States, Risk Assessment
About these checks
Registry, retraction, Cites and statistics results are computed, not judged, with one exception: a printed reference that no index lists is read once by a model before it counts as a citation error. Claims are extracted by a model and kept only when their quote appears verbatim in the text; each cited source is then checked, with a model’s help, for whether it says what the claim relies on. Those verdicts can be wrong — read the claim’s quote and the cited source before relying on one.
Statistics and arithmetic are recomputed, not judged.
Confidence bands are shown only for fields calibrated on our annotated test set. None is calibrated yet, so no band is shown.
What counts as a claim ›How we measure confidence ›How we check this ›
Are you an author, or do you see a problem with this page? Request a review
