

The DOI matches its Crossref record; 50 of the 50 references it cites were found in a registry or an index.
Immune correlates analysis of the mRNA-1273 COVID-19 vaccine efficacy clinical trial
Open accessPublished version of a preprint
Abstract
Antibody levels predict vaccine efficacy: Symptomatic COVID-19 infection can be prevented by severe acute respiratory syndrome coronavirus 2 (SARS-CoV-2) vaccines. A “correlate of protection” is a molecular biomarker to measure how much immunity is needed to fight infection and is key for successful global immunization programs. Gilbert et al . determined that antibodies are the correlate of protection in vaccinated individuals enrolled in the Moderna COVE phase 3 clinical trial (see the Perspective by Openshaw). By measuring binding and neutralizing antibodies against the viral spike protein, the authors found that the levels of both antibodies correlated with the degree of vaccine efficacy. The higher the antibody level, the greater the protection afforded by the messenger RNA (mRNA) vaccine. Antibody levels that predict mRNA vaccine efficacy can therefore be used to guide vaccine regimen modifications and support regulatory approvals for a broader spectrum of the population. —PNK
Overview
The claims and statistics of this paper haven’t been checked yet.
Run the check — free, no account needed. It reads the open-access text and checks the sources it cites.
Integrity signals
Registry
Cites
Statistics
Figures
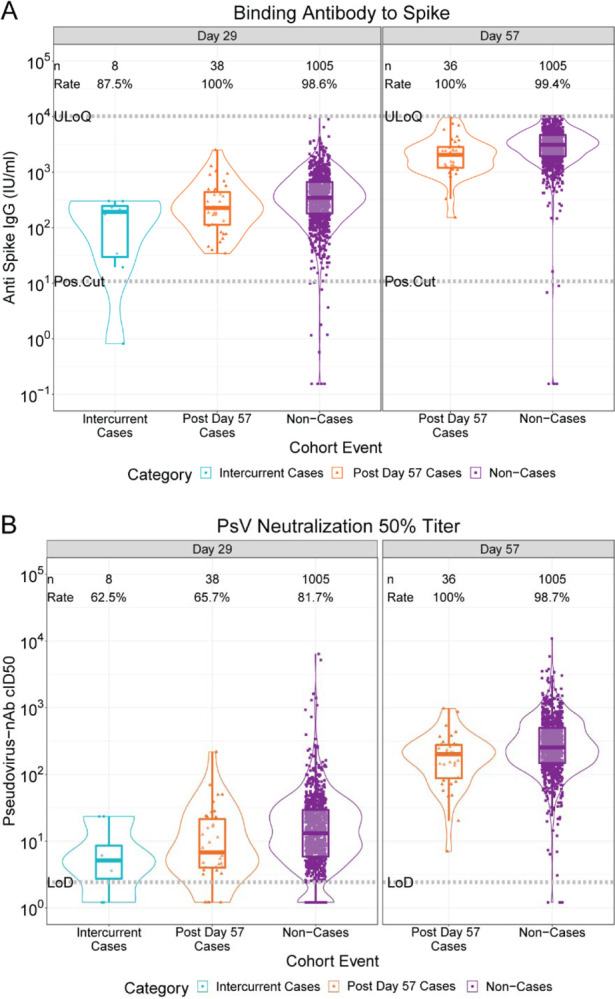
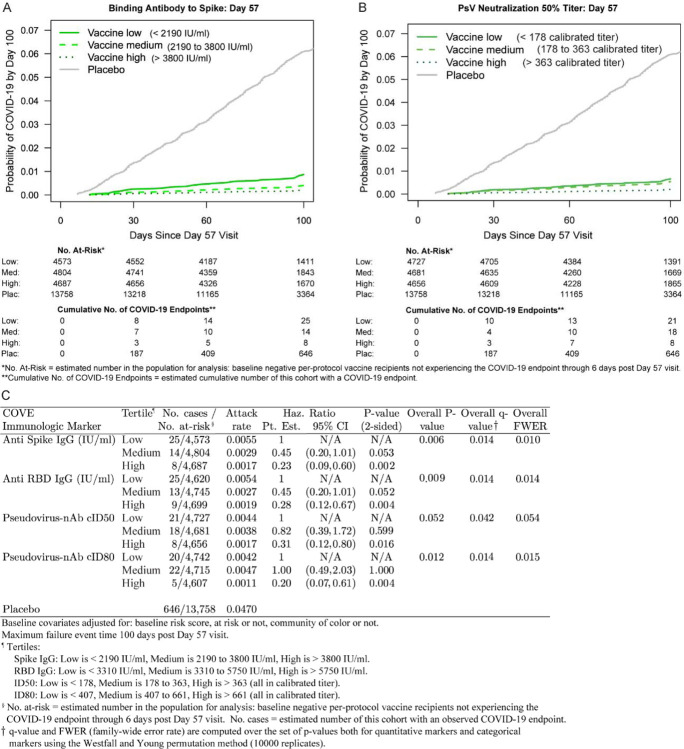
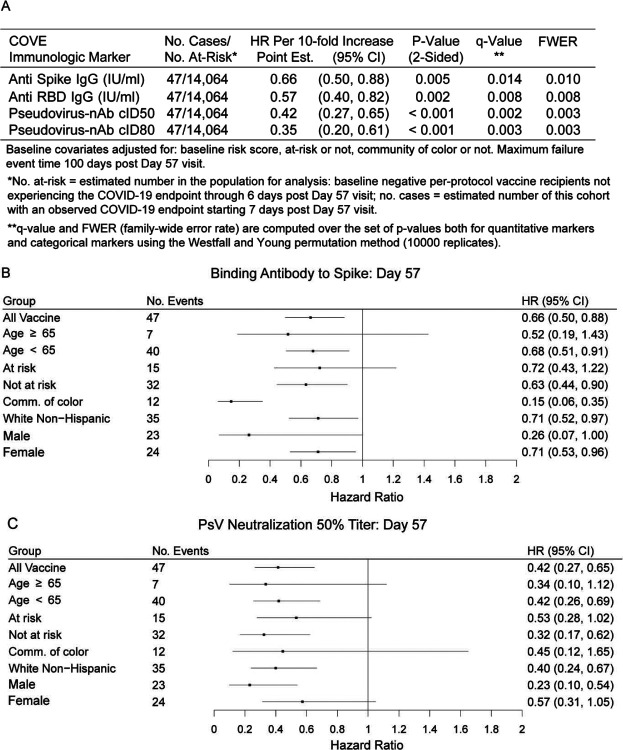
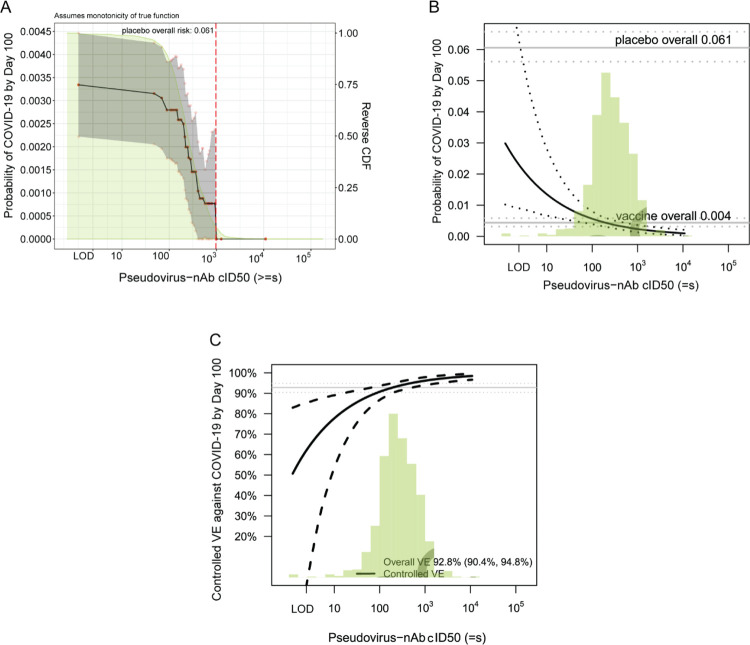
Verification
Claims the paper makes
The claims and statistics of this paper haven’t been checked yet.
Run the check — free, no account needed. It reads the open-access text and checks the sources it cites.
Claims other papers make about this one
Each is checked against this paper’s own text: does it say what the citing paper says it does?
The cited source says what the claim attributes to it.
In the citing paper
“Neutralizing antibodies in the sera of the participants will be assessed since they have been identified as one of the key parameters correlating with the observed protective efficacy of the first generation SARS-CoV-2 mRNA vaccine CVnCoV27, and a licensed COVID-19 mRNA vaccine28.”
From Efficacy of an unmodified bivalent mRNA vaccine against SARS-CoV-2 variants in female small animal models (2023) · cites this paper as [28]
Self-check
Percentages, sums and reported differences re-computed from the paper’s own numbers.
The self-check needs the paper’s full text.
Citations
Cites
Generalized Additive Models: An Introduction with R
Wood, S. N. (2017) · doi:10.1201/9781315370279 · Cited by 13,852
Efficacy and Safety of the mRNA-1273 SARS-CoV-2 Vaccine
Baden, L. R., El Sahly, H. M., Essink, B., Kotloff, K., Frey, S., Novak, R., Diemert, D., Spector, S. A., Rouphael, N., Creech, C. B., et al. (2021) · New England Journal of Medicine · doi:10.1056/nejmoa2035389 · Cited by 10,119
Self-citationCryo-EM structure of the 2019-nCoV spike in the prefusion conformation
Wrapp, D., Wang, N., Corbett, K. S., Goldsmith, J. A., Hsieh, C.-L., Abiona, O., Graham, B. S., & McLellan, J. S. (2020) · Science · doi:10.1126/science.abb2507 · Cited by 8,897
Sensitivity analysis in observational research: Introducing the E-value
VanderWeele, T. J., & Ding, P. (2017) · Annals of Internal Medicine · doi:10.7326/m16-2607 · Cited by 6,350
Structure of the SARS-CoV-2 spike receptor-binding domain bound to the ACE2 receptor
Lan, J., Ge, J., Yu, J., Shan, S., Zhou, H., Fan, S., Zhang, Q., Shi, X., Wang, Q., Zhang, L., et al. (2020) · Nature · doi:10.1038/s41586-020-2180-5 · Cited by 5,983
Self-citationVoysey, M., Clemens, S. A. C., Madhi, S. A., Weckx, L. Y., Folegatti, P. M., Aley, P. K., Angus, B., Baillie, V. L., Barnabas, S. L., Bhorat, Q. E., et al. (2021) · The Lancet · doi:10.1016/s0140-6736(20)32661-1 · Cited by 4,616
Khoury, D. S., Cromer, D., Reynaldi, A., Schlub, T. E., Wheatley, A. K., Juno, J. A., Subbarao, K., Kent, S. J., Triccas, J. A., & Davenport, M. P. (2021) · Nature Medicine · doi:10.1038/s41591-021-01377-8 · Cited by 3,742
An mRNA Vaccine against SARS-CoV-2 — Preliminary Report
Jackson, L. A., Anderson, E. J., Rouphael, N. G., Roberts, P. C., Makhene, M., Coler, R. N., McCullough, M. P., Chappell, J. D., Denison, M. R., Stevens, L. J., et al. (2020) · New England Journal of Medicine · doi:10.1056/nejmoa2022483 · Cited by 3,237
Self-citationCell entry mechanisms of SARS-CoV-2
Shang, J., Wan, Y., Luo, C., Ye, G., Geng, Q., Auerbach, A., & Li, F. (2020) · Proceedings of the National Academy of Sciences · doi:10.1073/pnas.2003138117 · Cited by 3,142
Letko, M., Marzi, A., & Munster, V. (2020) · Nature Microbiology · doi:10.1038/s41564-020-0688-y · Cited by 3,109
Research works printed but not linked: 5
- Moderna “Moderna Announces TeenCOVE Study of its COVID-19 Vaccine in Adolescents Meets Primary Endpoint and Plans to Submit Data to Regulators in Early June” (press release 25 May 2021); https://investors.modernatx.com/news-releases/news-release-details/moderna-announces-teencove-study-its-covid-19-vaccine.
- S. A. Plotkin P. B. Gilbert in Plotkin’s Vaccines S. A. Plotkin W. A. Orenstein P. A. Offit K. M. Edwards Eds. (Elsevier seventh ed. 2018) chap. 3.
- Regeneron “Phase 3 Prevention Trial Showed 81% Reduced Risk of Symptomatic SARS-CoV-2 Infections with Subcutaneous Administration of REGEN-COV™ (casirivimab with imdevimab)” (press release 12 April 2021); https://investor.regeneron.com/news-releases/news-release-details/phase-3-prevention-trial-showed-81-reduced-risk-symptomatic-sars.
- 10.1016/S0140-6736(21)02046-8 · DOI
- P. H. Westfall S. S. Young Resampling-Based Multiple Testing: Examples and Methods for P-Value Adjustment vol. 279 of Wiley Series in Probability and Statistics (Wiley 1993).
Cited by
Sorted by citations
Items 901–1,000 of 1,001
Acer, Ö., Bahçe, Y. G., & Özüdoğru, O. (2024) · Current Microbiology · doi:10.1007/s00284-024-03689-7 · Cited by 1
Feng, S., Bibi, S., Aley, P. K., Cappuccini, F., Clutterbuck, E., Conlin, K., Ebrahimi, N., Eordogh, A., Faust, S. N., Felle, S., et al. (2025) · Journal of Infection · doi:10.1016/j.jinf.2025.106423 · Cited by 1
Rubio‐Casillas, A., Redwan, E. M. M. M., & Uversky, V. N. (2025) · Progress in molecular biology and translational science · doi:10.1016/bs.pmbts.2025.02.001 · Cited by 1
Liu, X., Qi, Y., Huang, T., Huang, L., Zhao, M.-X., Wang, Z., Dai, J., Wang, Y., Chen, J., Yang, X., et al. (2025) · Human Vaccines & Immunotherapeutics · doi:10.1080/21645515.2025.2502250 · Cited by 1
Ashby, E., Janes, H., Follmann, D. A., Gilbert, P. B., Zhou, H., Wang, X., Girard, B., Priddy, F. H., Kublin, J. G., Corey, L., et al. (2025) · American Journal of Epidemiology · doi:10.1093/aje/kwaf176 · Cited by 4
Self-citationDiemert, D. J., Graciaa, D. S., Zhang, B., Rouphael, N., Branche, A. R., Martin, T., Jackson, L. A., Presti, R. M., Kamidani, S., Mahgoub, S. M., et al. (2025) · Vaccine · doi:10.1016/j.vaccine.2025.127718 · Cited by 3
Self-citationvan Beek, L. F., He, X., Koks, M. S., Jongh, C. E. V. D. G., Roukens, A. H. E., Visser, L. G., Diavatopoulos, D. A., de Graaf, H., & de Jonge, M. I. (2025) · Vaccine · doi:10.1016/j.vaccine.2025.127749 · Cited by 1
Peters, M. Q., Young, A. L., Stolarczuk, J. E., Glad, M., Layton, E. D., Logue, J. K., Minkah, N. K., Chu, H. Y., Englund, J. A., Sather, D. N., et al. (2025) · Open Forum Infectious Diseases · doi:10.1093/ofid/ofaf599 · Cited by 2
Whitaker, J. A., Collins, M. H., Rebolledo, P. A., Dobrzynski, D., Samanovic, M. I., Hoft, D. F., Stephens, D. S., & Rostad, C. A. (2025) · Clinical Infectious Diseases · doi:10.1093/cid/ciaf412 · Cited by 1
Edge, R., Matthews, S., Ahani, B., Aksyuk, A. A., Clegg, L. E., Perez, J. L., Esser, M. T., Chang, L.-J., Hirsch, I., Villafana, T. L., et al. (2025) · Nature Communications · doi:10.1038/s41467-025-63972-4 · Cited by 1
Self-citationFong, Y., Huang, Y., Huang, Y., Woo, W., McGarry, A., Áñez, G., Dunkle, L. M., Cho, I., Houchens, C. R., Martins, K. A. O., et al. (2025) · Clinical Infectious Diseases · doi:10.1093/cid/ciaf558 · Cited by 1
Self-citationLuedtke, A. R., Fong, Y., van der Laan, L. W. P., Heng, F., Huang, Y., Lu, Y., Yu, C., Carpp, L. N., Roels, S., Gars, M. L., et al. (2025) · iScience · doi:10.1016/j.isci.2025.113660 · Cited by 1
Self-citationFollmann, D. A., Dang, L., Chu, E., Fintzi, J., Janes, H., Gilbert, P. B., Andrews, L. I. B., Serebryannyy, L., Carroll, R., Lin, B. C., et al. (2025) · The Journal of Infectious Diseases · doi:10.1093/infdis/jiaf572 · Cited by 1
Self-citationViral correlates of protection and the multifarious interactions of B and T cells
Meissner, H. C., Gilbert, P. B., Eisnor, D. L., & Wolfe, D. (2025) · Human Vaccines & Immunotherapeutics · doi:10.1080/21645515.2025.2598695 · Cited by 1
Self-citationWalter, E. B., Schlaudecker, E. P., Talaat, K. R., Rountree, W., Broder, K. R., Duffy, J., Montefiori, D. C., Poniewierski, M. S., Spreng, R. L., Staat, M. A., et al. (2025) · Vaccine · doi:10.1016/j.vaccine.2025.128072 · Cited by 1
Self-citationTe, N., Chin, A. W. H., Gu, H., Jia, J. Z., Huang, Y., Cheng, S. M. S., Tan, C. W., Zhao, J., Hui, K. P. Y., Chan, M. C. W., et al. (2026) · Proceedings of the National Academy of Sciences · doi:10.1073/pnas.2518645123 · Cited by 1
Zhang, Z., Boyer, C., & Lipsitch, M. (2026) · American Journal of Epidemiology · doi:10.1093/aje/kwag036 · Cited by 2
Rasmussen, T. H., Schikora-Rustad, S., Lorentzen, Å. R., Tran, T. T., Øverås, M. H., Myhr, K., Wergeland, S., Aarseth, J. H., Bø, L., Berge, T., et al. (2026) · BMJ Neurology Open · doi:10.1136/bmjno-2026-001556 · Cited by 1
Kim, B., Roenicke, R., Roeder, P. M., Steinberg, I., Patamawenu, A. A., Harrison, M., Veer, F. V., Koory, E., Xie, J., Shofner, T., et al. (2026) · iScience · doi:10.1016/j.isci.2026.115433 · Cited by 2
Partey, F. D., Mohammed, H., Osei, F., Pobee, A. N. A., Atta-Poku, D. E., Ansah, Y. A. A., Owusu-Amponsah, M. M. A. K., Appiah, N. Y. A., Koranteng, N. A. O., Appiagyei-Mintah, E., et al. (2026) · Vaccines · doi:10.3390/vaccines14040303 · Cited by 1
Searching for immune correlates in Lassa vaccine development – workshop report
Brasel, T., Brangel, P., Adetifa, I., Baize, S., Benkeser, D. C., Bertoletti, A., Bukreyev, A. A., Charlton, S., Cramer, J. P., Cross, R. W., et al. (2026) · npj Vaccines · doi:10.1038/s41541-026-01452-6 · Cited by 1
Self-citationMcCafferty, K., Barratt, J., Suzuki, Y., Liew, A., Rizk, D. V., Chacko, B., Kooienga, L. A., Lafayette, R. A., Wong, M. G., Pasetti, M. F., et al. (2026) · Clinical Journal of the American Society of Nephrology · doi:10.2215/cjn.0000001089 · Cited by 1
Ikrar, T., Muchsin, W., & Sophian, A. (2026) · Journal of Virological Methods · doi:10.1016/j.jviromet.2026.115432 · Cited by 1
Srivastava, R. (2026) · Next research. · doi:10.1016/j.nexres.2026.102118 · Cited by 1
Takano, T., Matsumura, T., & Takahashi, Y. (2026) · International Immunology · doi:10.1093/intimm/dxag040 · Cited by 1
Kim, S.-J., Kim, H.-W., Son, S.-E., Song, J.-H., Ahn, S.-M., Lim, S.-J., Park, H.-N., Sa, H.-J., Kim, N.-Y., Kim, J.-J., et al. (2026) · Vaccine · doi:10.1016/j.vaccine.2026.129059 · Cited by 1
Association of Lower Antispike Antibody Levels with Mortality in ICU Patients with COVID‐19 Disease
Yelle, S., Amte, R. K., Gella, V., Sasikala, M., Gujjarlapudi, D., Ismail, M., Thankachan, L., Adla, S., Unnisa, F., Reddy, S., et al. (2023) · Critical Care Research and Practice · doi:10.1155/2023/4174241 · Cited by 1
Osorio-Toro, L. M., Bonilla-Bonilla, D. M., Daza-Arana, J. E., Aristizábal, J. C., Valencia, J. C. A., & Ramírez, R. (2023) · International Journal of General Medicine · doi:10.2147/ijgm.s396357 · Cited by 1
Ali, N. M., Herati, R. S., Mehta, S. A., Leonard, J., Miles, J., Lonze, B. E., DiMaggio, C. J., Tatapudi, V., Stewart, Z. A., Alnazari, N. M., et al. (2023) · Transplant Infectious Disease · doi:10.1111/tid.14122 · Cited by 1
Tan, E. X. X., Lim, W. H., Thong, E. H., Chavatte, J., Zhang, J., Lim, J., Jin, J. Y., Lim, D. R. X., Kang, J. Y. T., Tang, A. S. P., et al. (2023) · Transplantation Direct · doi:10.1097/txd.0000000000001537 · Cited by 1
Tani, N., Ikematsu, H., Goto, T., Kondo, S., Gondo, K., Fujiyoshi, N., Minami, J., Harada, Y., Nagano, S., Horiuchi, T., et al. (2023) · Vaccine · doi:10.1016/j.vaccine.2023.09.051 · Cited by 1
Zuev, E. V., Markova, О. А., Викторович, К. С., Poteryaev, D. A., Litvinova, N. A., Korotkevich, I. A., Grigiryeva, T. V., & Авгатович, Х. Р. (2023) · Russian Journal of Infection and Immunity · doi:10.15789/2220-7619-vna-8054 · Cited by 1
Mucosal immune probiotic vector vaccines: Development and prospects for application in COVID-19
Zha, R., Yi, B., Liao, C., Li, X., & Lu, J. (2023) · One Health Bulletin · doi:10.4103/2773-0344.387693 · Cited by 1
Spehner, L., Orillard, É., Falcoz, A., Lepiller, Q., Bouard, A., Almotlak, H., Kim, S. C. H., Curtit, E., Meynard, G., Jary, M., et al. (2023) · BMJ Oncology · doi:10.1136/bmjonc-2023-000054 · Cited by 1
Nagra, D., Bechman, K., Russell, M., Yang, Z., Adas, M. A., Subesinghe, S., Rutherford, A. I., Alveyn, E., PATEL, S. N., Wincup, C., et al. (2024) · Vaccines · doi:10.3390/vaccines12010069 · Cited by 1
Deza, D. C., Gomara, A. B. J., Biota, E. C., Beltrán, B., Domènech, E., Gutiérrez, A., Mañosa, M., Zabana, Y., Alfaro, L. R., Romero, E. V., et al. (2024) · Gastroenterología y Hepatología · doi:10.1016/j.gastrohep.2023.12.012 · Cited by 1
Planas, D., Peng, L., Zheng, L., Guivel‐Benhassine, F., Staropoli, I., Porrot, F., Bruel, T., Bhiman, J. N., Bonaparte, M. I., Savarino, S. J., et al. (2024) · Heliyon · doi:10.1016/j.heliyon.2024.e27033 · Cited by 1
Ho, C.-L., Yen, L.-C., Huang, H., Lu, C., Hung, Y., Liao, C., Hung, C.-M., & Chiu, K. (2024) · Frontiers in Immunology · doi:10.3389/fimmu.2024.1340645 · Cited by 1
The Promise of New Vaccines Against Respiratory Viruses
Atmar, R. L., & Sahly, H. M. E. (2024) · PEDIATRICS · doi:10.1542/peds.2023-065328 · Cited by 1
McCafferty, K., Suzuki, Y., Liew, A., Rizk, D. V., Pasetti, M. F., Shriver, M. C., Follman, K., Engler, F. A., Schachter, A. D., Mathur, M., et al. (2024) · Nephrology Dialysis Transplantation · doi:10.1093/ndt/gfae069.138 · Cited by 1
Makrì, E., Charvalos, E., Stavropoulou, E., Skanavis, C., Lagiou, A., & Barbounis, A. (2024) · Acta Microbiologica Hellenica · doi:10.3390/amh69020011 · Cited by 1
Ganusov, V. V. (2024) · ImmunoHorizons · doi:10.4049/immunohorizons.2300057 · Cited by 1
Analysis of a Collaborative Research Network of Botulinum Toxin Clinical Trials
Jang, J., Ahn, H., & Park, E. (2024) · SAGE Open · doi:10.1177/21582440241260940 · Cited by 1
Kanai, T., Ito, T., SAITO, T. K., Aoyagi, J., Kurosaki, M., Betsui, H., Maru, T., Ono, M., & Tajima, T. (2024) · Medicine · doi:10.1097/md.0000000000038809 · Cited by 1
Wee, E. G., Kempster, S. L., Ferguson, D., Hall, J., Ham, C., Morris, S. J., Crook, A., Gilbert, S. C., Korber, B., Almond, N. M., et al. (2024) · Vaccines · doi:10.3390/vaccines12090965 · Cited by 1
Petrovsky, N. (2024) · International Journal of Molecular Sciences · doi:10.3390/ijms25179459 · Cited by 1
Time-course analysis of antibody and cytokine response after the third SARS-CoV-2 vaccine dose
Kim, H. H., Lee, H., Hennighausen, L. G., Furth, P. A., Sung, H., & Huh, J. W. (2024) · Vaccine X · doi:10.1016/j.jvacx.2024.100565 · Cited by 1
Deza, D. C., Gomara, A. B. J., Biota, E. C., Beltrán, B., Domènech, E., Casbas, A. G., Mañosa, M., Zabana, Y., Alfaro, L. R., Romero, E. V., et al. (2024) · Gastroenterología y Hepatología (English Edition) · doi:10.1016/j.gastre.2024.04.041 · Cited by 1
Yahaba, M., Asano, H., Saito, K., Murata, S., Kawasaki, K., Chiba, H., Yokota, S., Yoshikawa, H., Herai, Y., Yamagishi, K., et al. (2024) · Japanese Journal of Infectious Diseases · doi:10.7883/yoken.jjid.2024.116 · Cited by 1
Abounouh, K., Raji, T., Majidi, H., Redwane, S., Laazaazia, O., Aqillouch, S., Ouma, A. E. O., Abdulaziz, M., Aragaw, M., Fallah, M. P., et al. (2024) · BMC Infectious Diseases · doi:10.1186/s12879-024-10345-9 · Cited by 2
Zhang, T., Jian, Z., Chen, J., Xu, D., Yang, X., Lu, Y., Yan, S., Pan, L., Wu, Q., & Ouyang, Z. (2025) · Human Vaccines & Immunotherapeutics · doi:10.1080/21645515.2025.2454078 · Cited by 1
Self-citationDistinct immune responses in people living with HIV following SARS-CoV-2 recovery
Mielke, D., Li, S. S., Schuster, D. J., Li, X., Hu, J., Karuna, S., Seaton, K. E., Brackett, C., Dunn, B., Keyes, T., et al. (2025) · Communications Medicine · doi:10.1038/s43856-025-00839-1 · Cited by 2
Self-citationMai, F., Reisinger, E. C., & Müller‐Hilke, B. (2025) · Clinical Immunology · doi:10.1016/j.clim.2025.110523 · Cited by 1
A practical approach to SARS-CoV-2 testing in a pre and post-vaccination era
Taylor, S. C. (2021) · Journal of Clinical Virology Plus · doi:10.1016/j.jcvp.2021.100044 · Cited by 1
Humoral Response after Vaccination with Half-Dose of BNT162b2 in Subjects under 55 Years of Age
Łukaszuk, K., Podolak, A., Jakiel, G., Kiewisz, J., Wocławek-Potocka, I., Łukaszuk, A., & Rąbalski, Ł. (2021) · Vaccines · doi:10.3390/vaccines9111277 · Cited by 1
SARS CoV-2-Immunität – Stärken und Schwächen
Niehues, T. (2021) · DMW - Deutsche Medizinische Wochenschrift · doi:10.1055/a-1582-2327 · Cited by 1
Criteria for judging the immune markers of COVID‐19 disease vaccines
Lin, N., Fu, H., Pu, D., Quan, Y., Li, Y., Yin, X., Wei, Y., Wang, H., Ma, X., & Wei, X. (2021) · MedComm · doi:10.1002/mco2.109
Qu, J., Sumali, B., & Mitsukura, Y. (2021) · IEEE International Conference on Electronics and Communication Engineering (ICECE) · doi:10.1109/icece54449.2021.9674303 · Cited by 1
Jacobson, J. M. (2022) · The Journal of Infectious Diseases · doi:10.1093/infdis/jiac231 · Cited by 1
Ronicke, S., Osmanodja, B., Budde, K., Jens, A., Hammett, C., Koch, N., Zukunft, B., Bachmann, F., Choi, M., Weber, U., et al. (2022) · Journal of Clinical Medicine · doi:10.3390/jcm11123291 · Cited by 1
Building a Resilient Scientific Network for COVID-19 and Beyond
Babady, N. E., Burckhardt, R. M., Krammer, F., Moore, P. L., & Enquist, L. W. (2022) · mBio · doi:10.1128/mbio.02223-22 · Cited by 1
Liao, S., Chang, W., Hsu, C., Yen, A. M., Lin, T.-Y., Chen, S. L., & Chen, T. H.-H. (2022) · Vaccine · doi:10.1016/j.vaccine.2022.10.011 · Cited by 1
Marked Decreases in Time Lost From Work Among COVID-19 Claimants During the SARS-CoV-2 Pandemic
Hunt, D. L., Bernacki, E. J., Kalia, N., Lavin, R. A., Yuspeh, L., Tsourmas, N. F., Leung, N., Green-McKenzie, J., & Tao, X. G. (2023) · Journal of Occupational and Environmental Medicine · doi:10.1097/jom.0000000000002800 · Cited by 1
Klose, A. M., Kosoy, G., & Miller, B. L. (2023) · PLoS ONE · doi:10.1371/journal.pone.0277846 · Cited by 2
Waning immune response to CoronaVac in health care workers from different age groups
Taminato, M., Chaves, A. P. C., de Morais, R. B., Conte, D., Gabrielloni, M. C., Barbosa, G. R., Medeiros, E. A., & Bellei, N. (2023) · Revista Brasileira de Medicina do Trabalho · doi:10.47626/1679-4435-2022-1048
Blain, H., Tuaillon, É., Pisoni, A., Soriteau, L., Million, E., Léglise, M.-S., Bussereau, I., Miot, S., Rolland, Y., Picot, M., et al. (2021) · medRxiv · doi:10.1101/2021.09.21.21263880 · Cited by 1
Predicting the Effectiveness of Covid-19 Vaccines from SARS-CoV-2 Variants Neutralisation DataPreprint
Volkov, O., Borozdenkova, S., & Gray, A. (2021) · medRxiv · doi:10.1101/2021.09.06.21263160 · Cited by 1
Broad human and animal coronavirus neutralisation by SARS-CoV-2 S2-targeted vaccinationPreprint
Ng, K. W., Faulkner, N., Finsterbusch, K., Wu, M., Harvey, R., Hussain, S., Greco, M., Liu, Y., Kjær, S., Swanton, C., et al. (2021) · bioRxiv (Cold Spring Harbor Laboratory) · doi:10.1101/2021.11.30.470568 · Cited by 1
Macaque-human differences in SARS-CoV-2 Spike antibody response elicited by vaccination or infectionPreprint
Willcox, A. C., Sung, K., Garrett, M. E., Galloway, J., O’Connor, M. A., Erasmus, J. H., Logue, J. K., Hawman, D. W., Chu, H. Y., Hasenkrug, K. J., et al. (2021) · bioRxiv (Cold Spring Harbor Laboratory) · doi:10.1101/2021.12.01.470697 · Cited by 1
Taminato, M., Chaves, A. P. C., de Morais, R. B., Moreira, L. V. L., Conte, D., Faíco-Filho, K. S., Gabrielloni, M. C., Medeiros, E. A., & Bellei, N. (2022) · medRxiv · doi:10.1101/2021.12.30.21268532 · Cited by 1
Madhi, S. A., Kwatra, G., Welch, R., Koen, A. L., Baillie, V. L., Cutland, C., Fairlie, L., Padayachee, S. D., Dheda, K. U. J., Barnabas, S. L., et al. (2022) · SSRN Electronic Journal · doi:10.2139/ssrn.4173050 · Cited by 1
Jorda, A., & Zeitlinger, M. A. (2022) · The Lancet Respiratory Medicine · doi:10.1016/s2213-2600(22)00271-5 · Cited by 1
Qin, K., Honjo, K., Sherrill-Mix, S. A., Liu, W., Stoltz, R., Oman, A. K., Hall, L. A., Li, R., Sterrett, S., Frederick, E. R., et al. (2022) · medRxiv · doi:10.1101/2022.12.19.22283645 · Cited by 1
Asokan, M., Joan, R. F., Babji, S., Dayma, G., Nitheesh, P., Subrahmanyam, V., Pandey, A., Malagi, G., Arya, P., Mahajan, V., et al. (2023) · medRxiv · doi:10.1101/2023.01.03.22284082 · Cited by 1
Tai, C. G.-L., Haviland, M. J., Kissler, S. M., Lucia, R. M., MERSON, M. H., Maragakis, L. L., Ho, D. D., Anderson, D. J., DiFiori, J. P., Grubaugh, N. D., et al. (2023) · medRxiv · doi:10.1101/2023.02.10.23285780 · Cited by 1
Vikström, L., Fjällström, P., Gwon, Y.-D., Sheward, D. J., Byström, J. W., Evander, M., Bladh, O., Widerström, M., Molnár, C., Rasmussen, G., et al. (2023) · medRxiv · doi:10.1101/2023.02.16.23286009 · Cited by 1
Liu, Y., Sánchez‐Ovando, S., Carolan, L. A., Dowson, L., Khvorov, A., Hadiprodjo, A. J., Tseng, Y. Y., Delahunty, C., Khatami, A., Macnish, M., et al. (2023) · medRxiv · doi:10.1101/2023.06.02.23290871 · Cited by 1
Humoral immune response to omicron infection in long-term Wuhan-Hu-1-imprinted populationPreprint
Lü, Y., Zhu, Y., Zheng, Y., Tang, L., Chen, H., Zhou, C.-L., Luo, J., Yang, X., Yu, L., Hu, Q., et al. (2023) · Research Square · doi:10.21203/rs.3.rs-3024491/v1 · Cited by 1
Laderoute, M. P. (2023) · Preprints.org · doi:10.20944/preprints202312.0185.v1
Laderoute, M. P. (2024) · Preprints.org · doi:10.20944/preprints202312.0185.v2
Protective pan-betacoronavirus neutralizing antibodies by vaccinationPreprint
Zhou, P.-P., Feng, Z., He, W.-T., Zhu, Y., Yuan, M., Li, X., Zhang, Y., Vo, L., Capozzola, T., Callaghan, S., et al. (2026) · bioRxiv (Cold Spring Harbor Laboratory) · doi:10.64898/2026.08.06.743418 · Cited by 1
SZASZ, T. S. (1996) · Journal of Medical Ethics · doi:10.1136/jme.22.1.55
Williams, D. E. (2021) · Research Square · doi:10.21203/rs.3.rs-1051588/v1
Protective characteristics of COVID-19 convalescent and post-vaccination IgG antibodiesPreprint
Klegerman, M. E., Peng, T., Seferovich, I., Rahbar, M. H., Hessabi, M., Tahanan, A., Wanger, A. R., Grimes, C. Z., Ostrosky‐Zeichner, L., Koster, K. J., et al. (2021) · medRxiv · doi:10.1101/2021.11.19.21266547
Shah, M. M., Rasheed, M. A. U., Harcourt, J. L., Abedi, G. R., Stumpf, M. M., Kirking, H. L., Tamin, A., Mills, L. A., Armstrong, M., Salvatore, P. P., et al. (2022) · Open Forum Infectious Diseases · doi:10.1093/ofid/ofab664
Self-citationGuibert, N., Saade, C., Brengel‐Pesce, K., Elsensohn, M., Pozzetto, B., Compagnon, C., Barateau, V., Mariano, N., Chaix, J., Djebali, S., et al. (2022) · SSRN Electronic Journal · doi:10.2139/ssrn.4000583
Prevention and Control of Coronavirus Disease 2019: Where Do We Go From Here?
Neuzil, K. M. (2022) · Clinical Infectious Diseases · doi:10.1093/cid/ciac090
Self-citationLee, D. W., Avena, L. E., Berrueta, D. M., Koch, M., Choi, A., Oestreicher, J., Hillebrand, W., Zhou, H., Pajón, R., Carfı́, A., et al. (2022) · medRxiv · doi:10.1101/2022.01.28.21268247
Self-citationNuevos retos en el desarrollo y uso de vacunas contra la COVID-19.
Esparza, J., García, A. H., Figuera, M. E., & Pujol, F. H. (2022) · Salus · doi:10.54139/salus.v25i3.126
Decline of immune humoral response after BNT162b2 vaccine
Ferri, S., Polidoro, A., Ciacciarelli, M., Ceratti, U., Congedo, V., Maria, M., Coluzzi, G., Spagnoli, A., & Iuliano, L. (2022) · Journal of Infection · doi:10.1016/j.jinf.2022.02.013
Vandergaast, R., Carey, T. S., Suksanpaisan, L., Lathrum, C., Narjari, R., Haselton, M., Schnebeck, L., Wijesekara, A., Duncan, A., Russell, L., et al. (2022) · medRxiv · doi:10.1101/2022.03.01.22271202
Human vaccines & immunotherapeutics: news August 2021
(2021) · Human Vaccines & Immunotherapeutics · doi:10.1080/21645515.2021.1979831
Rolak, S. C., & Caldera, F. (2022) · The American Journal of Gastroenterology · doi:10.14309/ajg.0000000000001729
Effect of vaccination rates on the prevalence and mortality of COVID-19Preprint
Westerhout, J., Khataee, H., & Neufeld, Z. (2022) · medRxiv · doi:10.1101/2022.03.31.22273274
Antikörperbestimmung nach SARS-CoV-2-Impfung: Sinnvolles Monitoring oder bedeutungslos?
Lotz, C., Herrmann, J., Hübsch, M. E., Notz, Q., & Meybohm, P. (2022) · AINS - Anästhesiologie · Intensivmedizin · Notfallmedizin · Schmerztherapie · doi:10.1055/a-1783-3932
Anderson, E. J., Jackson, L. A., Rouphael, N., Widge, A. T., Montefiori, D. C., Doria‐Rose, N. A., Suthar, M. S., Cohen, K. W., O’Connell, S. E., Makowski, M., et al. (2022) · Research Square · doi:10.21203/rs.3.rs-1594631/v1
Self-citationThuluva, S., Paradkar, V. M., Turaga, K., Gunneri, S., Yerroju, V., Mogulla, R. R., Kyasani, M., Manoharan, S., Medigeshi, G. R., Singh, J., et al. (2022) · SSRN Electronic Journal · doi:10.2139/ssrn.4053490
Gilbert, P. B., & Ph., D. (2002) · Current Problems in Surgery · doi:10.1016/s0011-3840(02)70015-4
Self-citationCancer Therapy and Immunogenicity of COVID Vaccine – CANINE StudyPreprint
Khan, Q. J., Bivona, C. R., Martin, G. A., Zhang, J., Liu, B., He, J., Li, K. H., Nelson, M., Williamson, S. K., Doolittle, G. C., et al. (2021) · SSRN Electronic Journal · doi:10.2139/ssrn.3936503
Antibody response to SARS-CoV-2 booster vaccines
Loving, H. S., Sacks, D. B., & Harb, R. (2022) · Clinical Biochemistry · doi:10.1016/j.clinbiochem.2022.06.004
Metadata
- Authors
- Gilbert, P. B., Montefiori, D. C., McDermott, A. B., Fong, Y., Benkeser, D., Deng, W., Zhou, H., Houchens, C. R., Martins, K., Jayashankar, L., Castellino, F., Flach, B., Lin, B. C., O’Connell, S., McDanal, C., Eaton, A., Sarzotti-Kelsoe, M., Lu, Y., Yu, C., Borate, B., van der Laan, L. W. P., Hejazi, N. S., Huynh, C., Miller, J., El Sahly, H. M., Baden, L. R., Baron, M., De La Cruz, L., Gay, C., Kalams, S., Kelley, C. F., Andrasik, M. P., Kublin, J. G., Corey, L., Neuzil, K. M., Carpp, L. N., Pajon, R., Follmann, D., Donis, R. O., Koup, R. A., Immune Assays Team§, Moderna, I. T., Coronavirus Vaccine Prevention Network (CoVPN)/Coronavirus Efficacy (COVE) Team§, & United States Government (USG)/CoVPN Biostatistics Team§
- Affiliations
- University of Washington (US)
- Duke University (US)
- National Institutes of Health (US)
- Fred Hutch Cancer Center (US)
- Emory University (US)
- Moderna Therapeutics (United States) (US)
- Biomedical Advanced Research and Development Authority (US)
- Department of Surgery and Duke Human Vaccine Institute, Duke University Medical Center, Durham, NC, USA.
- Vaccine and Infectious Disease Division, Fred Hutchinson Cancer Research Center, Seattle, WA, USA.
- Department of Molecular Virology and Microbiology, Baylor College of Medicine, Houston, TX, USA.
- Brigham and Women's Hospital (US)
- Palm Beach Research Center (US)
- Keystone Vitalink Research, Greenville, SC, USA.
- University of North Carolina at Chapel Hill (US)
- Vanderbilt University Medical Center (US)
- University of Maryland, Baltimore (US)
- Moderna, Inc., Cambridge, MA, USA.
- Biomedical Advanced Research and Development Authority, Washington, DC, USA.
- Corresponding author
- Gilbert, Peter B.
- Montefiori, David C.
- McDermott, Adrian B.
- Koup, Richard A.
- ORCID
- Gilbert, Peter B.
- Montefiori, David C.
- McDermott, Adrian B.
- Fong, Youyi
- Benkeser, David
- Deng, Weiping
- Houchens, Christopher R.
- Martins, Karen
- Jayashankar, Lakshmi
- Castellino, Flora
- Lin, Bob C.
- O’Connell, Sarah
- McDanal, Charlene
- Eaton, Amanda
- Lu, Yiwen
- Yu, Chenchen
- Borate, Bhavesh
- Hejazi, Nima S.
- Miller, Jacqueline
- El Sahly, Hana M.
- Baden, Lindsey R.
- Baron, Mira
- Gay, Cynthia
- Kalams, Spyros
- Kelley, Colleen F.
- Andrasik, Michele P.
- Kublin, James G.
- Corey, Lawrence
- Neuzil, Kathleen M.
- Carpp, Lindsay N.
- Follmann, Dean
- Donis, Ruben O.
- Koup, Richard A.
- Venue
- Science
- Published
- 2022-01-07
- Volume
- 375
- Issue
- 6576
- Pages
- 43-50
- ISSN
- 0036-8075 (ISSN-L)
- 1095-9203
- PMC
- PMC8366808
- OpenAlex
- W3217661335
- Cited by
- 1,137
- References
- 47
- Citations by year
- 2026: 65 · 2025: 114 · 2024: 197 · 2023: 278 · 2022: 412
- FWCI
- 123.36
- Type
- journal article
- Language
- en
- Open access
- hybrid
- doi.org
- Licence
- cc-by
- Locations
- Science (publishedVersion, cc-by)
- medRxiv (acceptedVersion, cc-by-nc-nd)
- PubMed Central (publishedVersion, cc-by)
- PubMed (publishedVersion)
- PubMed Central (submittedVersion, cc-by-nc-nd)
- Funders
- Wellcome Trust
- National Institutes of Health (1s10od028685-01, UL1TR002384)
- National Institute of Allergy and Infectious Diseases (S10AI174104, U01AI068635, UM1AI068614, UM1AI068635, UM1AI148575, UM1AI069476, R37AI054165, UM1AI148684, UM1AI069412)
- National Center for Advancing Translational Sciences
- Topics
- Health Sciences › Medicine › Infectious Diseases › SARS-CoV-2 and COVID-19 Research
- Health Sciences › Medicine › Infectious Diseases › COVID-19 Clinical Research Studies
- Life Sciences › Biochemistry, Genetics and Molecular Biology › Molecular Biology › vaccines and immunoinformatics approaches
- Keywords
- mRNA-1273 vaccine, COVID-19 vaccine efficacy, SARS-CoV-2, neutralizing antibodies, binding antibodies, correlates of protection, vaccine immunogenicity, vaccine approval
About these checks
Registry, retraction, Cites and statistics results are computed, not judged, with one exception: a printed reference that no index lists is read once by a model before it counts as a citation error. Claims are extracted by a model and kept only when their quote appears verbatim in the text; each cited source is then checked, with a model’s help, for whether it says what the claim relies on. Those verdicts can be wrong — read the claim’s quote and the cited source before relying on one.
Statistics and arithmetic are recomputed, not judged.
Confidence bands are shown only for fields calibrated on our annotated test set. None is calibrated yet, so no band is shown.
What counts as a claim ›How we measure confidence ›How we check this ›
Are you an author, or do you see a problem with this page? Request a review
