

The DOI matches its Crossref record; 54 of the 55 references it cites were found in a registry or an index.
Functional Dynamics of the Gut Microbiome in Elderly People during Probiotic Consumption
Open accessAbstract
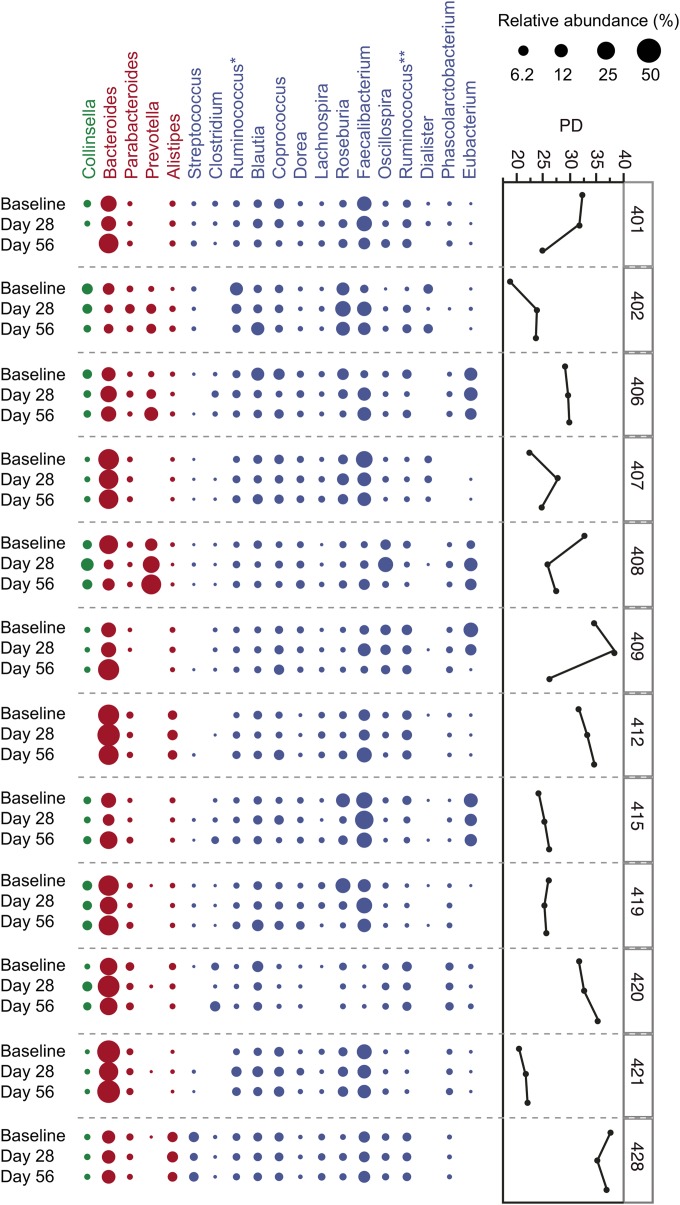
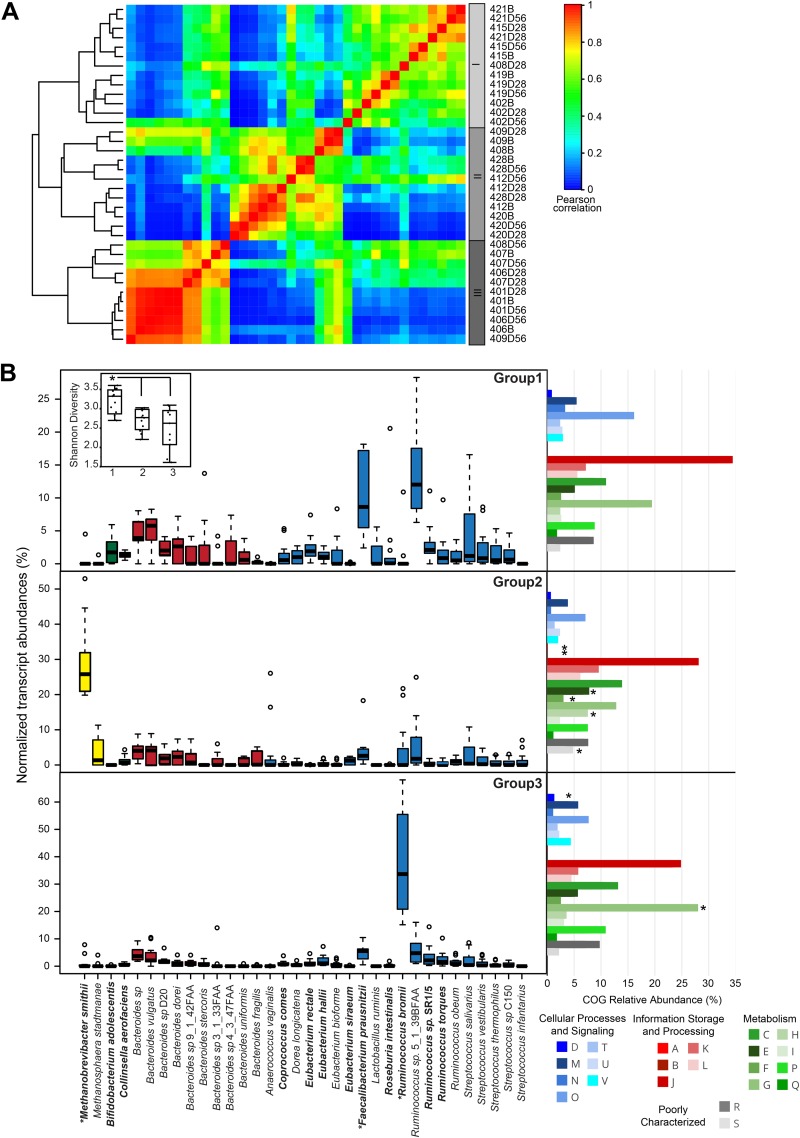
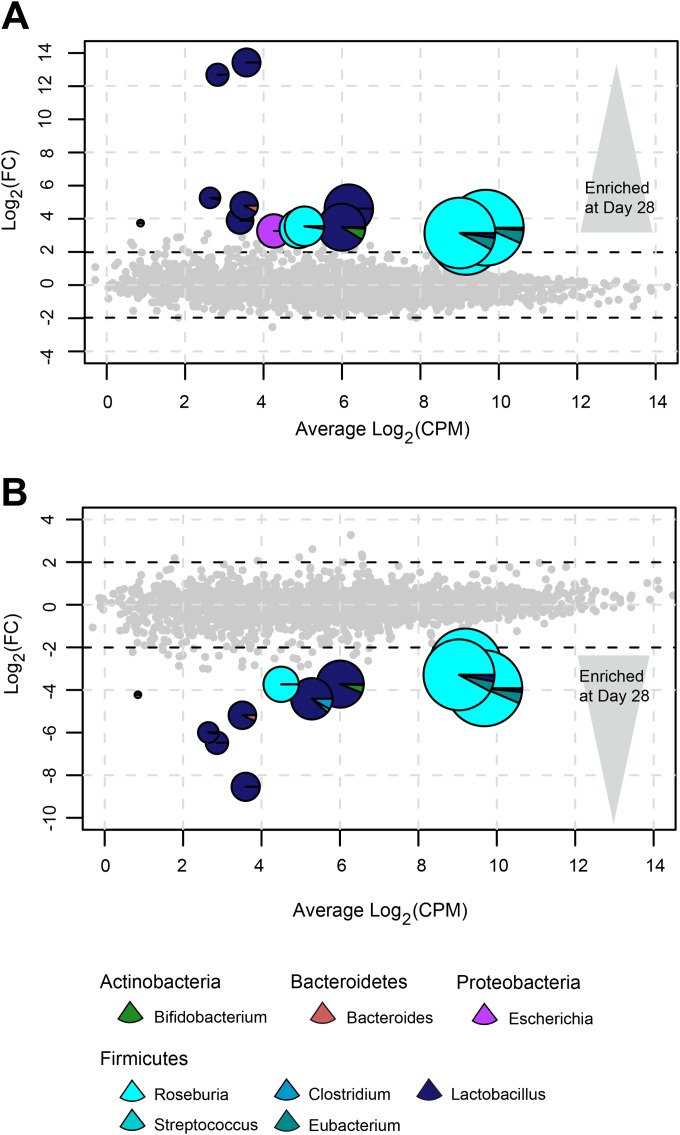
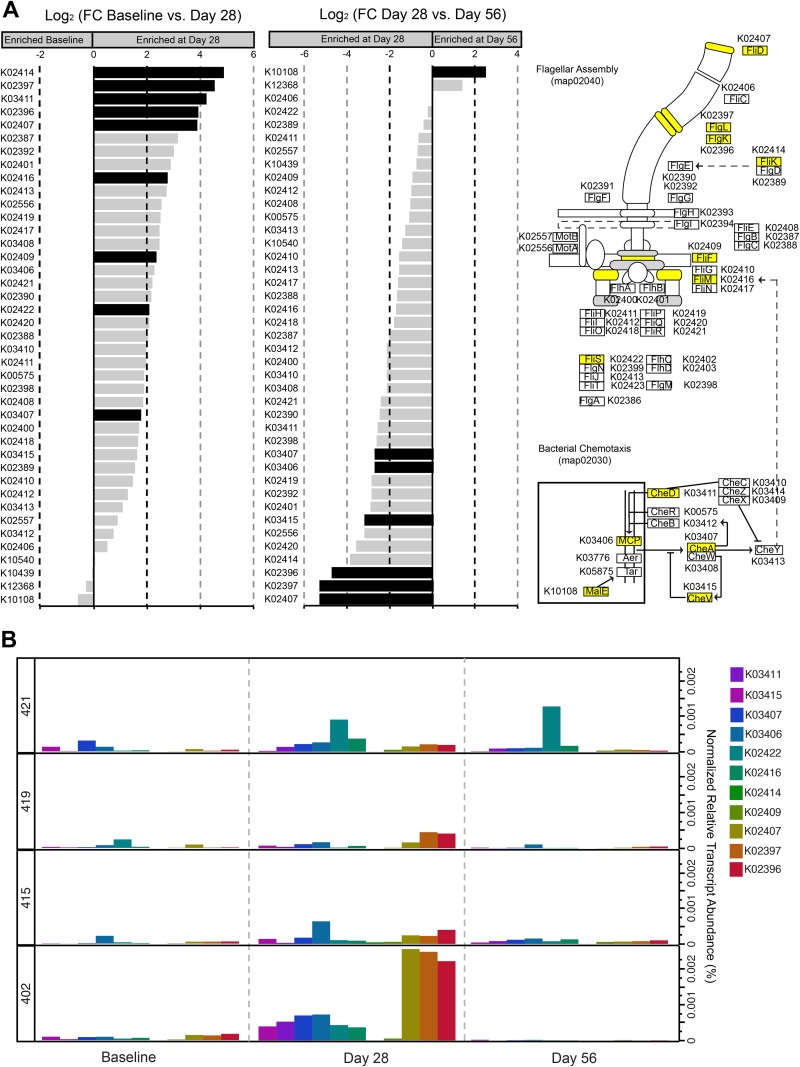
A mechanistic understanding of the purported health benefits conferred by consumption of probiotic bacteria has been limited by our knowledge of the resident gut microbiota and its interaction with the host. Here, we detail the impact of a single-organism probiotic, Lactobacillus rhamnosus GG ATCC 53103 (LGG), on the structure and functional dynamics (gene expression) of the gut microbiota in a study of 12 healthy individuals, 65 to 80 years old. The analysis revealed that while the overall community composition was stable as assessed by 16S rRNA profiling, the transcriptional response of the gut microbiota was modulated by probiotic treatment. Comparison of transcriptional profiles based on taxonomic composition yielded three distinct transcriptome groups that displayed considerable differences in functional dynamics. The transcriptional profile of LGG in vivo was remarkably concordant across study subjects despite the considerable interindividual nature of the gut microbiota. However, we identified genes involved in flagellar motility, chemotaxis, and adhesion from Bifidobacterium and the dominant butyrate producers Roseburia and Eubacterium whose expression was increased during probiotic consumption, suggesting that LGG may promote interactions between key constituents of the microbiota and the host epithelium. These results provide evidence for the discrete functional effects imparted by a specific single-organism probiotic and challenge the prevailing notion that probiotics substantially modify the resident microbiota within nondiseased individuals in an appreciable fashion. IMPORTANCE Probiotic bacteria have been used for over a century to promote digestive health. Many individuals report that probiotics alleviate a number of digestive issues, yet little evidence links how probiotic microbes influence human health. Here, we show how the resident microbes that inhabit the healthy human gut respond to a probiotic. The well-studied probiotic Lactobacillus rhamnosus GG ATCC 53103 (LGG) was administered in a clinical trial, and a suite of measurements of the resident microbes were taken to evaluate potential changes over the course of probiotic consumption. We found that LGG transiently enriches for functions to potentially promote anti-inflammatory pathways in the resident microbes.
Overview
The claims and statistics of this paper haven’t been checked yet.
Run the check — free, no account needed. It reads the open-access text and checks the sources it cites.
Integrity signals
Registry
Cites
Statistics
Figures
Verification
Claims the paper makes
The claims and statistics of this paper haven’t been checked yet.
Run the check — free, no account needed. It reads the open-access text and checks the sources it cites.
Claims other papers make about this one
Each is checked against this paper’s own text: does it say what the citing paper says it does?
In the citing paper
“data showing butyrate (associated with Bifidobacterium [72]) treatment to protect against age-related muscle atrophy [73] supports the idea that pre- and/or probiotic supplementation, which is shown to increase the abundance of Bifidobacterium and butyrate producers in older individuals [74, 75], may prophylactically moderate aging muscle loss.”
From Gut Microbiota Contribute to Age-Related Changes in Skeletal Muscle Size, Composition, and Function: Biological Basis for a Gut-Muscle Axis (2018) · cites this paper as [74]
Self-check
Percentages, sums and reported differences re-computed from the paper’s own numbers.
The self-check needs the paper’s full text.
Citations
Cites
Robinson, M. D., McCarthy, D. J., & Smyth, G. K. (2010) · Bioinformatics · doi:10.1093/bioinformatics/btp616 · Cited by 41,364
QIIME allows analysis of high-throughput community sequencing data
Caporaso, J. G., Kuczynski, J., Stombaugh, J., Bittinger, K., Bushman, F. D., Costello, E. K., Fierer, N., Peña, A. G., Goodrich, J. K., Gordon, J. I., et al. (2010) · Nature Methods · doi:10.1038/nmeth.f.303 · Cited by 34,887
Ultrafast and memory-efficient alignment of short DNA sequences to the human genome.
Langmead, B., Trapnell, C., Pop, M., & Salzberg, S. L. (2009) · Genome Biology · doi:10.1186/gb-2009-10-3-r25 · Cited by 21,849
HTSeq—a Python framework to work with high-throughput sequencing data
Anders, S., Pyl, P. T., & Huber, W. (2015) · Bioinformatics · doi:10.1093/bioinformatics/btu638 · Cited by 21,464
Metagenomic biomarker discovery and explanation
Segata, N., Izard, J., Waldron, L., Gevers, D., Miropolsky, L., Garrett, W. S., & Huttenhower, C. (2011) · Genome Biology · doi:10.1186/gb-2011-12-6-r60 · Cited by 16,192
RAxML-VI-HPC: maximum likelihood-based phylogenetic analyses with thousands of taxa and mixed models
Stamatakis, A. (2006) · Bioinformatics · doi:10.1093/bioinformatics/btl446 · Cited by 15,582
UCHIME improves sensitivity and speed of chimera detection
Edgar, R. C., Haas, B. J., Clemente, J. C., Quince, C., & Knight, R. (2011) · Bioinformatics · doi:10.1093/bioinformatics/btr381 · Cited by 15,114
Diet rapidly and reproducibly alters the human gut microbiome
David, L. A., Maurice, C. F., Carmody, R. N., Gootenberg, D. B., Button, J. E., Wolfe, B. E., Ling, A. V., Devlin, A. S., Varma, Y., Fischbach, M. A., et al. (2014) · Nature · doi:10.1038/nature12820 · Cited by 10,100
Fitting Linear Mixed-Effects Models Using lme4Preprint
Bates, D. M., Maechler, M., Bolker, B. M., & Walker, S. (2014) · arXiv (Cornell University) · doi:10.3929/ethz-b-000105397 · Cited by 9,435
A scaling normalization method for differential expression analysis of RNA-seq data
Robinson, M. D., & Oshlack, A. (2010) · Genome Biology · doi:10.1186/gb-2010-11-3-r25 · Cited by 7,876
Cited by
Sorted by citations
Influence of diet on the gut microbiome and implications for human health
Singh, R. K., Chang, H.-W., Yan, D., Lee, K. M., Ucmak, D., Wong, K., Abrouk, M., Farahnik, B., Nakamura, M., Zhu, T. H., et al. (2017) · Journal of Translational Medicine · doi:10.1186/s12967-017-1175-y · Cited by 2,599
Rivière, A., Selak, M., Lantin, D., Leroy, F., & Vuyst, L. D. (2016) · Frontiers in Microbiology · doi:10.3389/fmicb.2016.00979 · Cited by 1,810
Zmora, N., Zilberman-Schapira, G., Suez, J., Mor, U., Dori-Bachash, M., Bashiardes, S., Kotler, E., Zur, M., Regev-Lehavi, D., Brik, R. B.-Z., et al. (2018) · Cell · doi:10.1016/j.cell.2018.08.041 · Cited by 1,695
The central nervous system and the gut microbiome
Sharon, G., Sampson, T. R., Geschwind, D. H., & Mazmanian, S. K. (2016) · Cell · doi:10.1016/j.cell.2016.10.027 · Cited by 1,513
The pros, cons, and many unknowns of probiotics
Suez, J., Zmora, N., Segal, E., & Elinav, E. (2019) · Nature Medicine · doi:10.1038/s41591-019-0439-x · Cited by 1,398
Metadata
- Authors
- Eloe-Fadrosh, E. A., Brady, A., Crabtree, J., Drabek, E. F., Ma, B., Mahurkar, A., Ravel, J., Haverkamp, M., Fiorino, A.-M., Botelho, C., Andreyeva, I., Hibberd, P. L., & Fraser, C. M.
- Affiliations
- Institute for Genome Sciences, University of Maryland School of Medicine, Baltimore, Maryland, USA
- University of Maryland, Baltimore (US)
- Massachusetts General Hospital (US)
- Corresponding author
- Fraser, Claire M.
- ORCID
- Venue
- mBio
- Publisher
- American Society for Microbiology
- Published
- 2015-05
- Volume
- 6
- Issue
- 2
- ISSN
- 2150-7511 (ISSN-L)
- 2161-2129
- PMC
- PMC4453556
- OpenAlex
- W2156573030
- Cited by
- 160
- References
- 55
- Citations by year
- 2026: 3 · 2025: 11 · 2024: 8 · 2023: 11 · 2022: 14 · 2021: 21 · 2020: 11 · 2019: 19 · 2018: 20 · 2017: 19 · 2016: 19 · 2015: 4
- FWCI
- 27.59
- Type
- journal article
- Language
- en
- Open access
- gold
- doi.org
- Licence
- Locations
- mBio (publishedVersion, cc-by-nc-sa)
- Europe PMC (PubMed Central) (publishedVersion, cc-by-nc-sa)
- PubMed Central (publishedVersion, cc-by-nc-sa)
- PubMed (publishedVersion)
- DOAJ (DOAJ: Directory of Open Access Journals) (submittedVersion, cc-by-sa)
- Funders
- National Science Foundation (0959894)
- National Institutes of Health
- National Center for Complementary and Alternative Medicine
- National Center for Complementary and Integrative Health (K24AT003683, U01AT002952, U01AT002133, U01AT002388)
- Topics
- Life Sciences › Agricultural and Biological Sciences › Food Science › Probiotics and Fermented Foods
- Life Sciences › Biochemistry, Genetics and Molecular Biology › Molecular Biology › Gut microbiota and health
- Health Sciences › Nursing › Nutrition and Dietetics › Infant Nutrition and Health
- Keywords
- probiotics, Lactobacillus rhamnosus GG, gut microbiota, older adults, Bifidobacterium, Roseburia, Eubacterium, flagellar motility, chemotaxis, adhesion, host-microbe interactions, anti-inflammatory pathways, interindividual variability, 16S rRNA gene profiling
- MeSH terms
- Gastrointestinal Microbiome, Aged, Aged, 80 and over, DNA, Bacterial, DNA, Ribosomal, Female, Humans, Male, Molecular Sequence Data, Phylogeny, RNA, Ribosomal, 16S, Cluster Analysis, Sequence Analysis, DNA, Probiotics, Gene Expression Profiling, Gastrointestinal Tract, Lacticaseibacillus rhamnosus, Microbial Interactions
About these checks
Registry, retraction, Cites and statistics results are computed, not judged, with one exception: a printed reference that no index lists is read once by a model before it counts as a citation error. Claims are extracted by a model and kept only when their quote appears verbatim in the text; each cited source is then checked, with a model’s help, for whether it says what the claim relies on. Those verdicts can be wrong — read the claim’s quote and the cited source before relying on one.
Statistics and arithmetic are recomputed, not judged.
Confidence bands are shown only for fields calibrated on our annotated test set. None is calibrated yet, so no band is shown.
What counts as a claim ›How we measure confidence ›How we check this ›
Are you an author, or do you see a problem with this page? Request a review
