

The DOI matches its Crossref record; 48 of the 48 references it cites were found in a registry or an index.
Role of Multicellular Aggregates in Biofilm Formation
Open accessAbstract
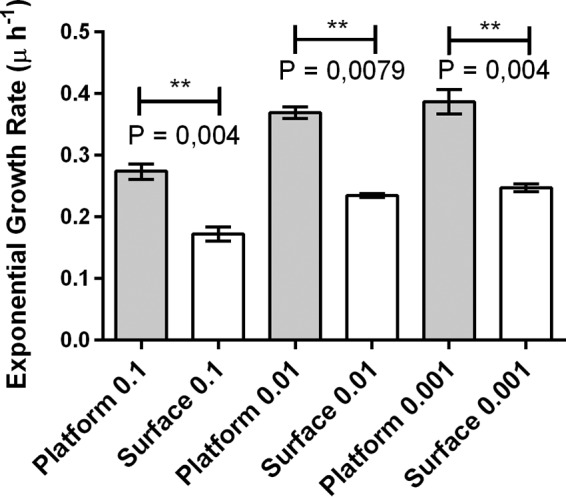
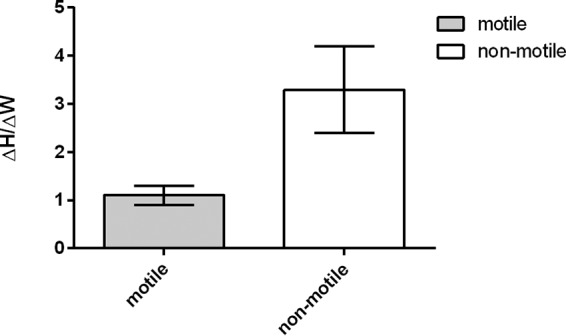
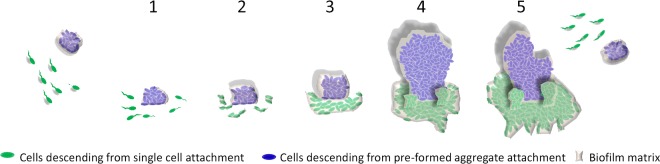
In traditional models of in vitro biofilm development, individual bacterial cells seed a surface, multiply, and mature into multicellular, three-dimensional structures. Much research has been devoted to elucidating the mechanisms governing the initial attachment of single cells to surfaces. However, in natural environments and during infection, bacterial cells tend to clump as multicellular aggregates, and biofilms can also slough off aggregates as a part of the dispersal process. This makes it likely that biofilms are often seeded by aggregates and single cells, yet how these aggregates impact biofilm initiation and development is not known. Here we use a combination of experimental and computational approaches to determine the relative fitness of single cells and preformed aggregates during early development of Pseudomonas aeruginosa biofilms. We find that the relative fitness of aggregates depends markedly on the density of surrounding single cells, i.e., the level of competition for growth resources. When competition between aggregates and single cells is low, an aggregate has a growth disadvantage because the aggregate interior has poor access to growth resources. However, if competition is high, aggregates exhibit higher fitness, because extending vertically above the surface gives cells at the top of aggregates better access to growth resources. Other advantages of seeding by aggregates, such as earlier switching to a biofilm-like phenotype and enhanced resilience toward antibiotics and immune response, may add to this ecological benefit. Our findings suggest that current models of biofilm formation should be reconsidered to incorporate the role of aggregates in biofilm initiation. IMPORTANCE During the past decades, there has been a consensus around the model of development of a biofilm, involving attachment of single planktonic bacterial cells to a surface and the subsequent development of a mature biofilm. This study presents results that call for a modification of this rigorous model. We show how free floating biofilm aggregates can have a profound local effect on biofilm development when attaching to a surface. Our findings show that an aggregate landing on a surface will eventually outcompete the biofilm population arising from single cells attached around the aggregate and dominate the local biofilm development. These results point to a regime where preformed biofilm aggregates may have a fitness advantage over planktonic cells when it comes to accessing nutrients. Our findings add to the increasingly prominent comprehension that biofilm lifestyle is the default for bacteria and that planktonic single cells may be only a transition state at the most.
Overview
The claims and statistics of this paper haven’t been checked yet.
Run the check — free, no account needed. It reads the open-access text and checks the sources it cites.
Integrity signals
Registry
Cites
Statistics
Figures
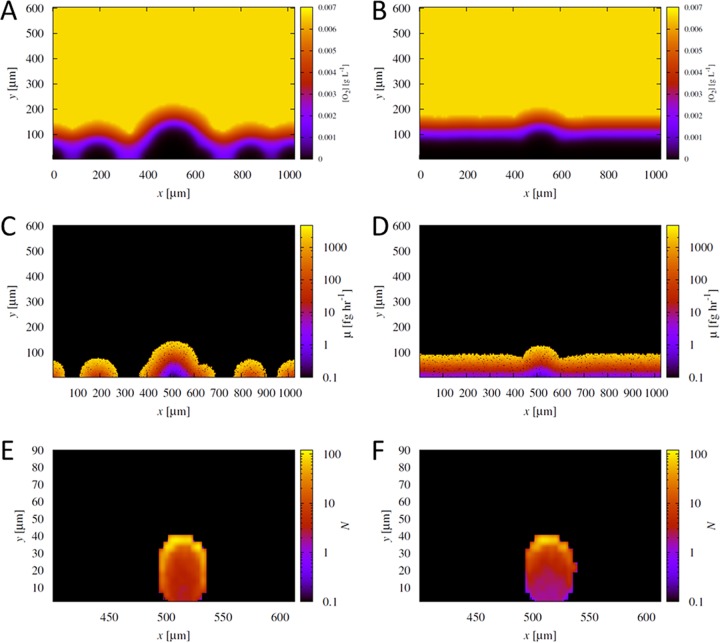
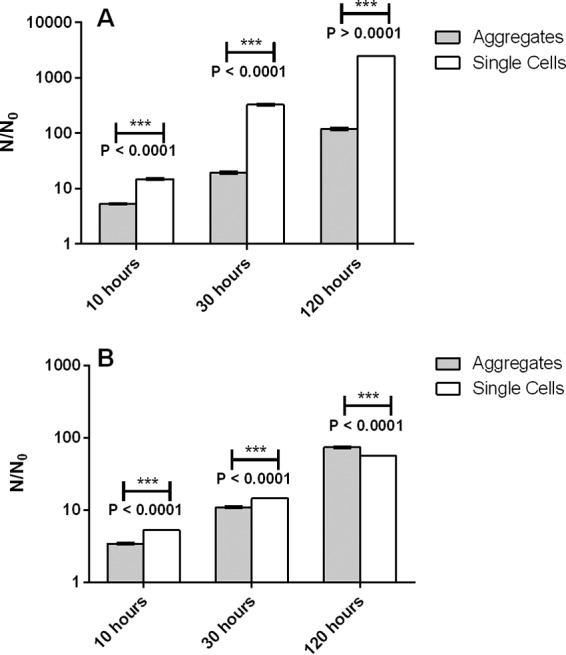
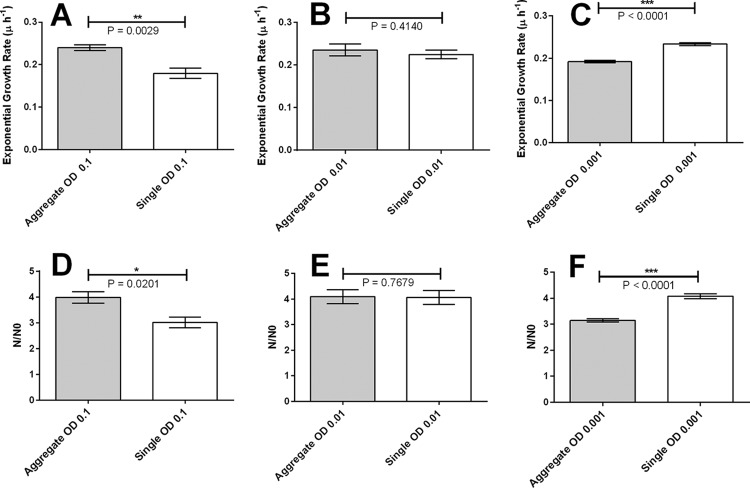
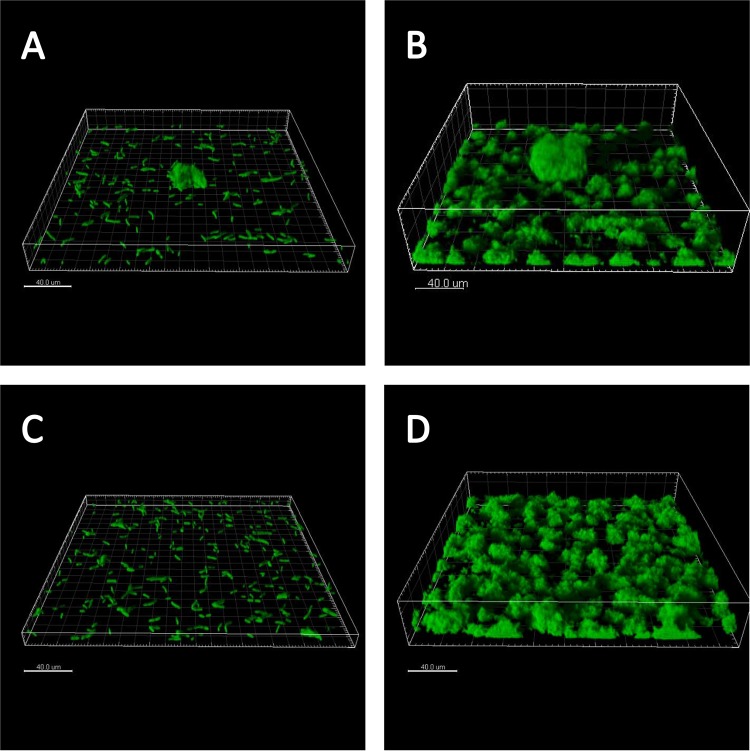
Verification
Claims the paper makes
The claims and statistics of this paper haven’t been checked yet.
Run the check — free, no account needed. It reads the open-access text and checks the sources it cites.
Claims other papers make about this one
Each is checked against this paper’s own text: does it say what the citing paper says it does?
The cited source says what the claim attributes to it.
In the citing paper
“Autoaggregation is also often among the first steps in forming biofilms.”
From Bacterial autoaggregation (2018) · cites this paper as [2]
The cited source says what the claim attributes to it.
In the citing paper
“Autoaggregation and microcolony formation are among the first steps in building a biofilm.”
From Bacterial autoaggregation (2018) · cites this paper as [2]
The cited source says what the claim attributes to it.
In the citing paper
“At high cell densities, aggregated cells have a competitive advantage over single cells, as the cells positioned at the top of the aggregate have more access to nutrients. However, at low cell densities, the aggregated cells are at a disadvantage, as the cells in the middle of the aggregate have limited nutrient access [2].”
From Bacterial autoaggregation (2018) · cites this paper as [2]
The cited source says what the claim attributes to it.
In the citing paper
“This view is supported by the recent work showing that, under high competition with single cells, cells positioned at the top of aggregates enjoy a competitive advantage [2].”
From Bacterial autoaggregation (2018) · cites this paper as [2]
Self-check
Percentages, sums and reported differences re-computed from the paper’s own numbers.
The self-check needs the paper’s full text.
Citations
Cites
The genetical evolution of social behaviour. I
Hamilton, W. D. (1964) · Journal of Theoretical Biology · doi:10.1016/0022-5193(64)90038-4 · Cited by 15,725
Costerton, J. W., Lewandowski, Z., Caldwell, D. E., Korber, D. R., & Lappin-Scott, H. M. (1995) · Annual Review of Microbiology · doi:10.1146/annurev.mi.49.100195.003431 · Cited by 4,921
Biofilms: Microbial Life on Surfaces
Donlan, R. M. (2002) · Emerging infectious diseases · doi:10.3201/eid0809.020063 · Cited by 4,894
Antibiotic resistance of bacterial biofilms
Høiby, N., Bjarnsholt, T., Givskov, M., Molin, S., & Ciofu, O. (2010) · International Journal of Antimicrobial Agents · doi:10.1016/j.ijantimicag.2009.12.011 · Cited by 3,238
Self-citationMicrobial Biofilms: from Ecology to Molecular Genetics
Davey, M. E., & O’Toole, G. A. (2000) · Microbiology and Molecular Biology Reviews · doi:10.1128/mmbr.64.4.847-867.2000 · Cited by 3,184
Physiological heterogeneity in biofilms
Stewart, P. S., & Franklin, M. J. (2008) · Nature Reviews Microbiology · doi:10.1038/nrmicro1838 · Cited by 2,483
Quantification of biofilm structures by the novel computer program comstat
Heydorn, A., Nielsen, A. T., Hentzer, M., Sternberg, C., Givskov, M., Ersbøll, B. K., & Molin, S. (2000) · Microbiology · doi:10.1099/00221287-146-10-2395 · Cited by 2,185
Stewart, P. S. (2003) · Journal of Bacteriology · doi:10.1128/jb.185.5.1485-1491.2003 · Cited by 1,188
Social evolution theory for microorganisms
West, S. A., Griffin, A. S., Gardner, A., & Diggle, S. P. (2006) · Nature Reviews Microbiology · doi:10.1038/nrmicro1461 · Cited by 1,183
Self-citationBiofilm formation by Pseudomonas aeruginosa wild type, flagella and type IV pili mutants
Klausen, M., Heydorn, A., Ragas, P. C., Lambertsen, L. M., Aaes‐Jørgensen, A., Molin, S., & Tolker‐Nielsen, T. (2003) · Molecular Microbiology · doi:10.1046/j.1365-2958.2003.03525.x · Cited by 1,055
Research works printed but not linked: 1
- Characklis WG, Marshall KC. 1990. Biofilms. Wiley Interscience, New York, NY.
Cited by
Sorted by citations
Biofilms: an emergent form of bacterial life
Flemming, H.-C., Wingender, J., Szewzyk, U., Steinberg, P., Rice, S. A., & Kjelleberg, S. (2016) · Nature Reviews Microbiology · doi:10.1038/nrmicro.2016.94 · Cited by 5,979
Antibiotics versus biofilm: an emerging battleground in microbial communities
Sharma, D., Misba, L., & Khan, A. U. (2019) · Antimicrobial Resistance and Infection Control · doi:10.1186/s13756-019-0533-3 · Cited by 1,637
The biofilm life cycle: expanding the conceptual model of biofilm formation
Sauer, K., Stoodley, P., Goeres, D. M., Hall‐Stoodley, L., Burmølle, M., Stewart, P. S., & Bjarnsholt, T. (2022) · Nature Reviews Microbiology · doi:10.1038/s41579-022-00767-0 · Cited by 1,581
Self-citationComprehensive review of antimicrobial activities of plant flavonoids
Górniak, I., Bartoszewski, R., & Króliczewski, J. (2018) · Phytochemistry Reviews · doi:10.1007/s11101-018-9591-z · Cited by 1,268
Rumbaugh, K. P., & Sauer, K. (2020) · Nature Reviews Microbiology · doi:10.1038/s41579-020-0385-0 · Cited by 989
Metadata
- Authors
- Kragh, K. N., Hutchison, J. B., Melaugh, G., Rodesney, C., Roberts, A. E. L., Irie, Y., Jensen, P. Ø., Diggle, S. P., Allen, R. J., Gordon, V., & Bjarnsholt, T.
- Affiliations
- University of Copenhagen (DK)
- The University of Texas at Austin (US)
- University of Edinburgh (GB)
- University of Nottingham (GB)
- University of Bath (GB)
- Rigshospitalet (DK)
- Corresponding author
- Bjarnsholt, Thomas
- ORCID
- Venue
- mBio
- Publisher
- American Society for Microbiology
- Published
- 2016-05-04
- Volume
- 7
- Issue
- 2
- Pages
- e00237-e00237
- ISSN
- 2150-7511 (ISSN-L)
- 2161-2129
- PMC
- PMC4807362
- OpenAlex
- W2307656886
- Cited by
- 350
- References
- 48
- Citations by year
- 2026: 17 · 2025: 29 · 2024: 28 · 2023: 37 · 2022: 49 · 2021: 36 · 2020: 40 · 2019: 36 · 2018: 28 · 2017: 32 · 2016: 17
- FWCI
- 19.58
- Type
- journal article
- Language
- en
- Open access
- gold
- doi.org
- Licence
- Locations
- mBio (publishedVersion, cc-by)
- PubMed Central (publishedVersion, cc-by)
- PubMed (publishedVersion)
- Repository@Nottingham (University of Nottingham) (publishedVersion, cc-by)
- Research at the University of Copenhagen (University of Copenhagen) (publishedVersion, cc-by)
- Repository@Nottingham (University of Nottingham) (submittedVersion, cc-by)
- DOAJ (DOAJ: Directory of Open Access Journals) (submittedVersion, cc-by-sa)
- DOAJ (DOAJ: Directory of Open Access Journals) (submittedVersion)
- Nottingham ePrints (University of Nottingham) (submittedVersion, cc-by)
- Edinburgh Research Explorer (University of Edinburgh) (submittedVersion, cc-by)
- Texas ScholarWorks (Texas Digital Library) (submittedVersion, cc-by)
- Texas Digital Library (University of Texas)
- Funders
- Human Frontier Science Program (RGY0081/2012)
- Royal Society
- Lundbeckfonden
- University of Texas at Austin
- Exxon Mobil Corporation
- Topics
- Life Sciences › Biochemistry, Genetics and Molecular Biology › Molecular Biology › Bacterial biofilms and quorum sensing
- Life Sciences › Immunology and Microbiology › Microbiology › Escherichia coli research studies
- Life Sciences › Biochemistry, Genetics and Molecular Biology › Genetics › Bacterial Genetics and Biotechnology
- Keywords
- biofilm formation, multicellular aggregates, Pseudomonas aeruginosa, biofilm initiation, cell competition, planktonic cells, biofilm dispersal, antibiotic resistance, immune evasion
- MeSH terms
- Cell Adhesion, Computer Simulation, Pseudomonas aeruginosa, Biofilms
About these checks
Registry, retraction, Cites and statistics results are computed, not judged, with one exception: a printed reference that no index lists is read once by a model before it counts as a citation error. Claims are extracted by a model and kept only when their quote appears verbatim in the text; each cited source is then checked, with a model’s help, for whether it says what the claim relies on. Those verdicts can be wrong — read the claim’s quote and the cited source before relying on one.
Statistics and arithmetic are recomputed, not judged.
Confidence bands are shown only for fields calibrated on our annotated test set. None is calibrated yet, so no band is shown.
What counts as a claim ›How we measure confidence ›How we check this ›
Are you an author, or do you see a problem with this page? Request a review
