

The DOI matches its Crossref record; 61 of the 62 references it cites were found in a registry or an index.
Lambda Interferon Restructures the Nasal Microbiome and Increases Susceptibility to Staphylococcus aureus Superinfection
Open accessAbstract
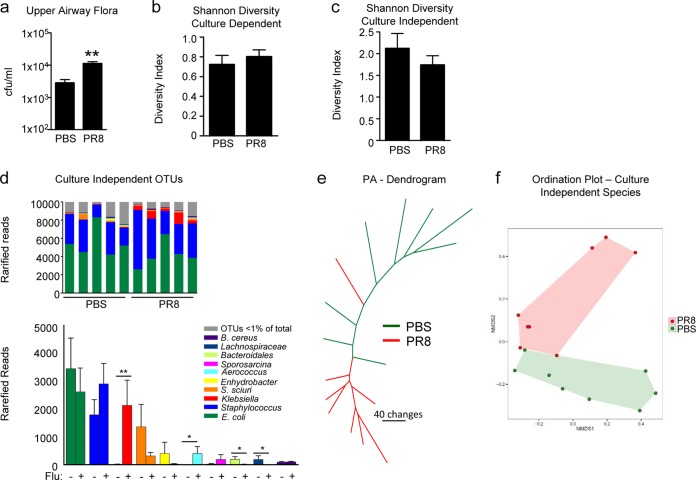
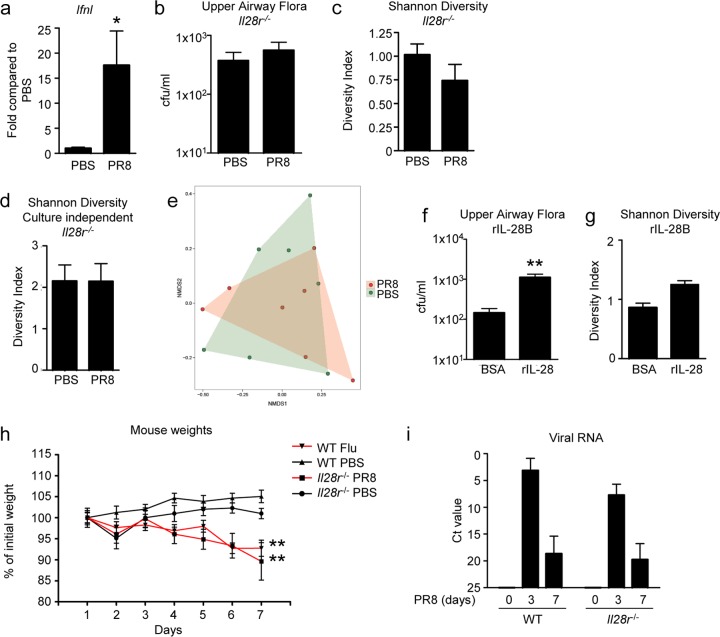
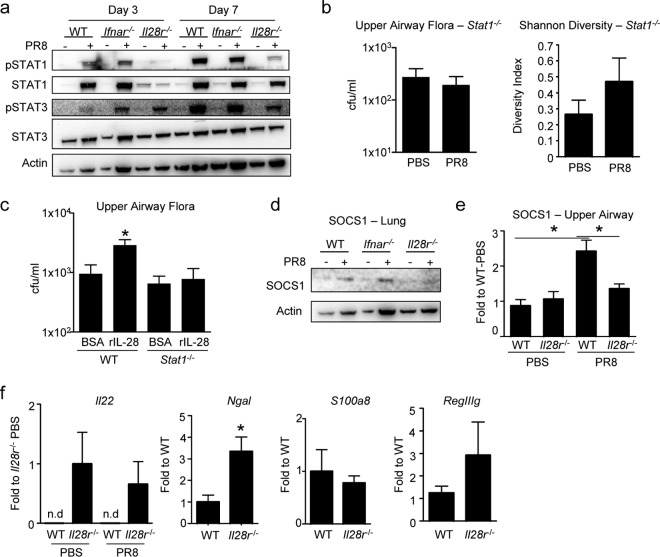
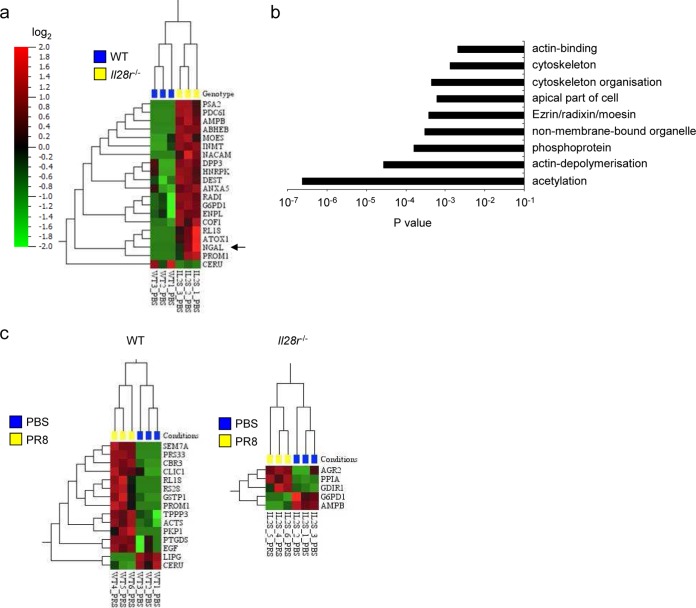
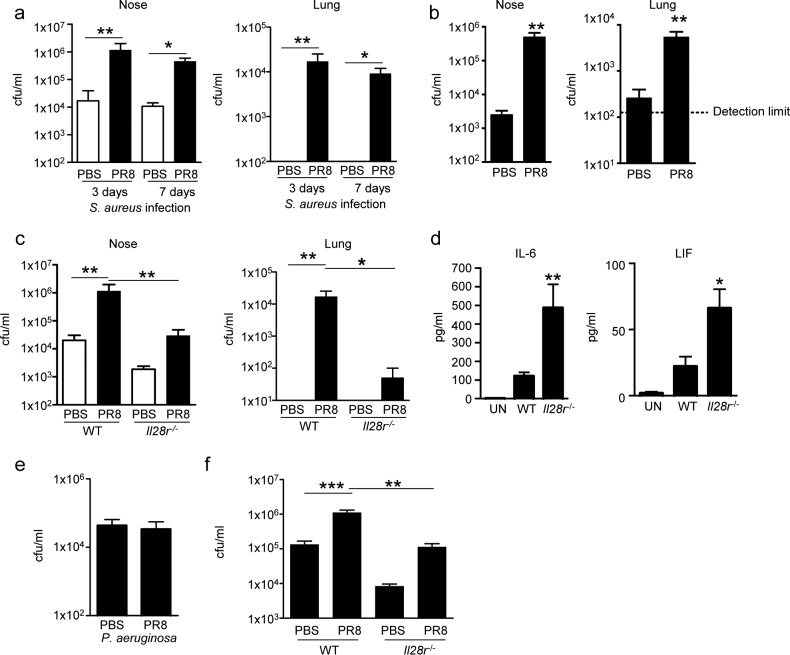
UNLABELLED: Much of the morbidity and mortality associated with influenza virus respiratory infection is due to bacterial coinfection with pathogens that colonize the upper respiratory tract such as methicillin-resistant Staphylococcus aureus (MRSA) and Streptococcus pneumoniae. A major component of the immune response to influenza virus is the production of type I and III interferons. Here we show that the immune response to infection with influenza virus causes an increase and restructuring of the upper respiratory microbiota in wild-type (WT) mice but not in Il28r(-/-) mutant mice lacking the receptor for type III interferon. Mice lacking the IL-28 receptor fail to induce STAT1 phosphorylation and expression of its regulator, SOCS1. Il28r(-/-) mutant mice have increased expression of interleukin-22 (IL-22), as well as Ngal and RegIIIγ, in the nasal cavity, the source of organisms that would be aspirated to cause pneumonia. Proteomic analysis reveals changes in several cytoskeletal proteins that contribute to barrier function in the nasal epithelium that may contribute to the effects of IL-28 signaling on the microbiota. The importance of the effects of IL-28 signaling in the pathogenesis of MRSA pneumonia after influenza virus infection was confirmed by showing that WT mice nasally colonized before or after influenza virus infection had significantly higher levels of infection in the upper airways, as well as significantly greater susceptibility to MRSA pneumonia than Il28r(-/-) mutant mice did. Our results suggest that activation of the type III interferon in response to influenza virus infection has a major effect in expanding the upper airway microbiome and increasing susceptibility to lower respiratory tract infection. IMPORTANCE: S. aureus and influenza virus are important respiratory pathogens, and coinfection with these organisms is associated with significant morbidity and mortality. The ability of influenza virus to increase susceptibility to S. aureus infection is less well understood. We show here that influenza virus leads to a change in the upper airway microbiome in a type III interferon-dependent manner. Mice lacking the type III interferon receptor have altered STAT1 and IL-22 signaling. In coinfection studies, mice without the type III interferon receptor had significantly less nasal S. aureus colonization and subsequent pneumonia than infected WT mice did. This work demonstrates that type III interferons induced by influenza virus contribute to nasal colonization and pneumonia due to S. aureus superinfection.
Overview
The claims and statistics of this paper haven’t been checked yet.
Run the check — free, no account needed. It reads the open-access text and checks the sources it cites.
Integrity signals
Registry
Cites
Statistics
Figures
Verification
Claims the paper makes
The claims and statistics of this paper haven’t been checked yet.
Run the check — free, no account needed. It reads the open-access text and checks the sources it cites.
Claims other papers make about this one
Each is checked against this paper’s own text: does it say what the citing paper says it does?
In the citing paper
“Although the data are still preliminary, animal studies have suggested that antiviral immune activation contributes to changes in the URT microbiome and facilitate colonization by potential pathogens, such as S. aureus.”
From Respiratory viral infection-induced microbiome alterations and secondary bacterial pneumonia. (2018) · cites this paper as [123]
In the citing paper
“Increased upper respiratory tract persistence of S. aureus as well as increased risk of S. aureus pneumonia was observed in flu-infected wildtype mice compared to mice lacking the type III IFN receptor (123).”
From Respiratory viral infection-induced microbiome alterations and secondary bacterial pneumonia. (2018) · cites this paper as [123]
In the citing paper
“Type III IFN, which is also induced during influenza infections, led to changes in the nasal microbiome, including increased numbers of culturable bacteria.”
From Respiratory viral infection-induced microbiome alterations and secondary bacterial pneumonia. (2018) · cites this paper as [123]
Self-check
Percentages, sums and reported differences re-computed from the paper’s own numbers.
The self-check needs the paper’s full text.
Citations
Cites
Systematic and integrative analysis of large gene lists using DAVID bioinformatics resources
Huang, D. W., Sherman, B. T., & Lempicki, R. A. (2009) · Nature Protocols · doi:10.1038/nprot.2008.211 · Cited by 35,890
QIIME allows analysis of high-throughput community sequencing data
Caporaso, J. G., Kuczynski, J., Stombaugh, J., Bittinger, K., Bushman, F. D., Costello, E. K., Fierer, N., Peña, A. G., Goodrich, J. K., Gordon, J. I., et al. (2010) · Nature Methods · doi:10.1038/nmeth.f.303 · Cited by 34,887
vegan: Community Ecology Package
Oksanen, J., Simpson, G. L., Blanchet, F. G., Kindt, R., Legendre, P., Minchin, P. R., O’Hara, R. B., Sólymos, P., Stevens, M. H. H., Szöcs, E., et al. (2001) · doi:10.32614/cran.package.vegan · Cited by 27,099
Naive Bayesian Classifier for Rapid Assignment of rRNA Sequences into the New Bacterial Taxonomy
Wang, Q., Garrity, G. M., Tiedje, J. M., & Cole, J. R. (2007) · Applied and Environmental Microbiology · doi:10.1128/aem.00062-07 · Cited by 20,145
UPARSE: highly accurate OTU sequences from microbial amplicon reads
Edgar, R. C. (2013) · Nature Methods · doi:10.1038/nmeth.2604 · Cited by 16,770
Ultra-high-throughput microbial community analysis on the Illumina HiSeq and MiSeq platforms
Caporaso, J. G., Lauber, C. L., Walters, W. A., Berg-Lyons, D., Huntley, J., Fierer, N., Owens, S. M., Betley, J., Fraser, L., Bauer, M., et al. (2012) · The ISME Journal · doi:10.1038/ismej.2012.8 · Cited by 8,839
(2009) · Cited by 6,571
Vegan : community ecology package. R package version 1.17-9
Oksanen, J. (2007) · Medical Entomology and Zoology · Cited by 6,549
McDonald, D. T., Price, M. N., Goodrich, J. K., Nawrocki, E. P., DeSantis, T. Z., Probst, A. J., Andersen, G. L., Knight, R. D., & Hugenholtz, P. (2011) · The ISME Journal · doi:10.1038/ismej.2011.139 · Cited by 5,144
Elias, J. E., & Gygi, S. P. (2007) · Nature Methods · doi:10.1038/nmeth1019 · Cited by 3,925
Cited by
Sorted by citations
Respiratory viral infection-induced microbiome alterations and secondary bacterial pneumonia.
Hanada, S., Pirzadeh, M., Carver, K. Y., & Deng, J. C. (2018) · Frontiers in Immunology · doi:10.3389/fimmu.2018.02640 · Cited by 495
Type III interferons disrupt the lung epithelial barrier upon viral recognition
Broggi, A., Ghosh, S., Sposito, B., Spreafico, R., Balzarini, F., Cascio, A. L., Clementi, N., Santis, M. D., Mancini, N., Granucci, F., et al. (2020) · Science · doi:10.1126/science.abc3545 · Cited by 403
Sencio, V., Barthélémy, A., Tavares, L. P., Machado, M. G., Soulard, D., Cuinat, C., Queiroz‐Junior, C. M., Noordine, M.-L., Salomé‐Desnoulez, S., Deryuter, L., et al. (2020) · Cell Reports · doi:10.1016/j.celrep.2020.02.013 · Cited by 367
Yildiz, S., Mazel-Sanchez, B., Kandasamy, M., Manicassamy, B., & Schmolke, M. (2018) · Microbiome · doi:10.1186/s40168-017-0386-z · Cited by 264
COVID-19 and emerging viral infections: The case for interferon lambda
Prokunina‐Olsson, L., Alphonse, N., Dickenson, R. E., Durbin, J. E., Glenn, J. S., Hartmann, R., Kotenko, S. V., Lazear, H. M., OʼBrien, T. R., Odendall, C., et al. (2020) · The Journal of Experimental Medicine · doi:10.1084/jem.20200653 · Cited by 200
Metadata
- Authors
- Planet, P. J., Parker, D., Cohen, T. S., Smith, H., Leon, J. D., Ryan, C., Hammer, T. J., Fierer, N., Chen, E. I., & Prince, A. S.
- Affiliations
- American Museum of Natural History (US)
- Columbia University (US)
- Herbert Irving Comprehensive Cancer Center (US)
- University of Colorado Boulder (US)
- Cooperative Institute for Research in Environmental Sciences (US)
- Columbia University Irving Medical Center (US)
- Corresponding author
- Prince, Alice S.
- ORCID
- Venue
- mBio
- Publisher
- American Society for Microbiology
- Published
- 2016-03-02
- Volume
- 7
- Issue
- 1
- Pages
- e01939-15
- ISSN
- 2150-7511 (ISSN-L)
- 2161-2129
- PMC
- PMC4752601
- OpenAlex
- W2261043905
- Cited by
- 113
- References
- 62
- Citations by year
- 2026: 1 · 2025: 4 · 2024: 7 · 2023: 10 · 2022: 9 · 2021: 16 · 2020: 27 · 2019: 13 · 2018: 13 · 2017: 6 · 2016: 7
- FWCI
- 7.87
- Type
- journal article
- Language
- en
- Open access
- gold
- doi.org
- Licence
- Locations
- mBio (publishedVersion, cc-by-nc-sa)
- PubMed Central (publishedVersion, cc-by-nc-sa)
- PubMed (publishedVersion)
- CU Scholar (University of Colorado Boulder) (submittedVersion)
- DOAJ (DOAJ: Directory of Open Access Journals) (submittedVersion, cc-by-sa)
- DOAJ (DOAJ: Directory of Open Access Journals) (submittedVersion)
- Funders
- HHS | National Institutes of Health (K08AI101005, HL079395, P30CA013696, R56HL125653)
- Topics
- Life Sciences › Immunology and Microbiology › Immunology › interferon and immune responses
- Health Sciences › Medicine › Epidemiology › Influenza Virus Research Studies
- Health Sciences › Medicine › Epidemiology › Respiratory viral infections research
- Keywords
- interferon lambda, influenza virus, Staphylococcus aureus, MRSA pneumonia, upper respiratory tract microbiome, nasal microbiota, secondary bacterial infection, IL-22, STAT1 signaling, SOCS1, nasal epithelial barrier, cytoskeletal proteins, bacterial co-infection
- MeSH terms
- Interferon Lambda, Animals, Interleukins, Nasal Cavity, Orthomyxoviridae Infections, Pneumonia, Staphylococcal, Staphylococcus aureus, Superinfection, Cytokines, Mice, Knockout, Mice, Microbiota
About these checks
Registry, retraction, Cites and statistics results are computed, not judged, with one exception: a printed reference that no index lists is read once by a model before it counts as a citation error. Claims are extracted by a model and kept only when their quote appears verbatim in the text; each cited source is then checked, with a model’s help, for whether it says what the claim relies on. Those verdicts can be wrong — read the claim’s quote and the cited source before relying on one.
Statistics and arithmetic are recomputed, not judged.
Confidence bands are shown only for fields calibrated on our annotated test set. None is calibrated yet, so no band is shown.
What counts as a claim ›How we measure confidence ›How we check this ›
Are you an author, or do you see a problem with this page? Request a review
