

The DOI matches its Crossref record; 104 of the 105 references it cites were found in a registry or an index.
Gene Essentiality Analyzed by In Vivo Transposon Mutagenesis and Machine Learning in a Stable Haploid Isolate of Candida albicans
Open accessAbstract
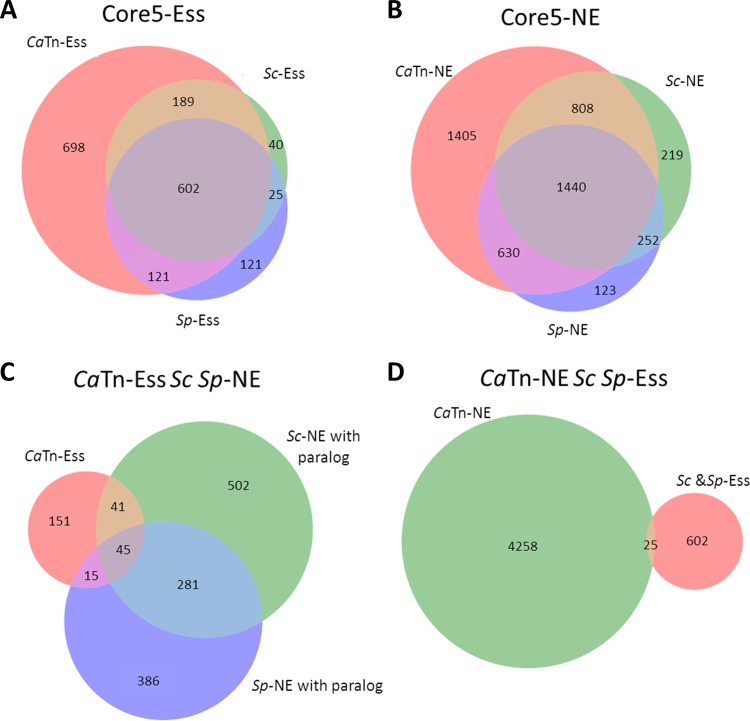
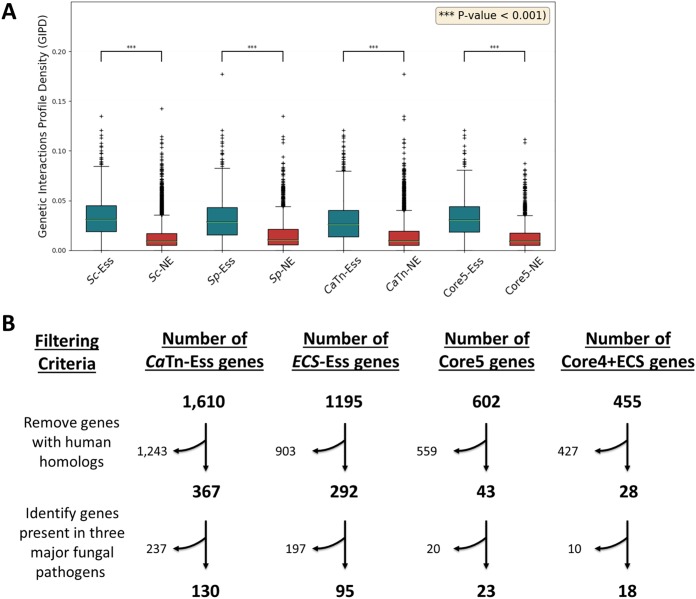
Comprehensive understanding of an organism requires that we understand the contributions of most, if not all, of its genes. Classical genetic approaches to this issue have involved systematic deletion of each gene in the genome, with comprehensive sets of mutants available only for very-well-studied model organisms. We took a different approach, harnessing the power of in vivo transposition coupled with deep sequencing to identify >500,000 different mutations, one per cell, in the prevalent human fungal pathogen Candida albicans and to map their positions across the genome. The transposition approach is efficient and less labor-intensive than classic approaches. Here, we describe the production and analysis (aided by machine learning) of a large collection of mutants and the comprehensive identification of 1,610 C. albicans genes that are essential for growth under standard laboratory conditions. Among these C. albicans essential genes, we identify those that are also essential in two distantly related model yeasts as well as those that are conserved in all four major human fungal pathogens and that are not conserved in the human genome. This list of genes with functions important for the survival of the pathogen provides a good starting point for the development of new antifungal drugs, which are greatly needed because of the emergence of fungal pathogens with elevated resistance and/or tolerance of the currently limited set of available antifungal drugs.
Overview
The claims and statistics of this paper haven’t been checked yet.
Run the check — free, no account needed. It reads the open-access text and checks the sources it cites.
Integrity signals
Registry
Cites
Statistics
Figures
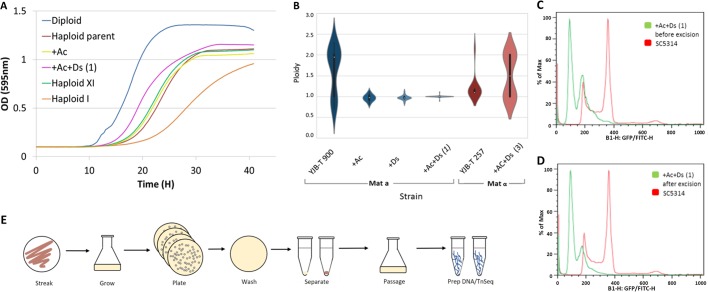
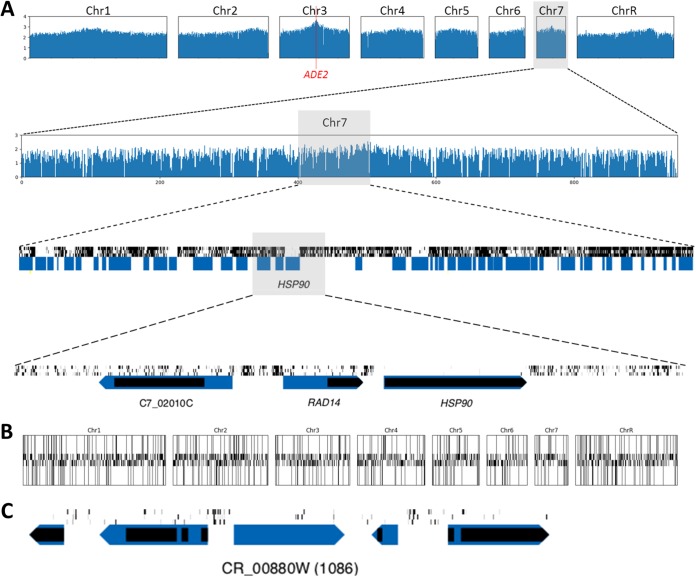
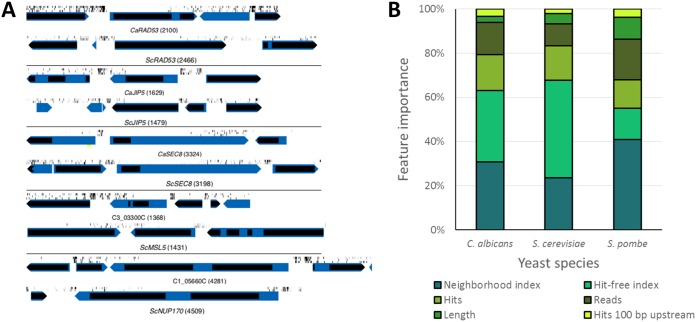
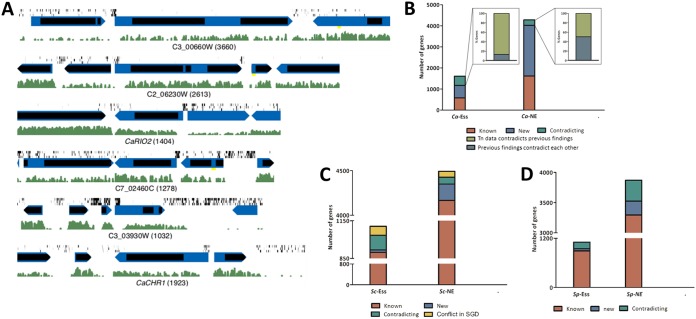
Verification
Claims the paper makes
The claims and statistics of this paper haven’t been checked yet.
Run the check — free, no account needed. It reads the open-access text and checks the sources it cites.
Claims other papers make about this one
Each is checked against this paper’s own text: does it say what the citing paper says it does?
In the citing paper
“In several fungal species, including the model yeast Saccharomyces cerevisiae and the distantly related fungal pathogen C. albicans, it is estimated that ∼20% of the open reading frames in their genomes are essential (Winzeler et al. 1999; Segal et al. 2018).”
From Genetic analysis of Hsp90 function in Cryptococcus neoformans highlights key roles in stress tolerance and virulence (2022) · cites this paper as Segal et al. 2018
Self-check
Percentages, sums and reported differences re-computed from the paper’s own numbers.
The self-check needs the paper’s full text.
Citations
Cites
Breiman, L. (2001) · Machine Learning · doi:10.1023/a:1010933404324 · Cited by 133,538
Scikit-learn: Machine Learning in Python
Pedregosa, F., Varoquaux, G., Gramfort, A., Michel, V., Thirion, B., Grisel, O., Blondel, M., Müller, A., Nothman, J., Louppe, G., et al. (2012) · arXiv · doi:10.48550/arxiv.1201.0490 · Cited by 71,016
The Sequence Alignment/Map format and SAMtools
Li, H., Handsaker, B., Wysoker, A., Fennell, T., Ruan, J., Homer, N., Marth, G., Abecasis, G., Durbin, R., & 1000 Genome Project Data Processing Subgroup (2009) · Bioinformatics · doi:10.1093/bioinformatics/btp352 · Cited by 62,041
Fast gapped-read alignment with Bowtie 2
Langmead, B., & Salzberg, S. L. (2012) · Nature Methods · doi:10.1038/nmeth.1923 · Cited by 56,400
Cutadapt removes adapter sequences from high-throughput sequencing reads
Martin, M. (2011) · EMBnet.journal · doi:10.14806/ej.17.1.200 · Cited by 33,889
Classification And Regression Trees
Breiman, L., Friedman, J. H., Olshen, R. A., & Stone, C. J. (2017) · doi:10.1201/9781315139470 · Cited by 11,417
Database resources of the National Center for Biotechnology Information: update
Wheeler, D. L. (2003) · Nucleic Acids Research · doi:10.1093/nar/gkh073 · Cited by 10,695
Database resources of the National Center for Biotechnology Information
Agarwala, R., Barrett, T., Beck, J., Benson, D., Bollin, C., Bolton, E. E., Bourexis, D., Brister, J., Bryant, S. H., Canese, K., et al. (2017) · Nucleic Acids Res. · doi:10.1093/nar/gkx1095 · Cited by 6,277
Current protocols in molecular biology
Dudley, R. K. (1988) · FEBS Letters · doi:10.1016/0014-5793(88)80264-3 · Cited by 6,004
NWChem: A comprehensive and scalable open-source solution for large scale molecular simulations
Valiev, M., Bylaska, E. J., Govind, N., Kowalski, K., Straatsma, T. P., van Dam, H. J. J., Wang, D., Nieplocha, J., Aprà, E., Windus, T. L., et al. (2010) · Computer Physics Communications · doi:10.1016/j.cpc.2010.04.018 · Cited by 5,849
Cited by
Sorted by citations
Drug resistance and tolerance in fungi.
Berman, J., & Krysan, D. J. (2020) · Nature Reviews Microbiology · doi:10.1038/s41579-019-0322-2 · Cited by 642
Self-citationThe importance of antimicrobial resistance in medical mycology
Gow, N. A. R., Johnson, C., Berman, J. G., Coste, A. T., Cuomo, C. A., Perlin, D. S., Bicanic, T. A., Harrison, T. S., Wiederhold, N. P., Bromley, M., et al. (2022) · Nature Communications · doi:10.1038/s41467-022-32249-5 · Cited by 232
Self-citationCandida albicans and Candida glabrata : global priority pathogens
Katsipoulaki, M., Stappers, M. H. T., Malavia-Jones, D., Brunke, S., Hube, B., & Gow, N. A. R. (2024) · Microbiology and Molecular Biology Reviews · doi:10.1128/mmbr.00021-23 · Cited by 180
Self-citationExtensive loss of cell-cycle and DNA repair genes in an ancient lineage of bipolar budding yeasts
Steenwyk, J. L., Opulente, D. A., Kominek, J., Shen, X.-X., Zhou, X., Labella, A. L., Bradley, N. P., Eichman, B. F., Čadež, N., Libkind, D., et al. (2019) · PLoS Biology · doi:10.1371/journal.pbio.3000255 · Cited by 162
“cerevisiae [64], and 73% of Candida albicans [65] genes are 459 dispensable in laboratory conditions.”
BackgroundSelf-citationFrom Jekyll to Hyde: The Yeast–Hyphal Transition of Candida albicans
Chow, E. W. L., Pang, L. M., & Wang, Y. (2021) · Pathogens · doi:10.3390/pathogens10070859 · Cited by 154
Current trends, limitations and future research in the fungi?
Hyde, K. D., Baldrián, P., Chen, Y., Chethana, K. W. T., de Hoog, S., Doilom, M., de Farias, A. R. G., Gonçalves, M. F. M., Gonkhom, D., Gui, H., et al. (2024) · Fungal Diversity · doi:10.1007/s13225-023-00532-5 · Cited by 144
Cellular quiescence in budding yeast
Sun, S., & Gresham, D. (2020) · Yeast · doi:10.1002/yea.3545 · Cited by 108
Lu, H., Hong, T., Jiang, Y., Whiteway, M. S., & Zhang, S. (2023) · Advanced Drug Delivery Reviews · doi:10.1016/j.addr.2023.114960 · Cited by 103
Fu, C., Zhang, X., Veri, A. O., Iyer, K. R., Lash, E., Xue, A., Yan, H., Revie, N. M., Wong, C. J., Lin, Z., et al. (2021) · Nature Communications · doi:10.1038/s41467-021-26850-3 · Cited by 90
Orozco-Arias, S., Piña, J. S., Tabares-Soto, R., Castillo, L., Guyot, R., & Isaza, G. A. (2020) · Processes · doi:10.3390/pr8060638 · Cited by 76
A CRISPR Interference Platform for Efficient Genetic Repression in Candida albicans
Wensing, L. F., Sharma, J., Uthayakumar, D., Proteau, Y., Chavez, A., & Shapiro, R. S. (2019) · mSphere · doi:10.1128/msphere.00002-19 · Cited by 71
The CRISPR toolbox in medical mycology: State of the art and perspectives
Morio, F., Lombardi, L., & Butler, G. (2020) · PLoS Pathogens · doi:10.1371/journal.ppat.1008201 · Cited by 66
Plasmid-Based CRISPR-Cas9 Gene Editing in Multiple Candida Species
Lombardi, L., Oliveira-Pacheco, J., & Butler, G. (2019) · mSphere · doi:10.1128/msphere.00125-19 · Cited by 67
Overcoming Fungal Echinocandin Resistance through Inhibition of the Non-essential Stress Kinase Yck2
Caplan, T., Lorente-Macías, Á., Stogios, P. J., Evdokimova, E., Hyde, S., Wellington, M. A., Liston, S., Iyer, K. R., Puumala, E., Shekhar-Guturja, T., et al. (2020) · Cell Chemical Biology · doi:10.1016/j.chembiol.2019.12.008 · Cited by 57
Transposon Insertion Sequencing, a Global Measure of Gene Function
van Opijnen, T., & Levin, H. L. (2020) · Annual Review of Genetics · doi:10.1146/annurev-genet-112618-043838 · Cited by 58
Gale, A. N., Sakhawala, R. M., Levitan, A., Sharan, R., Berman, J., Timp, W., & Cunningham, K. W. (2020) · G3 Genes|Genomes|Genetics · doi:10.1534/g3.120.401595 · Cited by 56
Self-citationMohammad, H. T., Eldesouky, H. E., Hazbun, T. R., Mayhoub, A. S., & Seleem, M. N. (2019) · Scientific Reports · doi:10.1038/s41598-019-55379-1 · Cited by 54
Gusa, A. A., Yadav, V., Roth, C., Williams, J. D., Shouse, E. M., Magwene, P. M., Heitman, J., & Jinks-Robertson, S. (2023) · Proceedings of the National Academy of Sciences · doi:10.1073/pnas.2209831120 · Cited by 58
Systematic analysis of bypass suppression of essential genes
van Leeuwen, J. S., Pons, C., Tan, G., Wang, J. Z., Hou, J., Weile, J., Gebbia, M., Liang, W., Shuteriqi, E., Li, Z., et al. (2020) · Molecular Systems Biology · doi:10.15252/msb.20209828 · Cited by 57
Recent advances in understanding Candida albicans hyphal growth
Arkowitz, R. A., & Bassilana, M. (2019) · F1000Research · doi:10.12688/f1000research.18546.1 · Cited by 51
Candida albicans Pma1p Contributes to Growth, pH Homeostasis, and Hyphal Formation
Rane, H. S., Hayek, S. R., Frye, J. E., Abeyta, E. L., Bernardo, S. M., Parra, K. J., & Lee, S. A. (2019) · Frontiers in Microbiology · doi:10.3389/fmicb.2019.01012 · Cited by 50
CRISPR-Based Genetic Manipulation of Candida Species: Historical Perspectives and Current Approaches
Uthayakumar, D., Sharma, J., Wensing, L. F., & Shapiro, R. S. (2021) · Frontiers in Genome Editing · doi:10.3389/fgeed.2020.606281 · Cited by 53
Calcium-calcineurin signaling pathway in Candida albicans: A potential drug target
Li, W., Shrivastava, M., Lu, H., & Jiang, Y. (2021) · Microbiological Research · doi:10.1016/j.micres.2021.126786 · Cited by 47
DeJarnette, C. A., Luna-Tapia, A., Estredge, L. R., & Palmer, G. E. (2020) · mSphere · doi:10.1128/msphere.00374-20 · Cited by 49
Candida albicans: An Emerging Yeast Model to Study Eukaryotic Genome Plasticity
Legrand, M., Jaitly, P., Feri, A., d’Enfert, C., & Sanyal, K. (2019) · Trends in Genetics · doi:10.1016/j.tig.2019.01.005 · Cited by 47
Orozco-Arias, S., Isaza, G. A., Guyot, R., & Tabares-Soto, R. (2019) · PeerJ · doi:10.7717/peerj.8311 · Cited by 43
Metabolic Reprogramming in the Opportunistic Yeast Candida albicans in Response to Hypoxia
Burgain, A., Tebbji, F., Khemiri, I., & Sellam, A. (2020) · mSphere · doi:10.1128/msphere.00913-19 · Cited by 45
The Candida Genome Database: annotation and visualization updates
Lew-Smith, J., Binkley, J., & Sherlock, G. (2025) · Genetics · doi:10.1093/genetics/iyaf001 · Cited by 37
Fungal resilience and host–pathogen interactions: Future perspectives and opportunities
Brown, A. J. P. (2022) · Parasite Immunology · doi:10.1111/pim.12946 · Cited by 41
Lee, S. Y., Hung, S., Esnault, C., Pathak, R., Johnson, K. R., Bankole, O., Yamashita, A., Zhang, H., & Levin, H. L. (2020) · Cell Reports · doi:10.1016/j.celrep.2020.01.094 · Cited by 32
Fu, C., Beattie, S. R., Jezewski, A. J., Robbins, N., Whitesell, L., Krysan, D. J., & Cowen, L. E. (2022) · Genetics · doi:10.1093/genetics/iyab164 · Cited by 31
Structure-guided approaches to targeting stress responses in human fungal pathogens
LeBlanc, E. V., Polvi, E. J., Veri, A. O., Privé, G. G., & Cowen, L. E. (2020) · Journal of Biological Chemistry · doi:10.1074/jbc.rev120.013731 · Cited by 35
Scott, J., Sueiro-Olivares, M., Thornton, B. P., Owens, R. A., Muhamadali, H., Fortune‐Grant, R., Thomson, D. D., Thomas, R., Hollywood, K. A., Doyle, S., et al. (2020) · mBio · doi:10.1128/mbio.01985-20 · Cited by 32
Novel Promising Antifungal Target Proteins for Conquering Invasive Fungal Infections
Zhen, C., Lu, H., & Jiang, Y. (2022) · Frontiers in Microbiology · doi:10.3389/fmicb.2022.911322 · Cited by 35
Lu, H., Li, W., Whiteway, M., Wang, H., Zhu, S., Ji, Z., Feng, Y., Yan, L., Fang, T., Li, L., et al. (2023) · mBio · doi:10.1128/mbio.02639-22 · Cited by 30
Sanchez, M. R., Payen, C., Cheong, F., Hovde, B. T., Bissonnette, S. A., Arkin, A. P., Skerker, J. M., Brem, R. B., Caudy, A. A., & Dunham, M. J. (2019) · Genome Research · doi:10.1101/gr.232330.117 · Cited by 28
Heredia, M. Y., Ikeh, M. A. C., Gunasekaran, D., Conrad, K. A., Filimonava, S., Marotta, D. H., Nobile, C. J., & Rauceo, J. M. (2020) · PLoS Genetics · doi:10.1371/journal.pgen.1008908 · Cited by 31
Gutierrez-Perez, C., & Cramer, R. A. (2025) · npj Antimicrobials and Resistance · doi:10.1038/s44259-025-00093-4 · Cited by 35
Steenwyk, J. L., Phillips, M. A., Yang, F. J., Date, S. S., Graham, T. R., Berman, J. G., Hittinger, C. T., & Rokas, A. (2022) · Science Advances · doi:10.1126/sciadv.abn0105 · Cited by 23
Self-citationSnyder, N. A., Kim, A., Kester, L., Gale, A. N., Studer, C., Hoepfner, D., Roggo, S. P., Helliwell, S. B., & Cunningham, K. W. (2019) · G3 Genes Genomes Genetics · doi:10.1534/g3.118.200748 · Cited by 21
Levitan, A., Gale, A. N., Dallon, E., Kozan, D. W., Cunningham, K. W., Sharan, R., & Berman, J. G. (2020) · Current Genetics · doi:10.1007/s00294-020-01096-6 · Cited by 25
Self-citationModulation of the complex regulatory network for methionine biosynthesis in fungi
Shrivastava, M., Feng, J., Coles, M., Clark, B., Islam, A., Dumeaux, V., & Whiteway, M. S. (2021) · Genetics · doi:10.1093/genetics/iyaa049 · Cited by 24
Ennis, C. L., Hernday, A. D., & Nobile, C. J. (2021) · Microbiology Spectrum · doi:10.1128/spectrum.01820-21 · Cited by 26
Genetic Modification of Closely Related Candida Species
Mancera, E., Frazer, C., Porman, A. M., Ruiz‐Castro, S., Johnson, A. D., & Bennett, R. J. (2019) · Frontiers in Microbiology · doi:10.3389/fmicb.2019.00357 · Cited by 22
DeORFanizing Candida albicans Genes using Coexpression
O’Meara, T. R., & O’Meara, M. J. (2021) · mSphere · doi:10.1128/msphere.01245-20 · Cited by 20
Chen, P., Michel, A. H., & Zhang, J. (2022) · Nature Communications · doi:10.1038/s41467-022-29228-1 · Cited by 19
Hgc1 Independence of Biofilm Hyphae in Candida albicans
Sharma, A., Solis, N. V., Huang, M. Y., Lanni, F., Filler, S. G., & Mitchell, A. P. (2023) · mBio · doi:10.1128/mbio.03498-22 · Cited by 18
Li, Z., Wang, H., Cai, C., Wong, A. H., Wang, J., Gao, J., & Wang, Y. (2020) · Nature Protocols · doi:10.1038/s41596-020-0351-3 · Cited by 18
Respiration supports intraphagosomal filamentation and escape of Candida albicans from macrophages
Case, N. T., Westman, J., Hallett, M. T., Plumb, J. D., Farheen, A., Maxson, M. E., MacAlpine, J., Liston, S. D., Hube, B., Robbins, N., et al. (2023) · mBio · doi:10.1128/mbio.02745-23 · Cited by 18
Mobile genetic element-based gene editing and genome engineering: Recent advances and applications
Hwang, J., Ye, D.-Y., Jung, G. Y., & Jang, S. (2024) · Biotechnology Advances · doi:10.1016/j.biotechadv.2024.108343 · Cited by 20
Wu, H., Ji, Z., Huang, X., Li, L., Hang, S., Yu, J., Lu, H., & Jiang, Y. (2024) · ACS Infectious Diseases · doi:10.1021/acsinfecdis.4c00399 · Cited by 16
Billmyre, R. B., Craig, C. J., Lyon, J. W., Reichardt, C., Kuhn, A. M., Eickbush, M. T., & Zanders, S. E. (2025) · PLoS Biology · doi:10.1371/journal.pbio.3003184 · Cited by 28
Exploring conditional gene essentiality through systems genetics approaches in yeast
Bosch-Guiteras, N., & van Leeuwen, J. S. (2022) · Current Opinion in Genetics & Development · doi:10.1016/j.gde.2022.101963 · Cited by 18
Regulation of heme utilization and homeostasis in Candida albicans
Andrawes, N., Weissman, Z., Pinsky, M., Moshe, S., Berman, J., & Kornitzer, D. (2022) · PLOS Genetics · doi:10.1371/journal.pgen.1010390 · Cited by 17
Self-citationAdvances in Molecular Tools and In Vivo Models for the Study of Human Fungal Pathogenesis
Malavia, D., Gow, N. A. R., & Usher, J. (2020) · Microorganisms · doi:10.3390/microorganisms8060803 · Cited by 15
Self-citationRashid, S., Correia-Mesquita, T. O., Godoy, P., Omran, R. P., & Whiteway, M. (2022) · Frontiers in Cellular and Infection Microbiology · doi:10.3389/fcimb.2022.764711 · Cited by 15
Billmyre, R. B., Eickbush, M. T., Craig, C. J., Lange, J. J., Wood, C. J., Helston, R. M., & Zanders, S. E. (2022) · PLoS Genetics · doi:10.1371/journal.pgen.1010462 · Cited by 15
Selection or drift: The population biology underlying transposon insertion sequencing experiments
Mahmutovic, A., Wiesch, P. A. Z., & Abel, S. (2020) · Computational and Structural Biotechnology Journal · doi:10.1016/j.csbj.2020.03.021 · Cited by 14
Michel, A. H., van Schie, S. N. S., Mosbach, A., Scalliet, G., & Kornmann, B. (2019) · bioRxiv (Cold Spring Harbor Laboratory) · doi:10.1101/866483 · Cited by 13
SAturated Transposon Analysis in Yeast (SATAY) for Deep Functional Mapping of Yeast Genomes
Michel, A. H., & Kornmann, B. (2022) · Methods in molecular biology · doi:10.1007/978-1-0716-2257-5_20 · Cited by 14
The phosphatome of opportunistic pathogen Candida species
Szabó, K., Miskei, M., Farkas, I., & Dombrádi, V. (2021) · Fungal Biology Reviews · doi:10.1016/j.fbr.2020.12.002 · Cited by 13
A Myosin Light Chain Is Critical for Fungal Growth Robustness in Candida albicans
Puerner, C. T. S., Serrano, A., Wakade, R. S., Bassilana, M., & Arkowitz, R. A. (2021) · mBio · doi:10.1128/mbio.02528-21 · Cited by 12
Wensing, L. F., & Shapiro, R. S. (2021) · Methods in molecular biology · doi:10.1007/978-1-0716-1720-5_4 · Cited by 13
Copy number variation alters local and global mutational tolerancePreprint
Avecilla, G., Spealman, P., Matthews, J. C., Caudal, É., Schacherer, J., & Gresham, D. (2023) · Genome Research · doi:10.1101/gr.277625.122 · Cited by 14
Xiong, E. H., Zhang, X., Yan, H., Ward, H. N., Lin, Z., Wong, C. J., Fu, C., Gingras, A., Noble, S. M., Robbins, N., et al. (2024) · Cell Reports · doi:10.1016/j.celrep.2024.114601 · Cited by 12
Exploring the druggable proteome of Candida species through comprehensive computational analysis
Mukherjee, S., Kundu, I., Askari, M., Barai, R. S., Venkatesh, K. V., & Idicula‐Thomas, S. (2021) · Genomics · doi:10.1016/j.ygeno.2020.12.040 · Cited by 14
Genomic Approaches to Antifungal Drug Target Identification and Validation
Robbins, N., & Cowen, L. E. (2022) · Annual Review of Microbiology · doi:10.1146/annurev-micro-041020-094524 · Cited by 15
Dantuluri, S., Schwer, B., Abdullahu, L., Damha, M. J., & Shuman, S. (2021) · RNA · doi:10.1261/rna.078660.120 · Cited by 12
Evolution and strain diversity advance exploration of Candida albicans biology
Anderson, M. Z., & Dietz, S. M. (2024) · mSphere · doi:10.1128/msphere.00641-23 · Cited by 11
The SAGA and NuA4 component Tra1 regulates Candida albicans drug resistance and pathogenesis
Razzaq, I., Berg, M. D., Jiang, Y., Genereaux, J. L., Uthayakumar, D., Kim, G. H., Agyare-Tabbi, M. R., Halder, V., Brandl, C. J., Lajoie, P., et al. (2021) · Genetics · doi:10.1093/genetics/iyab131 · Cited by 9
Nickels, T. J., Gale, A. N., Harrington, A. A., Timp, W., & Cunningham, K. W. (2024) · G3 Genes Genomes Genetics · doi:10.1093/g3journal/jkae173 · Cited by 10
The identification of essential cellular genes is critical for validating drug targets
Xu, T., Wang, S., Ma, T., Dong, Y., Ashby, C. R., & Hao, G. (2024) · Drug Discovery Today · doi:10.1016/j.drudis.2024.104215 · Cited by 10
The renaissance of yeasts as microbial factories in the modern age of biomanufacturing
Payen, C., & Thompson, D. A. (2019) · Yeast · doi:10.1002/yea.3439 · Cited by 10
A data library of Candida albicans functional genomic screens
Gervais, N. C., Halder, V., & Shapiro, R. S. (2021) · FEMS Yeast Research · doi:10.1093/femsyr/foab060 · Cited by 8
Rizzo, M., Soisangwan, N., Vega, S. B. P., Price, R. J., Uyl, C., Iracane, E., Shaw, M., Soetaert, J., Selmecki, A. M., & Buscaino, A. (2022) · PLoS Genetics · doi:10.1371/journal.pgen.1010576 · Cited by 8
Ruiz-Castilla, F. J., Bieber, J., Caro, G., Michán, C., Sychrová, H., & Ramos, J. (2020) · Biochimica et Biophysica Acta (BBA) - Biomembranes · doi:10.1016/j.bbamem.2020.183486 · Cited by 9
Banerjee, A., Goldgur, Y., Schwer, B., & Shuman, S. (2019) · Nucleic Acids Research · doi:10.1093/nar/gkz1049 · Cited by 8
Isolation and characterization of haploid heterothallic beer yeasts
Badura, J., Bernardi, B., Muno-Bender, J., Matti, K., Zimmer, K., & Wendland, J. (2025) · Applied Microbiology and Biotechnology · doi:10.1007/s00253-024-13397-8 · Cited by 7
Application of the Mutant Libraries for Candida albicans Functional Genomics
Wang, R., Liu, J., Liu, Y., Lv, Q., & Yan, L. (2022) · International Journal of Molecular Sciences · doi:10.3390/ijms232012307 · Cited by 10
Structural basis for Tpt1-catalyzed 2′-PO 4 transfer from RNA and NADP(H) to NAD +
Jacewicz, A., Dantuluri, S., & Shuman, S. (2023) · Proceedings of the National Academy of Sciences · doi:10.1073/pnas.2312999120 · Cited by 7
Molaeitabari, A., & Dahms, T. E. S. (2025) · Microbiology Spectrum · doi:10.1128/spectrum.02754-24 · Cited by 7
Marton, T., Feri, A., Commère, P., Maufrais, C., d’Enfert, C., & Legrand, M. (2019) · mSphere · doi:10.1128/msphere.00709-18 · Cited by 6
Shoukat, I., Frazer, C., & Allingham, J. S. (2019) · mSphere · doi:10.1128/msphere.00610-19 · Cited by 7
Dantuluri, S., Abdullahu, L., Munir, A., Katolik, A., Damha, M. J., & Shuman, S. (2020) · RNA · doi:10.1261/rna.074377.119 · Cited by 7
Cellular Localization of Carbonic Anhydrase Nce103p in Candida albicans and Candida parapsilosis
Dostál, J., Bláha, J., Hadravová, R., Hubálek, M., Hrušková‐Heidingsfeldová, O., & Pichová, I. (2020) · International Journal of Molecular Sciences · doi:10.3390/ijms21030850 · Cited by 7
Candida albicans Potassium Transporters
Ruiz-Castilla, F. J., Ruiz-Pérez, F., Ramos‐Moreno, L., & Ramos, J. (2022) · International Journal of Molecular Sciences · doi:10.3390/ijms23094884 · Cited by 7
Kuplińska, A., Rząd, K., Wojciechowski, M., Milewski, S., & Gabriel, I. (2022) · International Journal of Molecular Sciences · doi:10.3390/ijms23147763 · Cited by 7
Hijacking Transposable Elements for Saturation Mutagenesis in Fungi
Schrevens, S., & Sanglard, D. (2021) · Frontiers in Fungal Biology · doi:10.3389/ffunb.2021.633876 · Cited by 7
Billmyre, R. B., Craig, C. J., Lyon, J. W., Reichardt, C., Eickbush, M. T., & Zanders, S. E. (2024) · bioRxiv (Cold Spring Harbor Laboratory) · doi:10.1101/2024.07.28.605507 · Cited by 7
Discovery and mechanism of a highly selective, antifungal acetyl-CoA synthetase inhibitor
Jezewski, A. J., Alden, K. M., Propp, J., Daraji, D. G., Lail, C. L., Heene, M. E., Fuller, A. J., Ferreira, J. C., Liu, L., Battaile, K. P., et al. (2025) · Nature Communications · doi:10.1038/s41467-025-64183-7 · Cited by 6
New approaches to tackle a rising problem: Large-scale methods to study antifungal resistance
Després, P. C., Shapiro, R. S., & Cuomo, C. A. (2024) · PLoS Pathogens · doi:10.1371/journal.ppat.1012478 · Cited by 6
Huang, M. Y., Nalley, M. J., Hecht, P. C., & Madhani, H. D. (2025) · G3 Genes Genomes Genetics · doi:10.1093/g3journal/jkaf071 · Cited by 6
Jung, K., Kwon, S., Jung, J., & Bahn, Y. (2022) · Microbiology Spectrum · doi:10.1128/spectrum.01044-22 · Cited by 6
Swenson, K. A., Alberti, L., Teele, K., Yadav, A., Shah, S. J., & Konopka, J. B. (2025) · Microbiology and Molecular Biology Reviews · doi:10.1128/mmbr.00229-24 · Cited by 7
Bian, Z., Xu, Z. Z., Peer, A., Choi, Y., Priest, S. J., Akritidou, K., Dasgupta, A., Dahlmann, T. A., Kück, U., Nowrousian, M., et al. (2025) · mBio · doi:10.1128/mbio.00223-25 · Cited by 5
From patterns to prediction: machine learning and antifungal resistance biomarker discovery
Thorn, V., & Xu, J. (2025) · Canadian Journal of Microbiology · doi:10.1139/cjm-2024-0248 · Cited by 6
PRACTICAL APPLICATIONS OF MACHINE LEARNING FOR ANTI-INFECTIVE DRUG DISCOVERY
Sarkar, N., & Stokes, J. M. (2023) · Medicinal chemistry reviews · doi:10.1021/mc-2023-vol58.ch14 · Cited by 5
Pseudouridine synthase 7 impacts Candida albicans rRNA processing and morphological plasticity
Pickerill, E. S., Kurtz, R. P., Tharp, A., Sanz, P. G., Begum, M., & Bernstein, D. A. (2019) · Yeast · doi:10.1002/yea.3436 · Cited by 6
Jaitly, P., Legrand, M., Das, A., Patel, T., Chauvel, M., Maufrais, C., d’Enfert, C., & Sanyal, K. (2022) · Nature Communications · doi:10.1038/s41467-022-31980-3 · Cited by 6
Pooled CRISPRi screening reveals fungal-specific drug target candidates
Wensing, L. F., Després, P. C., Francis, D., Fogal, M., Hendriks, A., Gervais, N. C., Fikry, C., Bukari, A.-R. A., Gerstein, A. C., Cuomo, C. A., et al. (2026) · Nature Microbiology · doi:10.1038/s41564-026-02356-w · Cited by 5
Metadata
- Authors
- Segal, E. S., Gritsenko, V., Levitan, A., Yadav, B., Dror, N., Steenwyk, J. L., Silberberg, Y., Mielich, K., Rokas, A., Gow, N. A. R., Kunze, R., Sharan, R., & Berman, J.
- Affiliations
- Tel Aviv University (IL)
- University of Aberdeen (GB)
- Vanderbilt University (US)
- Freie Universität Berlin (DE)
- Corresponding author
- Berman, Judith
- ORCID
- Venue
- mBio
- Publisher
- American Society for Microbiology
- Published
- 2018-11-07
- Volume
- 9
- Issue
- 5
- ISSN
- 2150-7511 (ISSN-L)
- 2161-2129
- PMC
- PMC6212825
- OpenAlex
- W2898801056
- Cited by
- 150
- References
- 105
- Citations by year
- 2026: 11 · 2025: 20 · 2024: 18 · 2023: 9 · 2022: 21 · 2021: 20 · 2020: 26 · 2019: 24 · 2018: 1
- FWCI
- 6.31
- Type
- journal article
- Language
- en
- Open access
- gold
- doi.org
- Licence
- Locations
- mBio (publishedVersion, cc-by)
- Europe PMC (PubMed Central) (publishedVersion, cc-by)
- PubMed Central (publishedVersion, cc-by)
- PubMed (publishedVersion)
- Aberdeen University Research Archive (Aberdeen University) (submittedVersion)
- DOAJ (DOAJ: Directory of Open Access Journals) (submittedVersion, cc-by-sa)
- DOAJ (DOAJ: Directory of Open Access Journals) (submittedVersion)
- Refubium (Universitätsbibliothek der Freien Universität Berlin) (submittedVersion, cc-by)
- Universitätsbibliothek der FU Berlin Hochschulschriftenstelle u. Dokumentenserver (cc-by)
- Funders
- Wellcome Trust (086827 075470 101873 200208)
- MRC Center for Medical Mycology (N006364/1)
- European Research Council (340087 RAPLODAPT)
- Dahlem Center of Plant Sciences (DCPS)
- Israel Science Foundation (715/18)
- Topics
- Life Sciences › Biochemistry, Genetics and Molecular Biology › Molecular Biology › Fungal and yeast genetics research
- Health Sciences › Medicine › Infectious Diseases › Antifungal resistance and susceptibility
- Life Sciences › Biochemistry, Genetics and Molecular Biology › Genetics › Bacterial Genetics and Biotechnology
- Keywords
- gene essentiality, Candida albicans, transposon mutagenesis, essential genes, fungal pathogens, antifungal drug targets, machine learning, deep sequencing
- MeSH terms
- Machine Learning, Aspergillus fumigatus, Candida albicans, Cryptococcus neoformans, DNA Transposable Elements, Genes, Fungal, Genetics, Microbial, Haploidy, Histoplasma, Mutagenesis, Insertional, Genes, Essential
About these checks
Registry, retraction, Cites and statistics results are computed, not judged, with one exception: a printed reference that no index lists is read once by a model before it counts as a citation error. Claims are extracted by a model and kept only when their quote appears verbatim in the text; each cited source is then checked, with a model’s help, for whether it says what the claim relies on. Those verdicts can be wrong — read the claim’s quote and the cited source before relying on one.
Statistics and arithmetic are recomputed, not judged.
Confidence bands are shown only for fields calibrated on our annotated test set. None is calibrated yet, so no band is shown.
What counts as a claim ›How we measure confidence ›How we check this ›
Are you an author, or do you see a problem with this page? Request a review
