

The DOI matches its Crossref record; 65 of the 65 references it cites were found in a registry or an index.
Evaluation of clinical prediction models (part 1): from development to external validation
Open accessAbstract
Evaluating the performance of a clinical prediction model is crucial to establish its predictive accuracy in the populations and settings intended for use. In this article, the first in a three part series, Collins and colleagues describe the importance of a meaningful evaluation using internal, internal-external, and external validation, as well as exploring heterogeneity, fairness, and generalisability in model performance.
Overview
The claims and statistics of this paper haven’t been checked yet.
Run the check — free, no account needed. It reads the open-access text and checks the sources it cites.
Integrity signals
Registry
Cites
Statistics
Figures
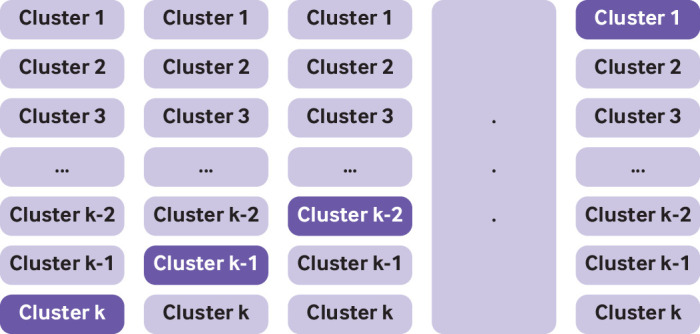
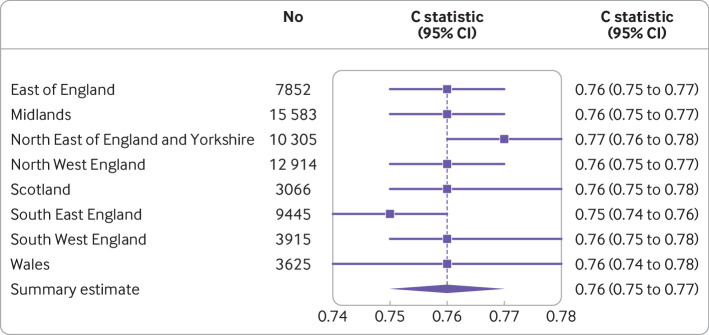
Verification
Claims the paper makes
The claims and statistics of this paper haven’t been checked yet.
Run the check — free, no account needed. It reads the open-access text and checks the sources it cites.
Claims other papers make about this one
Each is checked against this paper’s own text: does it say what the citing paper says it does?
The source backs part of the claim, not all of it — or backs it for a different population, condition or comparison.
In the citing paper
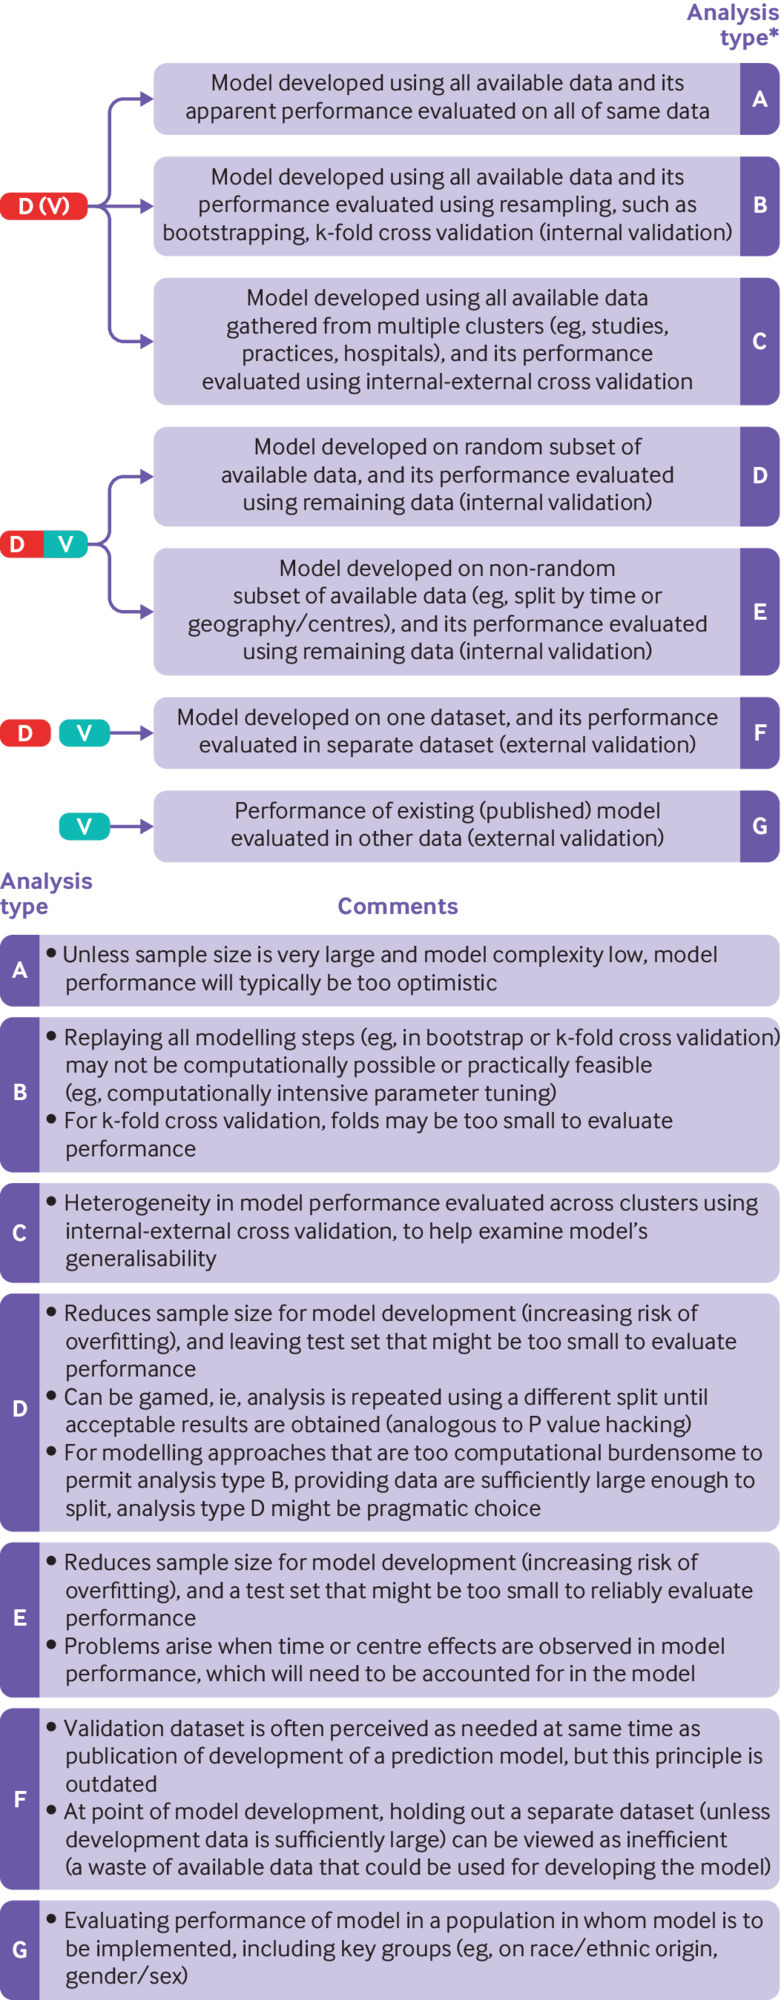
“To ensure validation, the dataset was split into training and testing subsets using a 70/30 ratio, with 70% of the data reserved for model development and 30% held out for independent performance assessment”
From A hybrid fuzzy logic–Random Forest model to predict psychiatric treatment order outcomes: an interpretable tool for legal decision support (2025) · cites this paper as Collins et al., 2024
Experimental — accuracy not yet measuredIn the citing paper
“Further, it might encourage researchers to repeat the procedure until they obtain satisfactory results.”
From Developing clinical prediction models: a step-by-step guide (2024) · cites this paper as [88]
In the citing paper
“However, implementation of k-fold cross validation and bootstrapping can be computationally demanding when multiple imputation of missing data is needed.”
From Developing clinical prediction models: a step-by-step guide (2024) · cites this paper as [88]
Self-check
Percentages, sums and reported differences re-computed from the paper’s own numbers.
The self-check needs the paper’s full text.
Citations
Cites
Harrell (2015) · Springer Series in Statistics · doi:10.1007/978-3-319-19425-7 · Cited by 6,878
Self-citationMoons, K. G. M., Altman, D. G., Reitsma, J. B., Ioannidis, J. P. A., Macaskill, P., Steyerberg, E. W., Vickers, A. J., Ransohoff, D. F., & Collins, G. S. (2015) · Annals of Internal Medicine · doi:10.7326/m14-0698 · Cited by 5,147
Self-citationCollins, G. S., Reitsma, J. B., Altman, D. G., & Moons, K. G. M. (2015) · BMJ · doi:10.1136/bmj.g7594 · Cited by 4,388
Self-citationCollins, P. G. S., Reitsma, J. B., Altman, D. G., & Moons, K. G. M. (2015) · British Journal of Cancer · doi:10.1038/bjc.2014.639 · Cited by 3,319
Self-citationClinical Prediction Models: A Practical Approach to Development, Validation, and Updating
Steyerberg, E. W. (2019) · Statistics for Biology and Health · doi:10.1007/978-3-030-16399-0 · Cited by 3,281
Wynants, L., Van Calster, B., Bonten, M. M., Collins, G. S., Debray, T. P., De Vos, M., Haller, M. C., Heinze, G., Moons, K. G., Riley, R. D., et al. (2020) · doi:10.1101/2020.03.24.20041020 · Cited by 3,070
Self-citationCalculating the sample size required for developing a clinical prediction model
Riley, R. D., Ensor, J., Snell, K. I. E., Harrell, F. E., Martin, G. P., Reitsma, J. B., Moons, K. G. M., Collins, G., & van Smeden, M. (2020) · BMJ · doi:10.1136/bmj.m441 · Cited by 2,917
Self-citationInternal validation of predictive models
Steyerberg, E. W., Harrell, F. E., Borsboom, G. J. J. M., Eijkemans, M. J. C., Vergouwe, Y., & Habbema, J. D. F. (2001) · Journal of Clinical Epidemiology · doi:10.1016/s0895-4356(01)00341-9 · Cited by 2,746
Self-citationChristodoulou, E., Ma, J., Collins, G. S., Steyerberg, E. W., Verbakel, J. Y., & Van Calster, B. (2019) · Journal of Clinical Epidemiology · doi:10.1016/j.jclinepi.2019.02.004 · Cited by 2,119
Self-citation
Research works printed but not linked: 2
- 10.1136/bmj.m1328 · DOI · Paper page
- 10.1177/962280218784726 · DOI
Cited by
Sorted by citations
Collins, G. S., Moons, K. G. M., Dhiman, P., Riley, R. D., Beam, A. L., Van Calster, B., Ghassemi, M., Liu, X., Reitsma, J. B., van Smeden, M., et al. (2024) · BMJ · doi:10.1136/bmj-2023-078378 · Cited by 4,718
Self-citationMoons, K. G. M., Damen, J. A. A., Kaul, T., Hooft, L., Andaur Navarro, C., Dhiman, P., Beam, A. L., Van Calster, B., Celi, L. A., Denaxas, S., et al. (2025) · BMJ · doi:10.1136/bmj-2024-082505 · Cited by 1,069
Self-citationDeveloping clinical prediction models: a step-by-step guide
Efthimiou, O., Seo, M., Chalkou, K., Debray, T., Egger, M., & Salanti, G. (2024) · BMJ · doi:10.1136/bmj-2023-078276 · Cited by 544
Evaluation of clinical prediction models (part 2): how to undertake an external validation study
Riley, R. D., Archer, L., Snell, K. I. E., Ensor, J., Dhiman, P., Martin, G. P., Bonnett, L. J., & Collins, P. G. S. (2024) · BMJ · doi:10.1136/bmj-2023-074820 · Cited by 565
Self-citationRiley, R. D., Snell, K. I. E., Archer, L., Ensor, J., Debray, T. P. A., CALSTER, B. V., van Smeden, M., & Collins, P. G. S. (2024) · BMJ · doi:10.1136/bmj-2023-074821 · Cited by 213
Self-citationVan Calster, B., Collins, G. S., Vickers, A. J., Wynants, L., Kerr, K. F., Barreñada, L., Varoquaux, G., Singh, K., Moons, K. G., Hernandez-Boussard, T., et al. (2025) · The Lancet Digital Health · doi:10.1016/j.landig.2025.100916 · Cited by 112
Self-citationGragnano, F., Klaveren, D. V., Heg, D., Räber, L., Krucoff, M. W., Raposeiras‐Roubín, S., ten Berg, J. M., Leonardi, S., Kimura, T., Corpataux, N., et al. (2024) · Circulation · doi:10.1161/circulationaha.124.072009 · Cited by 97
Importance of sample size on the quality and utility of AI-based prediction models for healthcare
Riley, R. D., Ensor, J., Snell, K. I. E., Archer, L., Whittle, R., Dhiman, P., Alderman, J. E., Liu, X., Kirton, L., Manson-Whitton, J., et al. (2025) · The Lancet Digital Health · doi:10.1016/j.landig.2025.01.013 · Cited by 93
Self-citationLópez‐Ayala, P., Riley, R. D., Collins, P. G. S., & Zimmermann, T. (2025) · BMJ · doi:10.1136/bmj-2024-082440 · Cited by 99
Self-citationvan Daalen, K. R., Zhang, D., Kaptoge, S. K., Paige, E., Angelantonio, E. D., & Pennells, L. A. M. (2024) · The Lancet Global Health · doi:10.1016/s2214-109x(24)00210-9 · Cited by 76
Ma, D., Dai, L.-J., Wu, X., Liu, C., Zhao, S., Zhang, H., Chen, L., Xiao, Y., Li, M., Zhao, Y.-Z., et al. (2025) · Cancer Cell · doi:10.1016/j.ccell.2025.03.017 · Cited by 66
External validation of AI-based scoring systems in the ICU: a systematic review and meta-analysis
Rockenschaub, P., Akay, E. M., Carlisle, B. G., Hilbert, A., Wendland, J., Meyer-Eschenbach, F., Näher, A.-F., Frey, D., & Madai, V. I. (2025) · BMC Medical Informatics and Decision Making · doi:10.1186/s12911-024-02830-7 · Cited by 58
Uncertainty of risk estimates from clinical prediction models: rationale, challenges, and approaches
Riley, R. D., Collins, P. G. S., Kirton, L., Snell, K. I. E., Ensor, J., Whittle, R., Dhiman, P., van Smeden, M., Liu, X., Alderman, J. E., et al. (2025) · BMJ · doi:10.1136/bmj-2024-080749 · Cited by 67
Self-citationFrenking, J. H., Zhou, X., Wagner, V., Hielscher, T., Kauer, J., Mai, E. K., Friedrich, M., Michel, C. S., Hajiyianni, M., Breitkreutz, I., et al. (2024) · Journal for ImmunoTherapy of Cancer · doi:10.1136/jitc-2024-009220 · Cited by 49
Artificial Intelligence in Dentistry: A Concise Review of Reporting Checklists and Guidelines
Khurshid, Z., Osathanon, T., Shire, M. A., Schwendicke, F., & Samaranayake, L. P. (2025) · International Dental Journal · doi:10.1016/j.identj.2025.109322 · Cited by 53
Piccininni, M., Wechsung, M., van Calster, B., Rohmann, J., Konigorski, S., & van Smeden, M. (2024) · Journal of Biomedical Informatics · doi:10.1016/j.jbi.2024.104666 · Cited by 42
Davis, S. E., Dorn, C., Park, D. J., & Matheny, M. E. (2025) · Journal of the American Medical Informatics Association · doi:10.1093/jamia/ocaf039 · Cited by 43
Sundar, S. S., Agarwal, R., Davenport, C. F., Scandrett, K., Johnson, S., Sengupta, P. P., Vikram, R., Kwong, F. L., Mallett, S., Rick, C., et al. (2024) · The Lancet Oncology · doi:10.1016/s1470-2045(24)00406-6 · Cited by 41
Best, K., Shuweihdi, F., Bazo‐Alvarez, J. C., Relton, S. D., Avgerinou, C., Nimmons, D., Petersen, I., Pujades‐Rodríguez, M., Conroy, S., Walters, K. R., et al. (2025) · Age and Ageing · doi:10.1093/ageing/afaf077 · Cited by 42
Spies, N. C., Farnsworth, C. W., Wheeler, S., & McCudden, C. R. (2024) · Clinical Chemistry · doi:10.1093/clinchem/hvae126 · Cited by 40
Williams, M. C., Weir-McCall, J. R., Baldassarre, L. A., Cecco, C. N. D., Choi, A. D., Dey, D., Dweck, M. R., Išgum, I., Kolossváry, M., Leipsic, J. A., et al. (2024) · Journal of cardiovascular computed tomography · doi:10.1016/j.jcct.2024.08.003 · Cited by 38
Rosen, A. W., Ose, I., Gögenur, M., Andersen, L. P. K., Bojesen, R. D., Vogelsang, R. P., Rose, M. H., Steenfos, P. W., Hansen, L. B., Spuur, H. S., et al. (2025) · Nature Medicine · doi:10.1038/s41591-025-03942-x · Cited by 37
Hanassab, S., Nelson, S. M., Akbarov, A., Yeung, A. C., Hramyka, A., Alhamwi, T., Salim, R., Comninos, A. N., Trew, G. H., Kelsey, T., et al. (2025) · Nature Communications · doi:10.1038/s41467-024-55301-y · Cited by 35
Predicting Diagnostic Progression to Schizophrenia or Bipolar Disorder via Machine Learning
Hansen, L., Bernstorff, M., Enevoldsen, K., Kolding, S., Damgaard, J. G., Perfalk, E., Nielbo, K. L., Danielsen, A. A., & Østergaard, S. D. (2025) · JAMA Psychiatry · doi:10.1001/jamapsychiatry.2024.4702 · Cited by 34
Wang, J., Wang, Y., Duan, S., Xu, L., Xu, Y., Yin, W., Yang, Y., Wu, B., & Liu, J. (2024) · Journal of the American Heart Association · doi:10.1161/jaha.124.036970 · Cited by 34
Kwong, J. C. C., Wu, J., Malik, S., Khondker, A., Gupta, N. K., Bodnariuc, N., Narayana, K., Malik, M., van der Kwast, T., Johnson, A. E. W., et al. (2024) · npj Digital Medicine · doi:10.1038/s41746-024-01088-7 · Cited by 40
Predicting daily recovery during long-term endurance training using machine learning analysis
Rothschild, J. A., Stewart, T. I., Kilding, A. E., & Plews, D. J. (2024) · European Journal of Applied Physiology · doi:10.1007/s00421-024-05530-2 · Cited by 34
Zhong, J., Liu, X., Lu, J. A., Yang, J., Zhang, G., Mao, S., Chen, H., Yin, Q., Cen, Q., Jiang, R., et al. (2025) · European Radiology · doi:10.1007/s00330-024-11331-0 · Cited by 29
Clinical prediction models using machine learning in oncology: challenges and recommendations
Collins, G. S., Chester-Jones, M., Gerry, S., Ma, J., Matos, J., Sehjal, J., Tsegaye, B., & Dhiman, P. (2025) · BMJ Oncology · doi:10.1136/bmjonc-2025-000914 · Cited by 27
Self-citationNew horizons in prediction modelling using machine learning in older people’s healthcare research
Stahl, D. R. (2024) · Age and Ageing · doi:10.1093/ageing/afae201 · Cited by 31
Ciccarone, F., Biscione, A., Robba, E., Pasciuto, T., Giannarelli, D., Gui, B., Manfredi, R. M., Ferrandina, G., Romualdi, D., Moro, F., et al. (2024) · American Journal of Obstetrics and Gynecology · doi:10.1016/j.ajog.2024.07.027 · Cited by 26
Tiruneh, S. A., Rolnik, D. L., Teede, H. J., & Enticott, J. (2024) · International Journal of Medical Informatics · doi:10.1016/j.ijmedinf.2024.105645 · Cited by 31
Twelve practical recommendations for developing and applying clinical predictive models
Feng, G., Xu, H., Wan, S., Wang, H., Chen, X., Magari, R. T., Han, Y. K., Wei, Y., & Gu, H. (2024) · The Innovation Medicine · doi:10.59717/j.xinn-med.2024.100105 · Cited by 27
Wang, Z., Wang, W., Sun, C., Li, J., Xie, S., Xu, J., Zou, K., Jin, Y., Yan, S., Liao, X., et al. (2025) · npj Digital Medicine · doi:10.1038/s41746-025-01587-1 · Cited by 31
Hartmann, S., Dwyer, D., Cavve, B. S., Byrne, E. M., Scott, I., Gao, C. X., Wannan, C., Yuen, H. P., Hartmann, J., Lin, A. P., et al. (2024) · World Psychiatry · doi:10.1002/wps.21240 · Cited by 29
Zhang, C., Yan, R., Liu, X., Nie, X., Peng, Y., & Peng, X. (2025) · Journal of Clinical Epidemiology · doi:10.1016/j.jclinepi.2025.112101 · Cited by 23
Martin, G. P., Riley, R. D., Ensor, J., & Grant, S. W. (2025) · European Journal of Cardio-Thoracic Surgery · doi:10.1093/ejcts/ezaf142 · Cited by 25
Self-citationRong, K., ran, G. L. J. Y. K., Zhou, C., & Yi, X. (2025) · European journal of medical research · doi:10.1186/s40001-025-02606-3 · Cited by 22
Sorror, M. L., Saber, W., Logan, B. R., Geller, N. L., Bellach, A., Kou, J., Wood, W. A., McCarty, J. M., Knight, T. G., Runaas, L., et al. (2025) · Blood Advances · doi:10.1182/bloodadvances.2025015793 · Cited by 21
Al-Ewaidat, O. A., & Naffaa, M. M. (2025) · Rheumato · doi:10.3390/rheumato5040017 · Cited by 24
Blythe, R. D., Parsons, R., Barnett, A. G., Cook, D., McPhail, S., & White, N. M. (2024) · Critical Care · doi:10.1186/s13054-024-05021-y · Cited by 25
Application of machine learning in dentistry: insights, prospects and challenges
Wang, L., Xu, Y., Wang, W., & Lu, Y. (2025) · Acta Odontologica Scandinavica · doi:10.2340/aos.v84.43345 · Cited by 21
The Role of Artificial Intelligence in Chronic Liver Diseases and Liver Transplantation
Spann, A., Strauss, A. T., Davis, S. E., & Bhat, M. (2025) · Gastroenterology · doi:10.1053/j.gastro.2025.05.012 · Cited by 21
Călburean, P., Lupu, S., Huţanu, A., Oprica, M., Opriș, D. R., Stan, A., Scurtu, A.-C., Aniței, D. E., Harpa, M. M., Brînzaniuc, K., et al. (2024) · Scientific Reports · doi:10.1038/s41598-024-73349-0 · Cited by 18
Differences in technical and clinical perspectives on AI validation in cancer imaging: mind the gap!
Chouvarda, I., Colantonio, S., Verde, A. S. C., Jiménez-Pastor, A., Cerdá-Alberich, L., Metz, Y., Zacharias, L., Nabhani‐Gebara, S., Bobowicz, M., Tsakou, G., et al. (2025) · European Radiology Experimental · doi:10.1186/s41747-024-00543-0 · Cited by 18
Angelantonio, E. D., Pennells, L. A. M., Abdelhamid, M., Aboyans, V., Asteggiano, R., Čelutkienė, J., Grobbee, D. E., Iung, B., Jüni, P., McEvoy, J. W., et al. (2025) · European Heart Journal · doi:10.1093/eurheartj/ehaf016 · Cited by 21
Wang, Y., Cheungpasitporn, W., Ali, H., Qing, J., Thongprayoon, C., Kaewput, W., Soliman, K., Huang, Z., Yang, M., & Zhang, Z. (2025) · Renal Failure · doi:10.1080/0886022x.2025.2513002 · Cited by 18
Tiruneh, S. A., Rolnik, D. L., Teede, H. J., & Enticott, J. (2025) · Computers in Biology and Medicine · doi:10.1016/j.compbiomed.2025.110183 · Cited by 21
Watanabe, K., Fukuda, S., Kubota, D., Yamamichi, N., Takahashi, Y., Watanabe, Y., Adachi, K., Ishimura, N., Koike, T., Sugawara, H., et al. (2026) · Journal of Gastroenterology and Hepatology · doi:10.1111/jgh.70409 · Cited by 17
Challenges in predictive modelling of chronic kidney disease: A narrative review
Khandpur, S., Mishra, P., Mishra, S., & Tiwari, S. (2024) · World Journal of Nephrology · doi:10.5527/wjn.v13.i3.97214 · Cited by 17
Gallardo‐Pizarro, A., Teijón‐Lumbreras, C., Monzó, P., Aiello, T. F., Chumbita, M., Peyrony, O., Gras, E., Pitart, C., Mensa, J., Esteve, J., et al. (2024) · Antibiotics · doi:10.3390/antibiotics14010013 · Cited by 16
The validation of prediction models deserves more recognition
Mansmann, U., & Ön, B. I. (2025) · BMC Medicine · doi:10.1186/s12916-025-03994-3 · Cited by 16
Khan, S. S., Lloyd-Jones, D. M., Abdalla, M., Bello, N. A., Blyler, C. A., Carter, J., Commodore-Mensah, Y., Ferdinand, K. C., Johnson, H. M., Jones, D., et al. (2025) · JACC · doi:10.1016/j.jacc.2025.08.001 · Cited by 16
The anesthesiologist’s guide to critically assessing machine learning research: a narrative review
Osorio, F. O., Alzate‐Ricaurte, S., Vallecilla, T. E. M., & Cruz, G. (2024) · BMC Anesthesiology · doi:10.1186/s12871-024-02840-y · Cited by 16
Predicting antidepressant response via local-global graph neural network and neuroimaging biomarkers
Liu, R., Hou, X., Liu, S., Zhou, Y., Zhou, J., Qiao, K., Qi, H., Li, R., Yang, Z., Zhang, L., et al. (2025) · npj Digital Medicine · doi:10.1038/s41746-025-01912-8 · Cited by 14
Competing and Noncompeting Risk Models for Predicting Kidney Allograft Failure
Truchot, A., Raynaud, M., Helanterä, I., Aubert, O., Kamar, N., Divard, G., Astor, B. C., Legendre, C. M., Hertig, A., Büchler, M., et al. (2024) · Journal of the American Society of Nephrology · doi:10.1681/asn.0000000517 · Cited by 14
Post-Cardiac arrest outcome prediction using machine learning: A systematic review and meta-analysis
Zobeiri, A., Rezaee, A., Hajati, F., Argha, A., & Alinejad‐Rokny, H. (2024) · International Journal of Medical Informatics · doi:10.1016/j.ijmedinf.2024.105659 · Cited by 16
Precision psychiatry: thinking beyond simple prediction models – enhancing causal predictions
Krishnadas, R., Leighton, S., & Jones, P. B. (2025) · The British Journal of Psychiatry · doi:10.1192/bjp.2024.258 · Cited by 14
Novel machine learning applications in peripartum care: a scoping review
Steinberg, S., Wong, M., Zimlichman, E., & Tsur, A. (2025) · American Journal of Obstetrics & Gynecology MFM · doi:10.1016/j.ajogmf.2025.101612 · Cited by 17
Detection of Kidney Allograft Rejection Using Urinary Chemokines
Goutaudier, V., Aubert, O., Racapé, M., Truchot, A., Sablik, M., Raynaud, M., Vicaut, É., Rousseau, O., Elias, M., Divard, G., et al. (2025) · Journal of the American Society of Nephrology · doi:10.1681/asn.0000000742 · Cited by 13
Khan, S. S., Abdalla, M., Bello, N. A., Blyler, C. A., Carter, J., Commodore-Mensah, Y. Y., Ferdinand, K. C., Johnson, H. M., Jones, D. W., Khera, A., et al. (2025) · Hypertension · doi:10.1161/hyp.0000000000000248 · Cited by 16
Cipolletta, E., Nakafero, G., Rozza, D., Mahil, S. K., Smith, C. H., Riley, R. D., & Abhishek, A. (2025) · The Lancet Rheumatology · doi:10.1016/s2665-9913(25)00165-1 · Cited by 13
Self-citationKirchgesner, J., Verstockt, B., Adamina, M., Allin, K. H., Allocca, M., Bourgonje, A. R., Burisch, J. M., Doherty, G. A., Dulai, P. S., El‐Hussuna, A., et al. (2025) · Journal of Crohn s and Colitis · doi:10.1093/ecco-jcc/jjaf073 · Cited by 13
Rothschild, J. A., Hofmeyr, S., McLaren, S. J., & Maunder, E. (2024) · Sports Medicine · doi:10.1007/s40279-024-02131-z · Cited by 13
Yabuuchi, Y., Masui, Y., Kumagai, K., Iwagami, H., Murai, K., Setoyama, T., Tochio, T., Utsumi, T., Yoshikawa, T., Araki, O., et al. (2025) · Journal of Gastroenterology · doi:10.1007/s00535-025-02261-9 · Cited by 12
Dyer, B. P. (2025) · European Heart Journal Open · doi:10.1093/ehjopen/oeaf070 · Cited by 12
Assessing methodological quality
Greenhalgh, T., & Dijkstra, P. (2024) · doi:10.1002/9781394206933.ch4 · Cited by 12
External Validation of AI Models for Skin Diseases: A Systematic Review
Fernandes, T. R. S., Teles, A. S., Fernandes, J. R. N., Lima, L. D. B., Sousa, D. L., Soares, R. D. C., & Teixeira, S. S. (2025) · IEEE Access · doi:10.1109/access.2025.3584904 · Cited by 12
Post-stroke depression risk prediction models in stroke patients: A systematic review
Zeng, X., & Chen, X. J. (2025) · General Hospital Psychiatry · doi:10.1016/j.genhosppsych.2025.07.003 · Cited by 14
Convergence of machine learning and genomics for precision oncology
Reardon, B. M., Culhane, A. C., & Allen, E. M. V. (2026) · Nature reviews. Cancer · doi:10.1038/s41568-025-00897-6 · Cited by 14
Chen, L., Ashton-James, C. E., Shi, B., Radojčić, M. R., Anderson, D., Chen, Y., Preen, D. B., Hopper, J. L., Li, S., Bui, M., et al. (2024) · BMC Medicine · doi:10.1186/s12916-024-03388-x · Cited by 11
Early Treatment Response to Mepolizumab Predicts Clinical Remission in Severe Eosinophilic Asthma
Hamada, Y., Gibson, P. G., Harvey, E. S., Stevens, S. G., Lewthwaite, H., Fricker, M., McDonald, V. M., Gillman, A., Hew, M. J., Kritikos, V. S., et al. (2024) · The Journal of Allergy and Clinical Immunology In Practice · doi:10.1016/j.jaip.2024.10.041 · Cited by 10
Räty, P., Bonsdorff, A., Parviainen, H., Lantto, E., Hackenberg, T., Lampela, H., Nykänen, T., Lyytinen, I., Mentula, P. J., & Sallinen, V. J. (2025) · British journal of surgery · doi:10.1093/bjs/znaf025 · Cited by 10
CALSTER, B. V., van Smeden, M., van Amsterdam, W. A. C., Coemans, M., Wynants, L., & Steyerberg, E. W. (2025) · Annual Review of Statistics and Its Application · doi:10.1146/annurev-statistics-042324-123749 · Cited by 14
The urgency of centering safety-net organizations in AI governance
Nong, P., Maurer, E. W., & Dwivedi, R. (2025) · npj Digital Medicine · doi:10.1038/s41746-025-01479-4 · Cited by 11
Assessing the Adequacy of a Prediction Model
Indrayan, A., & Mishra, S. (2025) · Indian Journal of Community Medicine · doi:10.4103/ijcm.ijcm_567_24 · Cited by 9
Rothschild, J. A., Gallo, G., Hamilton, K., Stevenson, J. D., Dudley-Rode, H., Charoensap, T., Plews, D. J., Kilding, A. E., & Maunder, E. (2025) · European Journal of Applied Physiology · doi:10.1007/s00421-025-05815-0 · Cited by 11
Köhl, V., Wünsch, V. A., Dohrmann, T., Krause, L., & Petzoldt, M. (2025) · Anaesthesia · doi:10.1111/anae.16678 · Cited by 9
Internal Validation of a Machine Learning-Based CDSS for Antimicrobial Stewardship
Frenkel, A., Rendon, A., Chavez-Lencinas, C., de la Torre, J. C. G., MacDermott, J., Gross, C., Allman, S., Lundblad, S., Zavala, I., Gross, D., et al. (2025) · Life · doi:10.3390/life15071123 · Cited by 9
Khan, S. S., Abdalla, M., Bello, N. A., Blyler, C. A., Carter, J., Commodore-Mensah, Y. Y., Ferdinand, K. C., Johnson, H. M., Jones, D. W., Khera, A., et al. (2025) · Circulation · doi:10.1161/cir.0000000000001355 · Cited by 13
A Risk Prediction Tool for Invasive Melanoma
Whiteman, D. C., Olsen, C. M., Wang, H., Law, M. H., Neale, R. Ε., & Pandeya, N. (2025) · JAMA Dermatology · doi:10.1001/jamadermatol.2025.3028 · Cited by 9
Machine learning in oncological pharmacogenomics: advancing personalized chemotherapy
Avcı, Ç. B., Bağca, B. G., Shademan, B., Takanlou, L. S., Takanlou, M. S., & Nourazarian, A. (2024) · Functional & Integrative Genomics · doi:10.1007/s10142-024-01462-4 · Cited by 12
Estimating Calibrated Risks Using Focal Loss and Gradient-Boosted Trees for Clinical Risk Prediction
Johnston, H., Nair, N., & Du, D. (2025) · Electronics · doi:10.3390/electronics14091838 · Cited by 8
Melink, K. F., Stanski, N. L., Gorrell, E., Alten, J. A., Pettit, K. A., Goldstein, S. L., Zang, H., Ollberding, N. J., Basu, R. K., Menon, S., et al. (2025) · Journal of the American Heart Association · doi:10.1161/jaha.125.042941 · Cited by 8
Sakamoto, T., Endo, H., Yamamoto, H., Akiyoshi, T., Shirabe, K., Ueno, H., Hasegawa, H., Naitoh, T., & Fukunaga, Y. (2025) · Medicine · doi:10.1097/md.0000000000043977 · Cited by 8
Hassoon, A., Lin, C. F., Woo, H., Irimia, R. M., Marsteller, J. A., Li, A., Banderia, A., Leo, H., Peng, X., Rastall, D. P. W., et al. (2025) · Annals of Epidemiology · doi:10.1016/j.annepidem.2025.11.004 · Cited by 8
Arribas, M., Micheli, A. D., Krakowski, K., Stahl, D. R., Correll, C. U., Young, A. H., Andreassen, O. A., Vieta, E., Arango, C., McGuire, P. K., et al. (2025) · The Lancet Psychiatry · doi:10.1016/s2215-0366(25)00307-4 · Cited by 8
Germaine, M., O'Higgins, A. C., Egan, B., & Healy, G. F. (2025) · BMJ Digital Health & AI · doi:10.1136/bmjdhai-2025-000089 · Cited by 9
Karlsen, A. P. H., Sunde, P. B., Olsen, M. H., Laigaard, J., Folkersen, C., Tran, T. X. M., Rasmussen, I., Kjartansdóttir, S. P., Saito, A., Andersen, M. A., et al. (2024) · Acta Anaesthesiologica Scandinavica · doi:10.1111/aas.14508 · Cited by 8
Brain structure in schizophrenia: what do we know and what next?
Lawrie, S. M. (2025) · The Lancet Psychiatry · doi:10.1016/s2215-0366(25)00172-5 · Cited by 7
Hancox, Z., Pang, A., Conaghan, P. G., Kingsbury, S. R., Clegg, A. P., & Relton, S. D. (2024) · Artificial Intelligence in Medicine · doi:10.1016/j.artmed.2024.102999 · Cited by 8
The Search for Sepsis Biomarkers: A Tale of Promises, Pitfalls, and Potential
Zimmermann, T., Brealey, D. A., & Singer, M. (2024) · Critical Care Medicine · doi:10.1097/ccm.0000000000006560 · Cited by 7
Chan, J. K. N., Solmi, M., Correll, C. U., Wong, C. S. M., Lo, H. K. Y., Lai, F. T. T., & Chang, W. C. (2025) · European Neuropsychopharmacology · doi:10.1016/j.euroneuro.2025.03.008 · Cited by 7
Diciolla, N. S., Ampuero-López, A., Marques, A. S. P. D. D., Jiménez-Martín, A., García-de-Villa, S., Torres-Lacomba, M., & Yuste-Sánchez, M. J. (2025) · Journal of Clinical Medicine · doi:10.3390/jcm14113641 · Cited by 7
Lung cancer risk assessment by prediction model: a global perspective
Zhang, L., Wang, X., Chen, Q., Zhao, M., Ju, C., Christiani, D. C., Chen, F., Zhang, R., & Wei, Y. (2025) · Thorax · doi:10.1136/thorax-2023-221253 · Cited by 7
Addressing Missingness in Predictive Models That Use Electronic Health Record Data
Lin, S., Groenwold, R. H. H., Mehta, H. B., Kim, J. S., & Segal, J. B. (2025) · Annals of Internal Medicine · doi:10.7326/annals-24-01516 · Cited by 7
Tasmurzayev, N., Baigarayeva, Z., Amangeldy, B., Иманбек, Б., Kurmanbek, S., Dikhanbayeva, G., & Amirkhanova, G. A. (2025) · Algorithms · doi:10.3390/a18110697 · Cited by 7
Recent highlights in low back pain research, Part I: Diagnosis and Prognosis
Pinto, R. Z., Kongsted, A., Silva, S., Hayden, J. A., Downie, A., & Saragiotto, B. T. (2025) · Journal of physiotherapy · doi:10.1016/j.jphys.2025.12.002 · Cited by 7
Chang, L., Li, H., Wu, W., Liu, X., Yan, J., Chen, Z., Wu, H., & Song, S. (2025) · Journal of Translational Medicine · doi:10.1186/s12967-025-07591-z · Cited by 10
Metadata
- Authors
- Collins, G. S., Dhiman, P., Ma, J., Schlussel, M. M., Archer, L., Van Calster, B., Harrell, F. E., Martin, G. P., Moons, K. G. M., van Smeden, M., Sperrin, M., Bullock, G. S., & Riley, R. D.
- Affiliations
- Centre for Statistics in Medicine, Nuffield Department of Orthopaedics, Rheumatology and Musculoskeletal Sciences, University of Oxford, Oxford OX3 7LD, UK
- University of Oxford (GB)
- National Institute for Health and Care Research (GB)
- KU Leuven, Department of Development and Regeneration, Leuven, Belgium
- Vanderbilt University (US)
- Manchester Academic Health Science Centre (GB)
- Utrecht University (NL)
- Julius Centre for Health Sciences and Primary Care, University Medical Centre Utrecht, Utrecht University, Utrecht, Netherlands
- ORCID
- Venue
- BMJ
- Publisher
- BMJ
- Published
- 2024-01-08
- Volume
- 384
- Pages
- e074819
- ISSN
- 1756-1833 (ISSN-L)
- PMC
- PMC10772854
- OpenAlex
- W4390674087
- Cited by
- 798
- References
- 65
- Citations by year
- 2026: 464 · 2025: 253 · 2024: 81
- FWCI
- 274.95
- Type
- journal article
- Language
- en
- Open access
- hybrid
- doi.org
- Locations
- BMJ (publishedVersion, cc-by)
- PubMed Central (publishedVersion, cc-by)
- PubMed (publishedVersion)
- University of Birmingham Research Portal (University of Birmingham) (publishedVersion, cc-by)
- Research Explorer (The University of Manchester) (publishedVersion, cc-by)
- Lirias (KU Leuven) (submittedVersion, cc-by)
- Utrecht University Repository (Utrecht University) (submittedVersion, other-oa)
- HighWire Press Open Archive (submittedVersion)
- Funders
- Cancer Research UK
- KU Leuven
- Engineering and Physical Sciences Research Council
- Topics
- Physical Sciences › Mathematics › Statistics and Probability › Statistical Methods in Epidemiology
- Health Sciences › Health Professions › Health Information Management › Artificial Intelligence in Healthcare
- Social Sciences › Decision Sciences › Statistics, Probability and Uncertainty › Meta-analysis and systematic reviews
- Keywords
- clinical prediction model, model evaluation, external validation, internal validation, prediction accuracy, model heterogeneity, fairness, generalizability
- MeSH terms
- Humans, Prognosis, Models, Statistical
About these checks
Registry, retraction, Cites and statistics results are computed, not judged, with one exception: a printed reference that no index lists is read once by a model before it counts as a citation error. Claims are extracted by a model and kept only when their quote appears verbatim in the text; each cited source is then checked, with a model’s help, for whether it says what the claim relies on. Those verdicts can be wrong — read the claim’s quote and the cited source before relying on one.
Statistics and arithmetic are recomputed, not judged.
Confidence bands are shown only for fields calibrated on our annotated test set. None is calibrated yet, so no band is shown.
What counts as a claim ›How we measure confidence ›How we check this ›
Are you an author, or do you see a problem with this page? Request a review
