

The DOI matches its Crossref record; 16 of the 16 references it cites were found in a registry or an index; none of the 13 sources its claims cite is checked for support yet.
The spectrum effect in tests for risk prediction, screening, and diagnosis
Open accessAbstract
The spectrum effect describes the variation between settings in performance of tests used to predict, screen for, and diagnose disease. In particular, the predictive use of a test may be different when it is applied in a general population rather than in the study sample in which it was first developed. This article discusses the impact of the spectrum effect on measures of test performance, and its implications for the development, evaluation, application, and implementation of such tests.
Overview
AI snapshot
Written from the paper’s full text.
TL;DR
The spectrum effect describes how test performance—sensitivity, specificity, and likelihood ratios—varies across populations because of differences in disease prevalence and the distribution of disease or risk. The paper argues that developers, evaluators, and policymakers should interpret test accuracy in the context of the population where it will be used.
Key findings
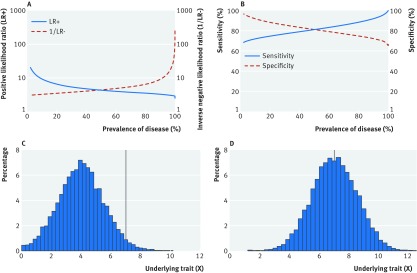
- In simulation scenario 1, as disease prevalence decreased, positive likelihood ratio, negative likelihood ratio, and specificity increased while sensitivity decreased, with 10-fold changes in likelihood ratios and about 30% variation in sensitivity and specificity.
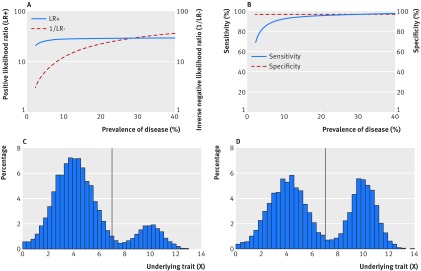
- In simulation scenario 2, changing the distribution of the underlying variable altered performance: at 20% disease prevalence, sensitivity and specificity were 85% and 95% in scenario 1 versus 98% and 99% in scenario 2.
- A review of 23 meta-analyses of diagnostic test accuracy found statistically significant associations between prevalence and sensitivity or specificity in one of three reviews, with specificity decreasing by 0.1% to 0.5% for every 1 percentage point increase in prevalence in pooled analysis.
- An example from Moons and colleagues showed the positive likelihood ratio for an exercise test for coronary artery disease was 3.8 in individuals with systolic blood pressure 141–240 mm Hg and 17.0 in those with systolic blood pressure 100–140 mm Hg.
Methods
- Narrative review and simulation study illustrating the spectrum effect, using a continuous variable X where true disease is defined as X ≥ 7 and an estimate Z is obtained by measurement or risk prediction.
- Scenario 1 varied disease prevalence by changing the mean of X while keeping the threshold constant; scenario 2 varied prevalence by altering the distribution of X using a bimodal distribution.
- The paper also draws on published literature and examples, including a review of 23 meta-analyses and a clinical example of exercise testing for coronary artery disease.
Limitations
- The paper does not state a formal limitations section.
- Evident from the text: the simulations are illustrative and depend on assumptions about the distribution of X, measurement or prediction error, and a threshold-based disease definition; the supplementary appendix containing simulation details is referenced but not included in the provided text.
- Evident from the text: several examples are hypothetical or drawn from selected literature rather than from a systematic empirical study of the spectrum effect.
Model-written summary. Check it against the paper before relying on it.
Integrity signals
Registry
Cites
Statistics
Figures
Verification
Claims the paper makes
14 Own interpretation · 9 Not checked yet · 9 No basis given
The paper states this without a source or data behind it here, so there is nothing to check it against. The quote shows it is in the paper.
In the paper
“When X has a distribution as shown in figure 2C, a greater proportion of people with the disease will have a value of X close to the threshold (and hence be at risk of test misclassification) than the corresponding proportion in a distribution as shown in figure 2D.”
§ The spectrum effect in tests for risk prediction, screening, and diagnosis > How does the spectrum effect influence tests? > Scenario 2
plaincorrelational- Asserted: passes — The authors put it forward as true.
- Checkable: passes — It can be checked against evidence.
- Load-bearing: passes — The paper’s conclusions depend on it.
- Based: passes — The paper gives a reason why it holds.
A conclusion the paper draws from its own results — it cites no other source for it, so there is none to check. The quote shows it is in the paper.
In the paper
“Change in prevalence is equivalent to performing a test in different health settings.”
§ The spectrum effect in tests for risk prediction, screening, and diagnosis > How does the spectrum effect influence tests? > Scenario 1
plaindirect- Asserted: passes — The authors put it forward as true.
- Checkable: passes — It can be checked against evidence.
- Load-bearing: passes — The paper’s conclusions depend on it.
- Based: passes — The paper gives a reason why it holds.
A conclusion the paper draws from its own results — it cites no other source for it, so there is none to check. The quote shows it is in the paper.
In the paper
“The consequence of this combination of error in the test result and the continuum of true disease status is that the probability of misclassification of disease status varies between individuals with individuals with true values of the underlying characteristics close to the cut-off point for diagnosis more likely to be misclassified than others.”
§ The spectrum effect in tests for risk prediction, screening, and diagnosis > What is the spectrum effect and why does it arise?
plaincorrelational- Asserted: passes — The authors put it forward as true.
- Checkable: passes — It can be checked against evidence.
- Load-bearing: passes — The paper’s conclusions depend on it.
- Based: passes — The paper gives a reason why it holds.
A conclusion the paper draws from its own results — it cites no other source for it, so there is none to check. The quote shows it is in the paper.
In the paper
“The implication of the spectrum effect is that the most commonly used measures of the performance of tests (sensitivity, specificity, and likelihood ratios) vary with the prevalence and distribution of disease in a population or sample.”
§ The spectrum effect in tests for risk prediction, screening, and diagnosis > What is the spectrum effect and why does it arise?
plaincorrelational- Asserted: passes — The authors put it forward as true.
- Checkable: passes — It can be checked against evidence.
- Load-bearing: passes — The paper’s conclusions depend on it.
- Based: passes — The paper gives a reason why it holds.
In the paper
“The same effect is seen when applying the test in subgroups known to be at higher risk (the referral filter3).”
§ The spectrum effect in tests for risk prediction, screening, and diagnosis > How does the spectrum effect influence tests? > Scenario 1
What the sources say
- Not checked yetcites [3] Leeflang MMG, Bossuyt PMM, Irwig L. Diagnostic test accuracy may vary with prevalence: implications for evidence-based diagnosis. J Clin Epidemiol 2009; 62: 5- 12. 10.1016/j.jclinepi.2008.04.007 pmid:18778913. 18778913
plaindirect- Asserted: passes — The authors put it forward as true.
- Checkable: passes — It can be checked against evidence.
- Load-bearing: passes — The paper’s conclusions depend on it.
- Based: passes — The paper gives a reason why it holds.
A conclusion the paper draws from its own results — it cites no other source for it, so there is none to check. The quote shows it is in the paper.
In the paper
“Only in situations with a truly dichotomous disease status or perfect test and an equal probability of diagnostic misclassification in individuals with and without the disease are these measures independent.”
§ The spectrum effect in tests for risk prediction, screening, and diagnosis > What is the spectrum effect and why does it arise?
plain- Asserted: passes — The authors put it forward as true.
- Checkable: passes — It can be checked against evidence.
- Load-bearing: passes — The paper’s conclusions depend on it.
- Based: passes — The paper gives a reason why it holds.
In the paper
“Many situations have a continuum of (measurable or unmeasurable) traits on which the classification of disease status is based, varying from clear absence to clear presence of the disease.7”
§ The spectrum effect in tests for risk prediction, screening, and diagnosis > What is the spectrum effect and why does it arise?
What the sources say
- Not checked yetcites [7] Altman DG, Bland JM. Diagnostic tests 3: receiver operating characteristic plots. BMJ 1994; 309: 188 10.1136/bmj.309.6948.188 pmid:8044101. 8044101 PMC2540706
plain- Asserted: passes — The authors put it forward as true.
- Checkable: passes — It can be checked against evidence.
- Load-bearing: passes — The paper’s conclusions depend on it.
- Based: passes — The paper gives a reason why it holds.
A conclusion the paper draws from its own results — it cites no other source for it, so there is none to check. The quote shows it is in the paper.
In the paper
“In particular, the predictive use of a test may be different when it is applied in a general population rather than in the study sample in which it was first developed.”
§ The spectrum effect in tests for risk prediction, screening, and diagnosis > Abstract
hedgedconditional- Asserted: passes — The authors put it forward as true.
- Checkable: passes — It can be checked against evidence.
- Load-bearing: passes — The paper’s conclusions depend on it.
- Based: unclear — It is unclear why the paper says it holds.
A conclusion the paper draws from its own results — it cites no other source for it, so there is none to check. The quote shows it is in the paper.
In the paper
“If not possible, it is important to remember that, as a result of the spectrum effect, calculations of positive and negative predictive value will only partly adjust for differences in disease prevalence (box 2).”
§ The spectrum effect in tests for risk prediction, screening, and diagnosis > Conclusion and implications
plaindirect- Asserted: passes — The authors put it forward as true.
- Checkable: passes — It can be checked against evidence.
- Load-bearing: passes — The paper’s conclusions depend on it.
- Based: unclear — It is unclear why the paper says it holds.
- Rests on an assumption: The positive predictive value varies with the prevalence of the condition.
A conclusion the paper draws from its own results — it cites no other source for it, so there is none to check. The quote shows it is in the paper.
In the paper
“The performance of the test in their own population might, therefore, be different from that reported in the study”
§ The spectrum effect in tests for risk prediction, screening, and diagnosis > Conclusion and implications
hedgedconditional- Asserted: passes — The authors put it forward as true.
- Checkable: passes — It can be checked against evidence.
- Load-bearing: passes — The paper’s conclusions depend on it.
- Based: passes — The paper gives a reason why it holds.
- It may state two separate claims as one. 17
- Probably not a substantial claim. 8
The paper states this without a source or data behind it here, so there is nothing to check it against. The quote shows it is in the paper.
In the paper
“As prevalence decreases, the positive likelihood ratio (LR+), negative likelihood ratio (LR−), and specificity increase, while sensitivity decreases”
§ The spectrum effect in tests for risk prediction, screening, and diagnosis > How does the spectrum effect influence tests? > Scenario 1
plaindirect- Asserted: passes — The authors put it forward as true.
- Checkable: passes — It can be checked against evidence.
- Load-bearing: passes — The paper’s conclusions depend on it.
- Based: passes — The paper gives a reason why it holds.
It may state two separate claims as one.
The paper states this without a source or data behind it here, so there is nothing to check it against. The quote shows it is in the paper.
In the paper
“with 10-fold changes in likelihood ratios and variation of 30% in sensitivity and specificity”
§ The spectrum effect in tests for risk prediction, screening, and diagnosis > How does the spectrum effect influence tests? > Scenario 1
plaindirect- Asserted: passes — The authors put it forward as true.
- Checkable: passes — It can be checked against evidence.
- Load-bearing: passes — The paper’s conclusions depend on it.
- Based: passes — The paper gives a reason why it holds.
It may state two separate claims as one.
The paper states this without a source or data behind it here, so there is nothing to check it against. The quote shows it is in the paper.
In the paper
“In other words, as the proportion of the overall population with the disease increases, the risk of test misclassification among those with the disease decreases and—with this particular underlying distribution of X—the result is an increase in sensitivity and decrease in the negative likelihood ratio (fig 2A and 2B).”
§ The spectrum effect in tests for risk prediction, screening, and diagnosis > How does the spectrum effect influence tests? > Scenario 2
plaindirect- Asserted: passes — The authors put it forward as true.
- Checkable: passes — It can be checked against evidence.
- Load-bearing: passes — The paper’s conclusions depend on it.
- Based: passes — The paper gives a reason why it holds.
It may state two separate claims as one.
The paper states this without a source or data behind it here, so there is nothing to check it against. The quote shows it is in the paper.
In the paper
“A test developed in a population with a higher prevalence of disease (or at higher risk) will typically have a lower sensitivity and higher specificity when applied in a population with lower disease prevalence (or at lower risk)”
§ The spectrum effect in tests for risk prediction, screening, and diagnosis > Summary points
hedgeddirect- Asserted: passes — The authors put it forward as true.
- Checkable: passes — It can be checked against evidence.
- Load-bearing: passes — The paper’s conclusions depend on it.
- Based: fails — The paper may give no reason why it holds.
Probably not a substantial claim. The paper may give no reason why it holds.
The paper states this without a source or data behind it here, so there is nothing to check it against. The quote shows it is in the paper.
In the paper
“Therefore, the performance of tests is influenced by both the prevalence of the condition or disease in the sample in which it is assessed and the characteristics of the sample.”
§ The spectrum effect in tests for risk prediction, screening, and diagnosis > How does the spectrum effect influence tests?
plaindirect- Asserted: passes — The authors put it forward as true.
- Checkable: passes — It can be checked against evidence.
- Load-bearing: passes — The paper’s conclusions depend on it.
- Based: passes — The paper gives a reason why it holds.
It may state two separate claims as one.
The paper states this without a source or data behind it here, so there is nothing to check it against. The quote shows it is in the paper.
In the paper
“The wide dispersion of the values of X in this bimodal distribution also means that in figure 2C and 2D, there are fewer individuals with values close to the threshold than in scenario 1 (fig 1C and 1D). The result is a higher sensitivity and specificity for the same prevalence.”
§ The spectrum effect in tests for risk prediction, screening, and diagnosis > How does the spectrum effect influence tests? > Scenario 2
plaindirect- Asserted: passes — The authors put it forward as true.
- Checkable: passes — It can be checked against evidence.
- Load-bearing: passes — The paper’s conclusions depend on it.
- Based: passes — The paper gives a reason why it holds.
It may state two separate claims as one.
The paper states this without a source or data behind it here, so there is nothing to check it against. The quote shows it is in the paper.
In the paper
“For example, when 20% of individuals have the disease, the sensitivity and specificity in scenario 1 are 85% and 95%, respectively, compared with the corresponding values of 98% and 99% in scenario 2.”
§ The spectrum effect in tests for risk prediction, screening, and diagnosis > How does the spectrum effect influence tests? > Scenario 2
plain- Asserted: passes — The authors put it forward as true.
- Checkable: passes — It can be checked against evidence.
- Load-bearing: passes — The paper’s conclusions depend on it.
- Based: passes — The paper gives a reason why it holds.
It may state two separate claims as one.
The paper states this without a source or data behind it here, so there is nothing to check it against. The quote shows it is in the paper.
In the paper
“Further, all tests are subject to error, including:”
§ The spectrum effect in tests for risk prediction, screening, and diagnosis > What is the spectrum effect and why does it arise?
plain- Asserted: passes — The authors put it forward as true.
- Checkable: passes — It can be checked against evidence.
- Load-bearing: fails — The paper’s conclusions may not depend on it.
- Based: fails — The paper may give no reason why it holds.
Probably not a substantial claim. The paper’s conclusions may not depend on it. The paper may give no reason why it holds. It may state two separate claims as one.
A conclusion the paper draws from its own results — it cites no other source for it, so there is none to check. The quote shows it is in the paper.
In the paper
“if the test had been designed for population based screening of asymptomatic individuals, the specificity in that high risk population will be lower—and the sensitivity higher—than estimated in the original development population.”
§ The spectrum effect in tests for risk prediction, screening, and diagnosis > How does the spectrum effect influence tests? > Scenario 1
plaindirect- Asserted: passes — The authors put it forward as true.
- Checkable: passes — It can be checked against evidence.
- Load-bearing: passes — The paper’s conclusions depend on it.
- Based: passes — The paper gives a reason why it holds.
It may state two separate claims as one.
A conclusion the paper draws from its own results — it cites no other source for it, so there is none to check. The quote shows it is in the paper.
In the paper
“A diagnostic procedure developed in secondary care among patients suspected of having a particular disease will typically have lower sensitivity and higher specificity when applied as a screening tool in primary care where disease prevalence is lower.”
§ The spectrum effect in tests for risk prediction, screening, and diagnosis > How does the spectrum effect influence tests? > Scenario 1
plaindirect- Asserted: passes — The authors put it forward as true.
- Checkable: passes — It can be checked against evidence.
- Load-bearing: passes — The paper’s conclusions depend on it.
- Based: passes — The paper gives a reason why it holds.
It may state two separate claims as one.
None of the sources cited for this claim have been checked yet.
In the paper
“However, while the variation in likelihood ratio, sensitivity, and specificity due to the phenomenon known as the “spectrum effect” or “spectrum bias” has been well described,1 2 3 4 5 it is frequently overlooked by the wider medical and policy-making community when interpreting data on test performance.”
§ The spectrum effect in tests for risk prediction, screening, and diagnosis > Summary points
What the sources say
- Not checked yetcites [1] Diamond GA. Reverend Bayes’ silent majority. An alternative factor affecting sensitivity and specificity of exercise electrocardiography. Am J Cardiol 1986; 57: 1175- 80. 10.1016/0002-9149(86)90694-6 pmid:3754686. 3754686
- Not checked yetcites [2] Irwig L, Bossuyt P, Glasziou P, Gatsonis C, Lijmer J. Designing studies to ensure that estimates of test accuracy are transferable. BMJ 2002; 324: 669- 71. 10.1136/bmj.324.7338.669 pmid:11895830. 11895830 PMC1122584
- Not checked yetcites [3] Leeflang MMG, Bossuyt PMM, Irwig L. Diagnostic test accuracy may vary with prevalence: implications for evidence-based diagnosis. J Clin Epidemiol 2009; 62: 5- 12. 10.1016/j.jclinepi.2008.04.007 pmid:18778913. 18778913
boosteddirect- Asserted: passes — The authors put it forward as true.
- Checkable: passes — It can be checked against evidence.
- Load-bearing: passes — The paper’s conclusions depend on it.
- Based: passes — The paper gives a reason why it holds.
Probably not a substantial claim.
In the paper
“When Ransohoff and Feinstein first described the spectrum effect in 1978,5 they observed that the performance of a test in practice might be misrepresented by clinical studies that include too narrow a range of individuals with or without the disease of interest.”
§ The spectrum effect in tests for risk prediction, screening, and diagnosis > What is the spectrum effect and why does it arise?
What the sources say
- Not checked yetcites [5] Ransohoff DF, Feinstein AR. Problems of spectrum and bias in evaluating the efficacy of diagnostic tests. N Engl J Med 1978; 299: 926- 30. 10.1056/NEJM197810262991705 pmid:692598. 692598
hedgedconditional- Asserted: passes — The authors put it forward as true.
- Checkable: passes — It can be checked against evidence.
- Load-bearing: unclear — It is unclear whether the paper’s conclusions depend on it.
- Based: passes — The paper gives a reason why it holds.
It may state two separate claims as one.
None of the sources cited for this claim have been checked yet.
In the paper
“As Mulherin and Miller point out,6 logistic modelling can produce estimates of test performance17 among small groups, and facilitates investigation of patient characteristics that are multicategorical or continuous, enabling the investigator to model separately factors that affect sensitivity and specificity.4”
§ The spectrum effect in tests for risk prediction, screening, and diagnosis > Implications for research, clinical practice, and policy
What the sources say
- Not checked yetcites [6] Mulherin SA, Miller WC. Spectrum bias or spectrum effect? Subgroup variation in diagnostic test evaluation. Ann Intern Med 2002; 137: 598- 602. 10.7326/0003-4819-137-7-200210010-00011 pmid:12353947. 12353947
- Not checked yetcites [17] Coughlin SS, Trock B, Criqui MH, Pickle LW, Browner D, Tefft MC. The logistic modeling of sensitivity, specificity, and predictive value of a diagnostic test. J Clin Epidemiol 1992; 45: 1- 7. 10.1016/0895-4356(92)90180-U pmid:1738006. 1738006
- Not checked yetcites [4] Moons KG, van Es GA, Deckers JW, Habbema JD, Grobbee DE. Limitations of sensitivity, specificity, likelihood ratio, and bayes’ theorem in assessing diagnostic probabilities: a clinical example. Epidemiology 1997; 8: 12- 7. 10.1097/00001648-199701000-00002 pmid:9116087. 9116087
plaindirect- Asserted: passes — The authors put it forward as true.
- Checkable: passes — It can be checked against evidence.
- Load-bearing: fails — The paper’s conclusions may not depend on it.
- Based: passes — The paper gives a reason why it holds.
Probably not a substantial claim. The paper’s conclusions may not depend on it. It may state two separate claims as one.
In the paper
“In a review of 23 meta-analyses of diagnostic test accuracy, statistically significant associations between prevalence and sensitivity or specificity were found in one of three reviews, with specificity decreasing by between 0.1% and 0.5% for every 1 percentage point increase in prevalence in pooled analysis.10”
§ The spectrum effect in tests for risk prediction, screening, and diagnosis > Importance of the spectrum effect in practice
What the sources say
- Not checked yetcites [10] Leeflang MMG, Rutjes AWS, Reitsma JB, Hooft L, Bossuyt PM. Variation of a test’s sensitivity and specificity with disease prevalence. CMAJ 2013; 185: E537- 44. 10.1503/cmaj.121286 pmid:23798453. 23798453 PMC3735771
plaincorrelational- Asserted: passes — The authors put it forward as true.
- Checkable: passes — It can be checked against evidence.
- Load-bearing: passes — The paper’s conclusions depend on it.
- Based: passes — The paper gives a reason why it holds.
It may state two separate claims as one.
In the paper
“For example, Moons and colleagues4 demonstrated that the performance of an exercise test for coronary artery disease varied across patients with different characteristics; the positive likelihood ratio was 3.8 in individuals with systolic blood pressure 141-240 mm Hg, and 17.0 in those with systolic blood pressure 100-140 mm Hg.”
§ The spectrum effect in tests for risk prediction, screening, and diagnosis > Importance of the spectrum effect in practice
What the sources say
- Not checked yetcites [4] Moons KG, van Es GA, Deckers JW, Habbema JD, Grobbee DE. Limitations of sensitivity, specificity, likelihood ratio, and bayes’ theorem in assessing diagnostic probabilities: a clinical example. Epidemiology 1997; 8: 12- 7. 10.1097/00001648-199701000-00002 pmid:9116087. 9116087
boostedcorrelational- Asserted: passes — The authors put it forward as true.
- Checkable: passes — It can be checked against evidence.
- Load-bearing: unclear — It is unclear whether the paper’s conclusions depend on it.
- Based: passes — The paper gives a reason why it holds.
It may state two separate claims as one.
A conclusion the paper draws from its own results — it cites no other source for it, so there is none to check. The quote shows it is in the paper.
In the paper
“Z is unlikely to be exactly equal to X for all individuals, because of measurement error if X represents a measurable trait, or prediction error if X represents an underlying risk.”
§ The spectrum effect in tests for risk prediction, screening, and diagnosis > How does the spectrum effect influence tests?
hedged- Asserted: passes — The authors put it forward as true.
- Checkable: passes — It can be checked against evidence.
- Load-bearing: passes — The paper’s conclusions depend on it.
- Based: passes — The paper gives a reason why it holds.
Probably not a substantial claim.
In the paper
“Although the examples given above are for a situation in which the target condition is based on measurement of a continuous variable, with the presence or absence of the condition based on the value of that variable being above or below a threshold, apparent differences in test performance arising from variation in prevalence and study populations are widespread and can be large enough to influenc”
§ The spectrum effect in tests for risk prediction, screening, and diagnosis > Importance of the spectrum effect in practice
What the sources say
- Not checked yetcites [10] Leeflang MMG, Rutjes AWS, Reitsma JB, Hooft L, Bossuyt PM. Variation of a test’s sensitivity and specificity with disease prevalence. CMAJ 2013; 185: E537- 44. 10.1503/cmaj.121286 pmid:23798453. 23798453 PMC3735771
plaindirect- Asserted: passes — The authors put it forward as true.
- Checkable: passes — It can be checked against evidence.
- Load-bearing: passes — The paper’s conclusions depend on it.
- Based: passes — The paper gives a reason why it holds.
It may state two separate claims as one.
In the paper
“The STARD statement for reporting studies of diagnostic accuracy15 recommends that authors describe the study participants in detail, including the distribution of disease severity.”
§ The spectrum effect in tests for risk prediction, screening, and diagnosis > Implications for research, clinical practice, and policy
What the sources say
- Not checked yetcites [15] Bossuyt PM, Reitsma JB, Bruns DE, et al. STARD Group. STARD 2015: an updated list of essential items for reporting diagnostic accuracy studies. BMJ 2015; 351: h5527 10.1136/bmj.h5527 pmid:26511519. 26511519 PMC4623764
plain- Asserted: passes — The authors put it forward as true.
- Checkable: passes — It can be checked against evidence.
- Load-bearing: fails — The paper’s conclusions may not depend on it.
- Based: passes — The paper gives a reason why it holds.
Probably not a substantial claim. The paper’s conclusions may not depend on it.
A conclusion the paper draws from its own results — it cites no other source for it, so there is none to check. The quote shows it is in the paper.
In the paper
“The more advanced or severe the disease or condition is among those individuals affected, the greater the separation in the measured variable(s) between people those with and without the condition, and the better the test will appear to be at discriminating between the two groups.”
§ The spectrum effect in tests for risk prediction, screening, and diagnosis > How does the spectrum effect influence tests? > Scenario 2
plaindirect- Asserted: passes — The authors put it forward as true.
- Checkable: passes — It can be checked against evidence.
- Load-bearing: passes — The paper’s conclusions depend on it.
- Based: passes — The paper gives a reason why it holds.
It may state two separate claims as one.
A conclusion the paper draws from its own results — it cites no other source for it, so there is none to check. The quote shows it is in the paper.
In the paper
“This approach would allow for some exploration of the spectrum effect, and ensure that the test’s performance is not overestimated by use of a sample that is unrepresentative of the wider population.”
§ The spectrum effect in tests for risk prediction, screening, and diagnosis > Implications for research, clinical practice, and policy
hedgedconditional- Asserted: passes — The authors put it forward as true.
- Checkable: passes — It can be checked against evidence.
- Load-bearing: passes — The paper’s conclusions depend on it.
- Based: passes — The paper gives a reason why it holds.
Probably not a substantial claim. It may state two separate claims as one.
A conclusion the paper draws from its own results — it cites no other source for it, so there is none to check. The quote shows it is in the paper.
In the paper
“The effect of these errors on overall test performance depends on the proportion of individuals misclassified, which in turn depends on the number of individuals close to the cut-off point of the test.”
§ The spectrum effect in tests for risk prediction, screening, and diagnosis > How does the spectrum effect influence tests?
plaindirect- Asserted: passes — The authors put it forward as true.
- Checkable: passes — It can be checked against evidence.
- Load-bearing: passes — The paper’s conclusions depend on it.
- Based: passes — The paper gives a reason why it holds.
It may state two separate claims as one.
A conclusion the paper draws from its own results — it cites no other source for it, so there is none to check. The quote shows it is in the paper.
In the paper
“Situations like those shown in figure 2 could arise in a study in which individuals with and without disease are selected from different populations, for example, a case-control study with cases identified from hospital and controls from the community.”
§ The spectrum effect in tests for risk prediction, screening, and diagnosis > How does the spectrum effect influence tests? > Scenario 2
hedgedconditional- Asserted: passes — The authors put it forward as true.
- Checkable: passes — It can be checked against evidence.
- Load-bearing: fails — The paper’s conclusions may not depend on it.
- Based: fails — The paper may give no reason why it holds.
Probably not a substantial claim. The paper’s conclusions may not depend on it. The paper may give no reason why it holds.
The paper relies on this without support.
The variation in likelihood ratio, sensitivity, and specificity due to the spectrum effect is frequently overlooked by the wider medical and policy-making community when interpreting data on test performance.
“However, while the variation in likelihood ratio, sensitivity, and specificity due to the phenomenon known as the “spectrum effect” or “spectrum bias” has been well described,1 2 3 4 5 it is frequently overlooked by the wider medical and policy-making community when interpreting data on test performance.”
The paper relies on this without support.
The positive predictive value varies with the prevalence of the condition.
“The positive predictive value is well known to vary with the prevalence of the condition.”
Claims other papers make about this one
Each is checked against this paper’s own text: does it say what the citing paper says it does?
In the citing paper
“Such fundamental differences in the spectrum of skin conditions compared with the general population means that poorer accuracy is likely to be observed in a real world setting.38 39”
From Algorithm based smartphone apps to assess risk of skin cancer in adults: systematic review of diagnostic accuracy studies (2020) · cites this paper as [39]
Citations
Cites
STARD 2015: an updated list of essential items for reporting diagnostic accuracy studies
Bossuyt, P. M., Reitsma, J. B., Bruns, D. E., Gatsonis, C. A., Glasziou, P. P., Irwig, L., Lijmer, J. G., Moher, D., Rennie, D., de Vet, H. C. W., et al. (2015) · BMJ · doi:10.1136/bmj.h5527 · Cited by 3,660
Problems of Spectrum and Bias in Evaluating the Efficacy of Diagnostic Tests
Ransohoff, D. F., & Feinstein, A. R. (1978) · New England Journal of Medicine · doi:10.1056/nejm197810262991705 · Cited by 1,739
Prognosis Research Strategy (PROGRESS) 3: Prognostic Model Research
Steyerberg, E. W., Moons, K. G. M., van der Windt, D. A., Hayden, J. A., Perel, P., Schroter, S., Riley, R. D., Hemingway, H., Altman, D. G., & for the PROGRESS Group (2013) · PLoS Medicine · doi:10.1371/journal.pmed.1001381 · Cited by 1,508
Prognosis Research Strategy (PROGRESS) 2: Prognostic Factor Research
Riley, R. D., Hayden, J. A., Steyerberg, E. W., Moons, K. G. M., Abrams, K., Kyzas, P. A., Malats, N., Briggs, A., Schroter, S., Altman, D. G., et al. (2013) · PLoS Medicine · doi:10.1371/journal.pmed.1001380 · Cited by 823
Prognosis research strategy (PROGRESS) 1: A framework for researching clinical outcomes
Hemingway, H., Croft, P. R., Perel, P., Hayden, J. A., Abrams, K. R., Timmis, A., Briggs, A. H., Udumyan, R., Moons, K. G. M., Steyerberg, E. W., et al. (2013) · BMJ · doi:10.1136/bmj.e5595 · Cited by 698
Statistics Notes: Diagnostic tests 3: receiver operating characteristic plots
Altman, D. G., & Bland, J. M. (1994) · BMJ · doi:10.1136/bmj.309.6948.188 · Cited by 599
Statistical Approaches to the Analysis of Receiver Operating Characteristic (ROC) Curves
McNeil, B. J., & Hanley, J. A. (1984) · Medical Decision Making · doi:10.1177/0272989x8400400203 · Cited by 561
Prognosis research strategy (PROGRESS) 4: Stratified medicine research
Hingorani, A. D., van der Windt, D., Riley, R. D., Abrams, K. R., Moons, K. G. M., Steyerberg, E. W., Schroter, S., Sauerbrei, W., Altman, D. G., Hemingway, H., et al. (2013) · BMJ · doi:10.1136/bmj.e5793 · Cited by 534
Variation of a test’s sensitivity and specificity with disease prevalence
Leeflang, M. M. G., Rutjes, A. W. S., Reitsma, J. B., Hooft, L., & Bossuyt, P. M. M. (2013) · Canadian Medical Association Journal · doi:10.1503/cmaj.121286 · Cited by 530
Diagnostic test accuracy may vary with prevalence: implications for evidence-based diagnosis.
Leeflang, M., Bossuyt, P., & Irwig, L. (2009) · Journal of Clinical Epidemiology · doi:10.1016/j.jclinepi.2008.04.007 · Cited by 481
Research works printed but not linked: 1
- [9]National Institute for Health and Care Excellence. Lipid modification: cardiovascular risk assessment and the modification of blood lipids for the primary and secondary prevention of cardiovascular disease (CG181). 2014. https://www.nice.org.uk/guidance/cg181/resources/guidance-lipid-modification-cardiovascular-risk-assessment-and-the-modification-of-blood-lipids-for-the-primary-and-secondary-prevention-of-cardiovascular-disease-pdf. 25340243
Cited by
Sorted by citations
Berzigotti, A., Tsochatzis, E., Boursier, J., Castera, L., Cazzagon, N., Friedrich-Rust, M., Petta, S., & Thiele, M. (2021) · Journal of Hepatology · doi:10.1016/j.jhep.2021.05.025 · Cited by 1,925
Rapid, point-of-care antigen and molecular-based tests for diagnosis of SARS-CoV-2 infection
Dinnes, J., Deeks, J. J., Adriano, A., Berhane, S., Davenport, C. F., Dittrich, S., Emperador, D., Takwoingi, Y., Cunningham, J. A., Beese, S. E., et al. (2020) · Cochrane Database of Systematic Reviews · doi:10.1002/14651858.cd013705 · Cited by 1,182
Interpreting a covid-19 test result
Watson, J., Whiting, P. F., & Brush, J. E. (2020) · BMJ · doi:10.1136/bmj.m1808 · Cited by 712
Plasma protein patterns as comprehensive indicators of health
Williams, S. A., Kivimaki, M., Langenberg, C., Hingorani, A. D., Casas, J. P., Bouchard, C., Jonasson, C., Sarzynski, M. A., Shipley, M. J., Alexander, L., et al. (2019) · Nature Medicine · doi:10.1038/s41591-019-0665-2 · Cited by 506
Kaplan, D. E., Ripoll, C., Thiele, M. S., Fortune, B. E., Simonetto, D. A., García–Tsao, G., & Bosch, J. (2023) · Hepatology · doi:10.1097/hep.0000000000000647 · Cited by 549
Jones, O. T., Matin, R. N., van der Schaar, M., Prathivadi Bhayankaram, K., Ranmuthu, C. K. I., Islam, M. S., Behiyat, D., Boscott, R., Calanzani, N., Emery, J., et al. (2022) · The Lancet Digital Health · doi:10.1016/s2589-7500(22)00023-1 · Cited by 272
Petroff, D., Blank, V., Newsome, P. N., Shalimar, Voican, C. S., Thiele, M., de Lédinghen, V., Baumeler, S., Chan, W. K., Perlemuter, G., et al. (2021) · The Lancet Gastroenterology & Hepatology · doi:10.1016/s2468-1253(20)30357-5 · Cited by 268
Freeman, K., Dinnes, J., Chuchu, N., Takwoingi, Y., Bayliss, S. E., Matin, R. N., Jain, A., Walter, F. M., Williams, H. C., & Deeks, J. J. (2020) · BMJ · doi:10.1136/bmj.m127 · Cited by 260
Using the ELF test, FIB-4 and NAFLD fibrosis score to screen the population for liver disease
Kjærgaard, M., Lindvig, K. P., Thorhauge, K. H., Andersen, P., Hansen, J. K., Kastrup, N., Jensen, J. M., Hansen, C. D., Johansen, S., Israelsen, M. E., et al. (2023) · Journal of Hepatology · doi:10.1016/j.jhep.2023.04.002 · Cited by 248
di Pietro, M., Canto, M. I., & Fitzgerald, R. C. (2017) · Gastroenterology · doi:10.1053/j.gastro.2017.07.041 · Cited by 240
Dermoscopy, with and without visual inspection, for diagnosing melanoma in adults
Dinnes, J., Deeks, J. J., Chuchu, N., di Ruffano, L. F., Matin, R., Thomson, D. R., Wong, K. Y., Aldridge, R. B., Abbott, R. A., Fawzy, M., et al. (2018) · Cochrane Database of Systematic Reviews · doi:10.1002/14651858.cd011902.pub2 · Cited by 255
Thombs, B. D., Kwakkenbos, L., Levis, A. W., & Benedetti, A. (2018) · Canadian Medical Association Journal · doi:10.1503/cmaj.170691 · Cited by 231
COVID-19 Antibody Tests and Their Limitations
Liu, G., & Rusling, J. F. (2021) · ACS Sensors · doi:10.1021/acssensors.0c02621 · Cited by 226
Teledermatology for diagnosing skin cancer in adults.
Chuchu, N., Dinnes, J., Takwoingi, Y., Matin, R. N., Bayliss, S. E., Davenport, C., Moreau, J. F., Bassett, O., Godfrey, K., O'Sullivan, C., et al. (2018) · Cochrane Database of Systematic Reviews · doi:10.1002/14651858.cd013193 · Cited by 175
MS-Based Proteomics of Body Fluids: The End of the Beginning
Bader, J. M., Albrecht, V., & Mann, M. (2023) · Molecular & Cellular Proteomics · doi:10.1016/j.mcpro.2023.100577 · Cited by 178
Meyer, A. N. D., Giardina, T. D., Khawaja, L., & Singh, H. (2021) · Patient Education and Counseling · doi:10.1016/j.pec.2021.07.028 · Cited by 155
Funston, G., Hamilton, W. T., Abel, G., Crosbie, E. J., Rous, B., & Walter, F. M. (2020) · PLoS Medicine · doi:10.1371/journal.pmed.1003295 · Cited by 160
Applications of machine learning in addiction studies: A systematic review
Mak, K. K., Lee, K., & Park, C. (2019) · Psychiatry Research · doi:10.1016/j.psychres.2019.03.001 · Cited by 155
di Ruffano, L. F., Takwoingi, Y., Dinnes, J., Chuchu, N., Bayliss, S. E., Davenport, C. F., Matin, R., Godfrey, K., O'Sullivan, C., Gulati, A., et al. (2018) · Cochrane Database of Systematic Reviews · doi:10.1002/14651858.cd013186 · Cited by 151
New landscape of the diagnosis of Alzheimer’s disease
Frisoni, G. B., Hansson, O., Nichols, E., Garibotto, V., Schindler, S. E., van der Flier, W. M., Jessen, F., Villain, N., Arenaza-Urquijo, E. M., Crivelli, L., et al. (2025) · The Lancet · doi:10.1016/s0140-6736(25)01294-2 · Cited by 143
Gaccioli, F., Sovio, U., Cook, E., Hund, M., Jones, D. S., & Smith, G. C. S. (2018) · The Lancet Child & Adolescent Health · doi:10.1016/s2352-4642(18)30129-9 · Cited by 141
Turner, C. T., Gupta, R. K., Tsaliki, E., Roe, J. K., Mondal, P., Nyawo, G. R., Palmer, Z., Miller, R. F., Reeve, B. W. P., Theron, G., et al. (2020) · The Lancet Respiratory Medicine · doi:10.1016/s2213-2600(19)30469-2 · Cited by 131
Estimate False-Negative RT-PCR Rates for SARS-CoV-2: A Systematic Review and Meta-Analysis
Pecoraro, V., Negro, A., Pirotti, T., & Trenti, T. (2021) · European Journal of Clinical Investigation · doi:10.1111/eci.13706 · Cited by 117
Elkrief, L., Lazareth, M., Chevret, S., Paradis, V., Magaz, M., Blaise, L., Rubbia‐Brandt, L., Moga, L., Durand, F., Payancé, A., et al. (2020) · Hepatology · doi:10.1002/hep.31688 · Cited by 93
Diagnosing occupational asthma
Vandenplas, O., Suojalehto, H., & Cullinan, P. (2017) · Clinical & Experimental Allergy · doi:10.1111/cea.12858 · Cited by 87
Bailey, S. E. R., Abel, G., Atkins, A., Byford, R. C., Davies, S.-J., Mays, J., McDonald, T. J., Miller, J. D., Neck, C., Renninson, J., et al. (2021) · British Journal of Cancer · doi:10.1038/s41416-020-01221-9 · Cited by 86
Dinnes, J., Deeks, J. J., Chuchu, N., Matin, R., Wong, K. Y., Aldridge, R. B., Durack, A., Gulati, A., Chan, S. A., Johnston, L., et al. (2018) · Cochrane Database of Systematic Reviews · doi:10.1002/14651858.cd011901.pub2 · Cited by 122
Dermoscopy for melanoma detection and triage in primary care: a systematic review
Jones, O., Jurascheck, L., van Melle, M., Hickman, S. E., Burrows, N., Hall, P. N., Emery, J. D., & Walter, F. M. (2019) · BMJ Open · doi:10.1136/bmjopen-2018-027529 · Cited by 83
Screening for Peripheral Artery Disease Using the Ankle-Brachial Index
Guirguis‐Blake, J., Evans, C. V., Redmond, N., & Lin, J. S. (2018) · JAMA · doi:10.1001/jama.2018.4250 · Cited by 89
A roadmap for the clinical implementation of optical-imaging biomarkers
Waterhouse, D. J., Fitzpatrick, C. R. M., Pogue, B. W., O’Connor, J. P. B., & Bohndiek, S. E. (2019) · Nature Biomedical Engineering · doi:10.1038/s41551-019-0392-5 · Cited by 81
Radiomic Analysis: Study Design, Statistical Analysis, and Other Bias Mitigation Strategies
Moskowitz, C. S., Welch, M. L., Jacobs, M. A., Kurland, B. F., & Simpson, A. L. (2022) · Radiology · doi:10.1148/radiol.211597 · Cited by 83
Gaccioli, F., Lager, S., Sovio, U., Jones, D. S., & Smith, G. C. S. (2016) · Placenta · doi:10.1016/j.placenta.2016.10.011 · Cited by 79
Ultrasound, CT, MRI, or PET-CT for staging and re-staging of adults with cutaneous melanoma
Dinnes, J., di Ruffano, L. F., Takwoingi, Y., Cheung, S. T., Nathan, P., Matin, R., Chuchu, N., Chan, S. A., Durack, A., Bayliss, S. E., et al. (2019) · Cochrane Database of Systematic Reviews · doi:10.1002/14651858.cd012806.pub2 · Cited by 85
Cognitive screening instruments to identify vascular cognitive impairment: A systematic review
Ghafar, M. Z. A. A., Miptah, H. N., & Ó’Caoimh, R. (2019) · International Journal of Geriatric Psychiatry · doi:10.1002/gps.5136 · Cited by 76
Performance of Coronary Risk Scores Among Patients With Chest Pain in the Emergency Department
Mark, D. G., Huang, J., Chettipally, U. K., Kene, M. V., Anderson, M. L., Hess, E. P., Ballard, D. W., Vinson, D. R., & Reed, M. (2018) · Journal of the American College of Cardiology · doi:10.1016/j.jacc.2017.11.064 · Cited by 74
Boyd, L. N. C., Ali, M., Leeflang, M., Treglia, G., de Vries, R., Large, T. Y. S. L., Besselink, M. G., Giovannetti, E., van Laarhoven, H. W. M., & Geert Kazemier, M. (2022) · EClinicalMedicine · doi:10.1016/j.eclinm.2022.101747 · Cited by 70
Visual inspection for diagnosing cutaneous melanoma in adults
Dinnes, J., Deeks, J. J., Grainge, M. J., Chuchu, N., di Ruffano, L. F., Matin, R., Thomson, D. R., Wong, K. Y., Aldridge, R. B., Abbott, R. A., et al. (2018) · Cochrane Database of Systematic Reviews · doi:10.1002/14651858.cd013194 · Cited by 81
Chest X-ray sensitivity and lung cancer outcomes: a retrospective observational study
Bradley, S. H., Bhartia, B., Callister, M. E. J., Hamilton, W. T., Hatton, N. L. F., Kennedy, M., Mounce, L. T. A., Shinkins, B., Wheatstone, P., & Neal, R. D. (2021) · British Journal of General Practice · doi:10.3399/bjgp.2020.1099 · Cited by 69
Perry, L. A., Lucarelli, T., Penny‐Dimri, J. C., McInnes, M. D. F., Mondello, S., Bustamante, A., Montaner, J., Foerch, C., Kwan, P., Davis, S. M., et al. (2018) · International Journal of Stroke · doi:10.1177/1747493018806167 · Cited by 66
State of the art and the future of microbiome-based biomarkers: a multidisciplinary Delphi consensus
Rodriguez, J., Hassani, Z., Silva, C. A. C., Betsou, F., Carraturo, F., Fasano, A., Israelsen, M. E., Iyappan, A., Krag, A. A., Metwaly, A., et al. (2024) · The Lancet Microbe · doi:10.1016/j.lanmic.2024.07.011 · Cited by 76
Briggs, S., Law, P., East, J. E., Wordsworth, S., Dunlop, M. G., Houlston, R. S., Hippisley‐Cox, J., & Tomlinson, I. P. M. (2022) · BMJ · doi:10.1136/bmj-2022-071707 · Cited by 72
Jones, O. T., Calanzani, N., Saji, S., Duffy, S. W., Emery, J., Hamilton, W., Singh, H., de Wit, N. J., & Walter, F. M. (2021) · Journal of Medical Internet Research · doi:10.2196/23483 · Cited by 65
IFCC Interim Guidelines on Serological Testing of Antibodies against SARS-CoV-2
Bohn, M. K., Loh, T. P., Wang, C.-B., Mueller, R., Koch, D. D., Sethi, S. K., Rawlinson, W. D., Clementi, M., Erasmus, R. T., Leportier, M., et al. (2020) · Clinical Chemistry and Laboratory Medicine (CCLM) · doi:10.1515/cclm-2020-1413 · Cited by 63
Precision Medicine Approaches with Metabolomics and Artificial Intelligence
Barberis, E., Khoso, S., Sica, A., Falasca, M., Gennari, A., Dondero, F., Afantitis, A., & Manfredi, M. (2022) · International Journal of Molecular Sciences · doi:10.3390/ijms231911269 · Cited by 68
IDENTIFYING FEATURES OF EARLY AND LATE AGE-RELATED MACULAR DEGENERATION
Graham, K. W., Chakravarthy, U., Hogg, R. E., Muldrew, K. A., Young, I. S., & Kee, F. (2017) · Retina · doi:10.1097/iae.0000000000001777 · Cited by 62
Opportunities and barriers in omics-based biomarker discovery for steatotic liver diseases
Thiele, M. S., Villesen, I. F., Niu, L., Johansen, S., Sulek, K., Nishijima, S., Espen, L. V., Keller, M. I., Israelsen, M. E., Suvitaival, T., et al. (2024) · Journal of Hepatology · doi:10.1016/j.jhep.2024.03.035 · Cited by 67
Long, N. P., Yoon, S. J., Anh, N. H., Nghi, T. D., Lim, D. K., Hong, Y. J., Hong, S., & Kwon, S. W. (2018) · Metabolomics · doi:10.1007/s11306-018-1404-2 · Cited by 62
Evaluating diagnostic strategies for early detection of cancer: the CanTest framework
Walter, F. M., Thompson, M., Wellwood, I., Abel, G., Hamilton, W. T., Johnson, M., Lyratzopoulos, G., Messenger, M. P., Neal, R. D., Rubin, G. P., et al. (2019) · BMC Cancer · doi:10.1186/s12885-019-5746-6 · Cited by 58
Assessment of Extubation Readiness Using Spontaneous Breathing Trials in Extremely Preterm Neonates
Shalish, W., Kanbar, L. J., Kovács, L., Chawla, S., Keszler, M., Rao, S., Latremouille, S., Precup, D., Brown, K. A., Kearney, R. E., et al. (2019) · Archives of Pediatrics and Adolescent Medicine · doi:10.1001/jamapediatrics.2019.4868 · Cited by 58
Nicholson, B. D., Hamilton, W. T., Koshiaris, C., Oke, J. L., Hobbs, R. F., & Aveyard, P. N. (2020) · British Journal of Cancer · doi:10.1038/s41416-020-0829-3 · Cited by 57
Wong, K. C., Klimis, H., Lowres, N., Huben, A. V., Marschner, S. L., & Chow, C. K. (2020) · Heart · doi:10.1136/heartjnl-2020-316611 · Cited by 50
Meta-analysis: enhanced liver fibrosis test to identify hepatic fibrosis in chronic liver diseases
Hinkson, A., Lally, H., Gibson, H., Jones, R., Rowe, I. A., Shinkins, B., & Parker, R. (2023) · Alimentary Pharmacology & Therapeutics · doi:10.1111/apt.17385 · Cited by 51
de Thurah, L., Bonde, J. H., Lam, J. U. H., & Rebolj, M. (2017) · Clinical Microbiology and Infection · doi:10.1016/j.cmi.2017.05.020 · Cited by 49
Barr, C. E., Funston, G., Jeevan, D. N., Sundar, S. S., Mounce, L. T. A., & Crosbie, E. J. (2022) · Cancers · doi:10.3390/cancers14092124 · Cited by 46
Damen, J. A., Debray, T. P. A., Pajouheshnia, R., Reitsma, J. B., Scholten, R. J. P. M., Moons, K. G. M., & Hooft, L. (2019) · BMJ Open · doi:10.1136/bmjopen-2018-026160 · Cited by 46
Diagnostic Performance of a Novel Noninvasive Workup in the Setting of Dry Eye Disease
Vigo, L., Pellegrini, M., Bernabei, F., Carones, F., Scorcia, V., & Giannaccare, G. (2020) · Journal of Ophthalmology · doi:10.1155/2020/5804123 · Cited by 44
Tatum, R. C., McGowan, C. M., & Ireland, J. L. (2021) · The Veterinary Journal · doi:10.1016/j.tvjl.2021.105695 · Cited by 44
Griffin, S. J. (2022) · Diabetologia · doi:10.1007/s00125-022-05782-7 · Cited by 46
Self-citationGuidance for Studies Evaluating the Accuracy of Sputum-Based Tests to Diagnose Tuberculosis
Schumacher, S. G., Wells, W. A., Nicol, M. P., Steingart, K. R., Theron, G., Dorman, S. E., Pai, M., Churchyard, G., Scott, L. E., Stevens, W. S., et al. (2019) · The Journal of Infectious Diseases · doi:10.1093/infdis/jiz258 · Cited by 41
Surveillance of the liver in type 2 diabetes: important but unfeasible?
Qadri, S. U., & Yki‐Järvinen, H. (2024) · Diabetologia · doi:10.1007/s00125-024-06087-7 · Cited by 45
Næser, E. U., Møller, H., Fredberg, U., Frystyk, J., & Vedsted, P. (2017) · BMC Cancer · doi:10.1186/s12885-017-3845-9 · Cited by 41
Pajouheshnia, R., van Smeden, M., Peelen, L. M., & Groenwold, R. H. H. (2018) · Journal of Clinical Epidemiology · doi:10.1016/j.jclinepi.2018.09.001 · Cited by 40
Le, L. T. P., Nguyen, A. H. Q., Tu, L. M. T. P. P. L. M., Ngo, H. T. T., Wang, X., Cunningham, B. T., Valera, E., Bashir, R., Taylor-Robinson, A. W., & Do, C. (2024) · TrAC Trends in Analytical Chemistry · doi:10.1016/j.trac.2024.117681 · Cited by 39
Validation of childhood asthma predictive tools: A systematic review
Colicino, S., Munblit, D., Minelli, C., Čustović, A., & Cullinan, P. (2019) · Clinical & Experimental Allergy · doi:10.1111/cea.13336 · Cited by 37
Non-invasive tests for alcohol-associated liver disease
Israelsen, M. E., Rungratanawanich, W., Thiele, M. S., & Liangpunsakul, S. (2024) · Hepatology · doi:10.1097/hep.0000000000000885 · Cited by 37
Setting clinical performance specifications to develop and evaluate biomarkers for clinical use
Lord, S. J., John, A. S., Bossuyt, P. M., Sandberg, S., Monaghan, P. J., O’Kane, M., Cobbaert, C. M., Röddiger, R., Lennartz, L., Gelfi, C., et al. (2019) · Annals of Clinical Biochemistry International Journal of Laboratory Medicine · doi:10.1177/0004563219842265 · Cited by 36
Marchesini, G., Bugianesi, E., Burra, P., Marra, F., Miele, L., Alisi, A., Vajro, P., Masarone, M., Petta, S., Persico, M., et al. (2021) · Nutrition Metabolism and Cardiovascular Diseases · doi:10.1016/j.numecd.2021.04.028 · Cited by 70
Moes, H. R., Henriksen, T., Sławek, J. W., Phokaewvarangkul, O., Buskens, E., & van Laar, T. (2023) · Journal of Neural Transmission · doi:10.1007/s00702-023-02656-z · Cited by 33
Watson, J., Mounce, L. T. A., Bailey, S. E. R., Cooper, S. L., & Hamilton, W. T. (2019) · BMJ · doi:10.1136/bmj.l5774 · Cited by 33
Marchesini, G., Bugianesi, E., Burra, P., Marra, F., Miele, L., Alisi, A., Vajro, P., Masarone, M., Petta, S., Persico, M., et al. (2021) · Digestive and Liver Disease · doi:10.1016/j.dld.2021.04.029 · Cited by 34
Arun, S., Grosheva, M. N., Kosenko, M. G., Robertus, J. L., Blyuss, O. B., Gabe, R., Munblit, D., & Offman, J. (2025) · npj Precision Oncology · doi:10.1038/s41698-025-00940-7 · Cited by 34
Clinical Spectroscopy: Lost in Translation?
Cameron, J. M., Rinaldi, C., Rutherford, S. H., Sala, A., Theakstone, A. G., & Baker, M. J. (2021) · Applied Spectroscopy · doi:10.1177/00037028211021846 · Cited by 32
Screening for liver fibrosis: lessons from colorectal and lung cancer screening
Thiele, M. S., Kamath, P. S., Graupera, I., Castells, A., de Koning, H. J., Serra‐Burriel, M., Lammert, F., & Ginès, P. (2024) · Nature Reviews Gastroenterology & Hepatology · doi:10.1038/s41575-024-00907-2 · Cited by 30
Green, H., Merriel, S. W., Oram, R. A., Ruth, K. S., Tyrrell, J., Jones, S. E., Thirlwell, C., Gillings, M., Weedon, M. N., & Bailey, S. E. R. (2022) · British Journal of Cancer · doi:10.1038/s41416-022-01918-z · Cited by 24
Validation of the PCL-5 in Dutch trauma-exposed adults
Hoeboer, C. M., Karaban, I., Karchoud, J. F., Olff, M., & van Zuiden, M. (2024) · BMC Psychology · doi:10.1186/s40359-024-01951-y · Cited by 33
Barr, C. E., Njoku, K., Jones, E. R., & Crosbie, E. J. (2022) · Diagnostics · doi:10.3390/diagnostics12112834 · Cited by 26
COVID-19 rapid diagnostics: practice review
Reynard, C., Allen, A. J., Shinkins, B., Prestwich, G., Goves, J., Davies, K., & Body, R. M. (2021) · Emergency Medicine Journal · doi:10.1136/emermed-2021-211814 · Cited by 25
Population screening for cirrhosis
Thiele, M. S., Pose, E., Juanola, A., Mellinger, J. L., & Ginès, P. (2024) · Hepatology Communications · doi:10.1097/hc9.0000000000000512 · Cited by 25
CAP for the detection of hepatic steatosis in clinical practice
Ferraioli, G. (2021) · The Lancet. Gastroenterology & hepatology · doi:10.1016/s2468-1253(20)30367-8 · Cited by 25
Mathijssen, H., Bawaskar, P. H., Rochlani, Y. M., Georgy, I., Athwal, P. S. S., Guo, Y. Y., Pollmann, D., Markowitz, J., von Wald, L. N., Roukoz, H., et al. (2025) · European Heart Journal · doi:10.1093/eurheartj/ehaf338 · Cited by 24
Outcome-based analytical performance specifications: current status and future challenges
Horvath, A. R., Bell, K., Ceriotti, F., Jones, G. R. D., Loh, T. P., Lord, S. J., & Sandberg, S. (2024) · Clinical Chemistry and Laboratory Medicine (CCLM) · doi:10.1515/cclm-2024-0125 · Cited by 23
Disease classification, diagnostic challenges, and evolving clinical trial design in MASLD
Lauridsen, M. M., Ravnskjær, K., Gluud, L. L., & Sanyal, A. J. (2025) · Journal of Clinical Investigation · doi:10.1172/jci189953 · Cited by 29
Frozen section in thyroid gland follicular neoplasms: It's high time to abandon it!
Sanabria, Á., Zafereo, M., Thompson, L. D. �., Hernandez-Prera, J. C., Kowalski, L. P., Nixon, I. J., Shaha, A. R., Rodrigo, J. P., Mäkitie, A. A., Poorten, V. V., et al. (2020) · Surgical Oncology · doi:10.1016/j.suronc.2020.12.005 · Cited by 23
Added value of CRP to clinical features when assessing appendicitis in children
Blok, G., Nikkels, E. D., van der Lei, J., Berger, M. Y., & Holtman, G. A. (2022) · European Journal of General Practice · doi:10.1080/13814788.2022.2067142 · Cited by 23
Schreiner, A. D., Zhang, J., Moran, W. P., Koch, D., Marsden, J. E., Livingston, S., Mauldin, P. D., & Gebregziabher, M. (2022) · Liver International · doi:10.1111/liv.15295 · Cited by 22
Thomas, G. R., Kenny, L. C., Baker, P. N., & Tuytten, R. (2017) · Diagnostic and Prognostic Research · doi:10.1186/s41512-017-0017-y · Cited by 22
Nicholson, B. D., Aveyard, P. N., Price, S. J., Hobbs, R. F., Koshiaris, C., & Hamilton, W. T. (2020) · BMJ · doi:10.1136/bmj.m2651 · Cited by 23
RetractedXu, Y., Zhu, S., Xia, C., Yu, H., Shi, S., Chen, K., He, Y., Deng, C., Jin, H., Liu, J., et al. (2025) · 中国科学通报:英文版 · doi:10.1016/j.scib.2025.06.030 · Cited by 27
Rahman, S., Irfan, M., & Siddiqui, M. A. R. (2021) · BMJ Open Ophthalmology · doi:10.1136/bmjophth-2020-000663 · Cited by 21
Associazione Italiana per lo Studio del Fegato (AISF), S. I. D. D. (. A. S. I. D. (. (2021) · Eating and Weight Disorders - Studies on Anorexia Bulimia and Obesity · doi:10.1007/s40519-021-01287-1 · Cited by 22
Kundu, S., Mazumdar, M., & Ferket, B. S. (2017) · BMC Medical Research Methodology · doi:10.1186/s12874-017-0345-1 · Cited by 21
Dave, R., Bromley, H. L., Taxiarchi, V. P., Camacho, E. M., Chatterjee, S., Barnes, N. L. P., Hutchison, G., Bishop, P. W., Hamilton, W. T., Kirwan, C., et al. (2021) · British Journal of General Practice · doi:10.3399/bjgp.2021.0475 · Cited by 20
Urine CA125 and HE4 for the Detection of Ovarian Cancer in Symptomatic Women
Barr, C. E., Njoku, K., Owens, G. L., & Crosbie, E. J. (2023) · Cancers · doi:10.3390/cancers15041256 · Cited by 20
Clinical and Technological Approaches to the Prehospital Diagnosis of Large Vessel Occlusion
Gaal, S. C. V., & Demchuk, A. M. (2018) · Stroke · doi:10.1161/strokeaha.117.017947 · Cited by 20
Identifying Ovarian Cancer in Symptomatic Women: A Systematic Review of Clinical Tools
Funston, G., Hardy, V., Abel, G., Crosbie, E. J., Emery, J. D., Hamilton, W. T., & Walter, F. M. (2020) · Cancers · doi:10.3390/cancers12123686 · Cited by 20
Beyond one-cutoff-fits-all: determining cutoff values for the PTSD checklist for DSM-5 (PCL-5)
Pettrich, A., Schellong, J., Dyer, A., Ehring, T. W., Knaevelsrud, C., Krüger-Gottschalk, A., Nesterko, Y., Schäfer, I., & Glaesmer, H. (2025) · European Journal of Psychotraumatology · doi:10.1080/20008066.2025.2514878 · Cited by 21
Rubin, G. P., Walter, F. M., Emery, J. D., Hamilton, W. T., Hoare, Z., Howse, J., Nixon, C., Srivastava, T., Thomas, C., Ukoumunne, O. C., et al. (2021) · BMJ Open · doi:10.1136/bmjopen-2020-041795 · Cited by 19
Self-citationScreening for NAFLD—Current Knowledge and Challenges
Forlano, R., Sigon, G., Mullish, B. H., Yee, M. S., & Manousou, P. (2023) · Metabolites · doi:10.3390/metabo13040536 · Cited by 22
Tavares, C. A. M., Samesima, N., Hajjar, L. A., Godoy, L. C., Padrão, E. M. H., Neto, F. L., Facin, M., Filho, W. J., Farkouh, M. E., & Pastore, C. A. (2021) · Scientific Reports · doi:10.1038/s41598-021-91083-9 · Cited by 18
“Liquid biopsy” for cancer screening
Bradley, S. H., & Barclay, M. (2021) · BMJ · doi:10.1136/bmj.m4933 · Cited by 18
Metadata
- Authors
- Usher-Smith, J. A., Sharp, & Griffin, S. J.
- Affiliations
- University of Cambridge (GB)
- Venue
- BMJ
- Publisher
- BMJ
- Published
- 2016-06-22
- Volume
- 353
- Pages
- i3139
- ISSN
- 1756-1833 (ISSN-L)
- PMC
- PMC4916916
- OpenAlex
- W2351656844
- Semantic Scholar
- a1b5fbcbe1f64273ea06ff34b76fce7cc3677414
- Cited by
- 250
- References
- 16
- Citations by year
- 2026: 27 · 2025: 22 · 2024: 30 · 2023: 25 · 2022: 30 · 2021: 36 · 2020: 26 · 2019: 20 · 2018: 23 · 2017: 9 · 2016: 2
- FWCI
- 18.52
- Type
- journal article
- Language
- en
- Open access
- hybrid
- doi.org
- Locations
- BMJ (publishedVersion, cc-by)
- PubMed Central (publishedVersion, cc-by)
- PubMed (publishedVersion)
- HighWire Press Open Archive (submittedVersion)
- Apollo (University of Cambridge) (submittedVersion, cc-by)
- Funders
- National Institute for Health and Care Research (CL-2012-14-007)
- Medical Research Council (MC_UU_12015/1, MC_UU_12015/4)
- Topics
- Physical Sciences › Mathematics › Statistics and Probability › Statistical Methods in Epidemiology
- Social Sciences › Decision Sciences › Statistics, Probability and Uncertainty › Meta-analysis and systematic reviews
- Health Sciences › Health Professions › Medical Laboratory Technology › Clinical Laboratory Practices and Quality Control
- Keywords
- test performance, risk prediction, disease screening, diagnosis, generalizability, test evaluation
- MeSH terms
- Humans, Mass Screening, Predictive Value of Tests, Risk Factors, Sensitivity and Specificity, Bias, Prevalence, Likelihood Functions, Risk Assessment, Diagnostic Techniques and Procedures
About these checks
Registry, retraction, Cites and statistics results are computed, not judged, with one exception: a printed reference that no index lists is read once by a model before it counts as a citation error. Claims are extracted by a model and kept only when their quote appears verbatim in the text; each cited source is then checked, with a model’s help, for whether it says what the claim relies on. Those verdicts can be wrong — read the claim’s quote and the cited source before relying on one.
A language model drew the claims from the paper on 2026-10-08, under version 3 of the claim definition (model deepseek-v4.1-flash, prompt extract-v3).
A second model labelled each claim on 2026-10-08 (model jev-1.13-20260917, definition revision gold-guideline-v0.2).
Statistics and arithmetic are recomputed, not judged.
Confidence bands are shown only for fields calibrated on our annotated test set. None is calibrated yet, so no band is shown.
What counts as a claim ›How we measure confidence ›How we check this ›
Are you an author, or do you see a problem with this page? Request a review
