

The DOI matches its Crossref record, with a small difference in title or year; 55 of the 55 references it cites were found in a registry or an index.
Calendar Aging of Lithium-Ion Batteries: I. Impact of the Graphite Anode on Capacity Fade
Open accessAbstract
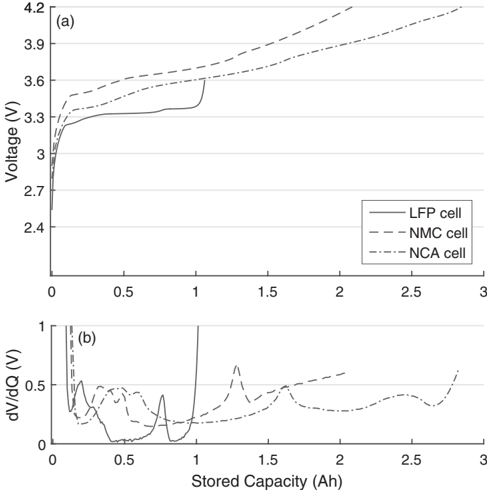
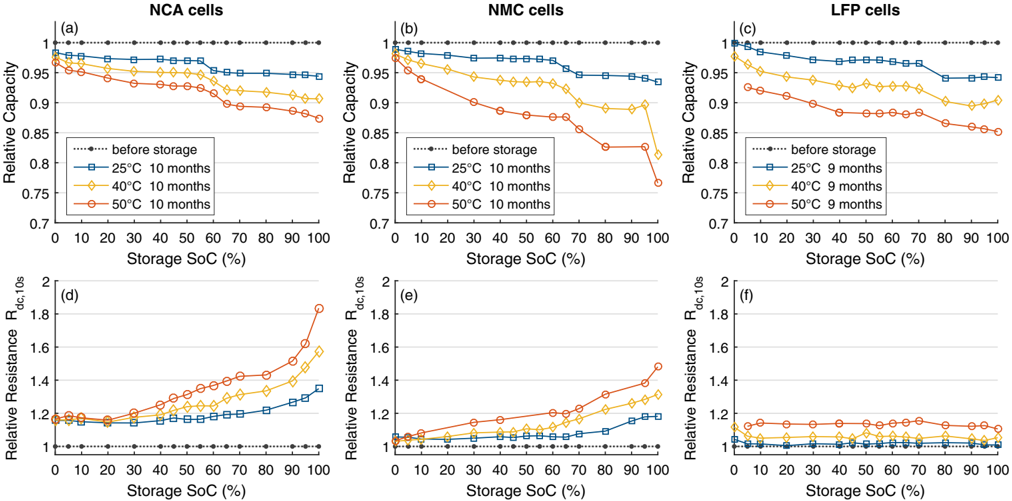
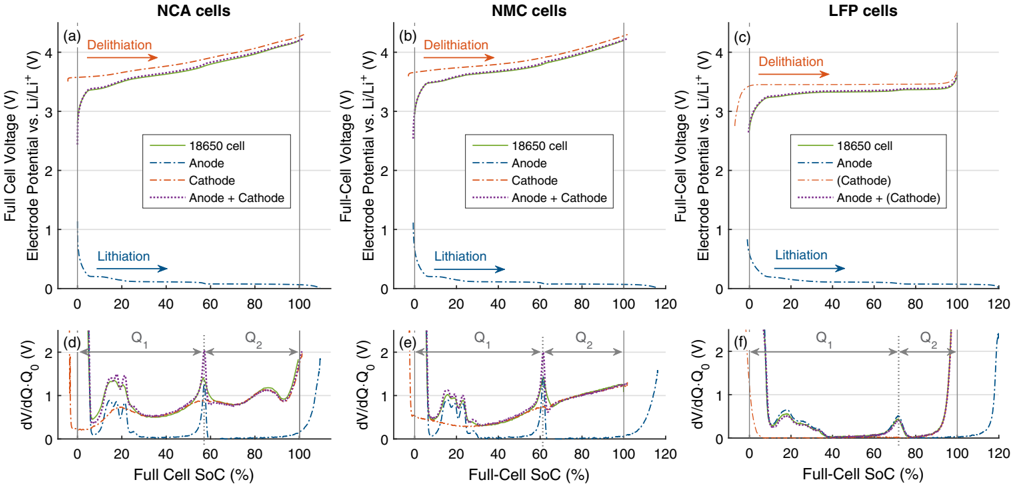
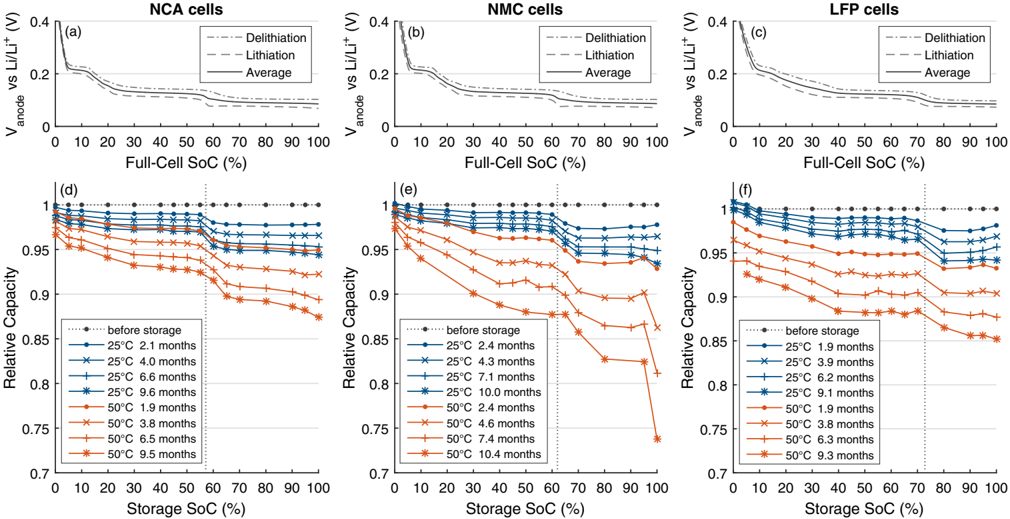
In this study, the calendar aging of lithium-ion batteries is investigated at different temperatures for 16 states of charge (SoCs) from 0 to 100%. Three types of 18650 lithium-ion cells, containing different cathode materials, have been examined. Our study demonstrates that calendar aging does not increase steadily with the SoC. Instead, plateau regions, covering SoC intervals of more than 20%–30% of the cell capacity, are observed wherein the capacity fade is similar. Differential voltage analyses confirm that the capacity fade is mainly caused by a shift in the electrode balancing. Furthermore, our study reveals the high impact of the graphite electrode on calendar aging. Lower anode potentials, which aggravate electrolyte reduction and thus promote solid electrolyte interphase growth, have been identified as the main driver of capacity fade during storage. In the high SoC regime where the graphite anode is lithiated more than 50%, the low anode potential accelerates the loss of cyclable lithium, which in turn distorts the electrode balancing. Aging mechanisms induced by high cell potential, such as electrolyte oxidation or transition-metal dissolution, seem to play only a minor role. To maximize battery life, high storage SoCs corresponding to low anode potential should be avoided.
Overview
The claims and statistics of this paper haven’t been checked yet.
Run the check — free, no account needed. It reads the open-access text and checks the sources it cites.
Integrity signals
Registry
Cites
Statistics
Figures


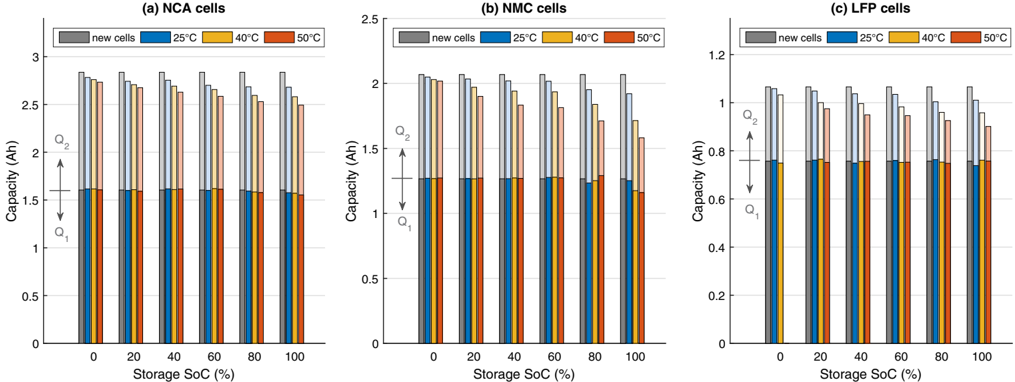
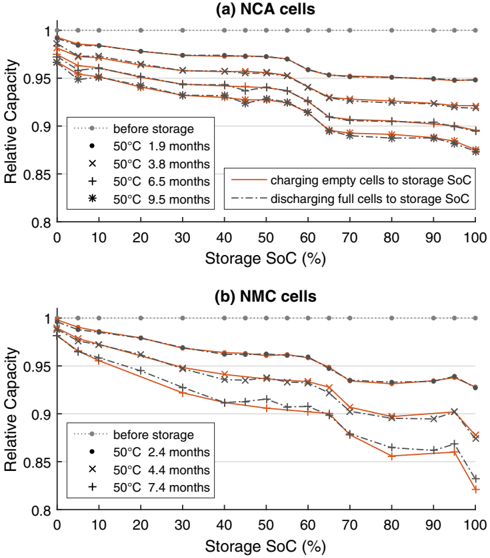
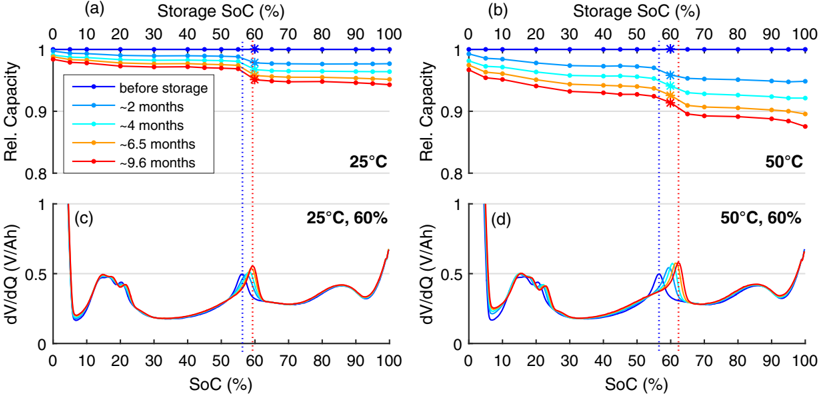
Verification
Claims the paper makes
The claims and statistics of this paper haven’t been checked yet.
Run the check — free, no account needed. It reads the open-access text and checks the sources it cites.
Claims other papers make about this one
Each is checked against this paper’s own text: does it say what the citing paper says it does?
In the citing paper
“Through the progression of each peak in IC/DV curves throughout ageing, and observing the change of the active materials over time, degradation mechanism can be distinguished [52].”
From Data-driven health estimation and lifetime prediction of lithium-ion batteries: A review (2019) · cites this paper as [52]
Self-check
Percentages, sums and reported differences re-computed from the paper’s own numbers.
The self-check needs the paper’s full text.
Citations
Cites
Ageing mechanisms in lithium-ion batteries
Vetter, J., Novák, P., Wagner, M. R., Veit, C., Möller, K.-C., Besenhard, J. O., Winter, M., Wohlfahrt-Mehrens, M., Vogler, C., & Hammouche, A. (2005) · Journal of Power Sources · doi:10.1016/j.jpowsour.2005.01.006 · Cited by 3,987
Main aging mechanisms in Li ion batteries
Broussely, M., Biensan, P., Bonhomme, F., Blanchard, P., Herreyre, S., Nechev, K., & Staniewicz, R. J. (2005) · Journal of Power Sources · doi:10.1016/j.jpowsour.2005.03.172 · Cited by 1,162
Ohzuku, T., Iwakoshi, Y., & Sawai, K. (1993) · Journal of The Electrochemical Society · doi:10.1149/1.2220849 · Cited by 1,095
Synthesize battery degradation modes via a diagnostic and prognostic model
Dubarry, M., Truchot, C., & Liaw, B. Y. (2012) · Journal of Power Sources · doi:10.1016/j.jpowsour.2012.07.016 · Cited by 1,065
Calendar and cycle life study of Li(NiMnCo)O2-based 18650 lithium-ion batteries
Ecker, M., Nieto, N., Käbitz, S., Schmalstieg, J., Blanke, H., Warnecke, A., & Sauer, D. U. (2013) · Journal of Power Sources · doi:10.1016/j.jpowsour.2013.09.143 · Cited by 809
Structure and performance of LiFePO4 cathode materials: A review
Zhang, W. (2010) · Journal of Power Sources · doi:10.1016/j.jpowsour.2010.11.113 · Cited by 774
Aging mechanism in Li ion cells and calendar life predictions
Broussely, M., Herreyre, S., Biensan, P., Kasztejna, P., Nechev, K., & Staniewicz, R. J. (2001) · Journal of Power Sources · doi:10.1016/s0378-7753(01)00722-4 · Cited by 728
An accelerated calendar and cycle life study of Li-ion cells
Bloom, I., Cole, B., Sohn, J.-B., Jones, S. A., Polzin, E. G., Battaglia, V., Henriksen, G. L., Motloch, C. G., Richardson, R., Unkelhaeuser, T., et al. (2001) · Journal of Power Sources · doi:10.1016/s0378-7753(01)00783-2 · Cited by 623
Differential voltage analyses of high-power, lithium-ion cells
Bloom, I., Jansen, A. N., Abraham, D. P., Knuth, J., Jones, S. A., Battaglia, V. S., & Henriksen, G. L. (2005) · Journal of Power Sources · doi:10.1016/j.jpowsour.2004.07.021 · Cited by 585
Keil, P., & Jossen, A. (2016) · Journal of Energy Storage · doi:10.1016/j.est.2016.02.005 · Cited by 482
Self-citation
Cited by
Sorted by citations
Items 401–500 of 670
Bauer, M. K. G., Harlow, J. E., Hynes, T., & Dahn, J. R. (2023) · Journal of The Electrochemical Society · doi:10.1149/1945-7111/acc6f6 · Cited by 8
Electrolytic Fluorine Production in Germany
Neumark, H. R. (1947) · Transactions of The Electrochemical Society · doi:10.1149/1.3071789 · Cited by 8
Brehm, J., Altmann, M., Mehlsam, L., Kotter, P., & Jossen, A. (2025) · Journal of The Electrochemical Society · doi:10.1149/1945-7111/ade345 · Cited by 7
Self-citationLedro, M., Zepter, J. M., Paludan, M., Idehen, O. E., & Marinelli, M. (2025) · Future Batteries · doi:10.1016/j.fub.2025.100079 · Cited by 7
Klaproth, T., Berendes, E., Lehmann, T., Kratzing, R., & Ufert, M. (2025) · World Electric Vehicle Journal · doi:10.3390/wevj16080419 · Cited by 8
Scalable Energy Management Model for Integrating V2G Capabilities into Renewable Energy Communities
Pezzati, N., Innocenti, E., Berzi, L., & Delogu, M. (2025) · World Electric Vehicle Journal · doi:10.3390/wevj16080450 · Cited by 8
Environment-Adaptive Online Learning for Portable Energy Storage Based on Porous Electrode Model
He, G., Ding, Y., Wu, Z., Chen, X., Zhang, D., & Song, J. (2024) · IEEE Transactions on Automation Science and Engineering · doi:10.1109/tase.2024.3485541 · Cited by 7
Peak Shaving of a Grid connected-Photovoltaic Battery System at Helmholtz Institute Ulm (HIU)
Boyouk, N., Munzke, N., & Hiller, M. (2018) · IEEE PES Innovative Smart Grid Technologies Europe · doi:10.1109/isgteurope.2018.8571616 · Cited by 7
Battery lifetime estimation for energy efficient telecommunication networks in smart cities
Gorla, P., & Chamola, V. (2021) · Sustainable Energy Technologies and Assessments · doi:10.1016/j.seta.2021.101205 · Cited by 7
Solid Electrolyte Interphase Growth in Lithium Metal Cells With Normal Electrolyte Flow
Parekh, M. N., & Rahn, C. D. (2022) · Frontiers in Chemical Engineering · doi:10.3389/fceng.2022.828054 · Cited by 7
Kumar, P., Mulukutla, P., & Doshi, P. (2024) · doi:10.46830/wriwp.22.00097 · Cited by 7
Discharge Rate Capability in Aged Li-Ion Batteries
Salinas, F., & Kowal, J. (2020) · Journal of The Electrochemical Society · doi:10.1149/1945-7111/abc207 · Cited by 6
Kunz, A., Kirst, C., Durdel, A., Singer, J. P., & Jossen, A. (2025) · Journal of Power Sources · doi:10.1016/j.jpowsour.2024.235732 · Cited by 6
Self-citationAnalysis of hybrid solutions with Li-ion battery system for DP-2 vessels
Durgaprasad, S., Malbašić, Z., Popov, M., & Lekić, A. (2024) · Heliyon · doi:10.1016/j.heliyon.2024.e37068 · Cited by 6
askarzadehardestani, M. A., Essmann, S., & Schröder, D. (2025) · Batteries & Supercaps · doi:10.1002/batt.202500286 · Cited by 10
Vachenauer, V., Karger, A., Naumann, M., Durdel, A., & Jossen, A. (2025) · Journal of Power Sources · doi:10.1016/j.jpowsour.2025.237779 · Cited by 7
Self-citationCathode voltage slope determining Li plating risk: Why LiFePO4 needs a higher N/P ratio than LiCoO2
Kim, M., Kwon, M.-S., Ha, J., Ka, B., Nam, S., & Ahn, S. D. (2025) · Nano Energy · doi:10.1016/j.nanoen.2025.111521 · Cited by 6
Kiefer, S. A., Bruch, M., Henning, H., & Graczyk, M. (2025) · Journal of Power Sources · doi:10.1016/j.jpowsour.2025.238815 · Cited by 6
Yao, J., Billings, B. W., Gao, T., Hedengren, J. D., & Powell, K. M. (2025) · Energy Conversion and Management · doi:10.1016/j.enconman.2025.120947 · Cited by 6
Sinha, S. S., Lehman, B., & Bharadwaj, P. (2025) · IEEE Open Journal of Power Electronics · doi:10.1109/ojpel.2025.3639205 · Cited by 6
Mousa, H. H. H., Lehtonen, M., & Mahmoud, K. (2026) · Applied Energy · doi:10.1016/j.apenergy.2026.127500 · Cited by 7
Cai, L., Holdstock, M., Morganti, M. V., Ayyapureddi, S., & McGordon, A. (2024) · IEEE Access · doi:10.1109/access.2024.3474172 · Cited by 6
Azzam, M., Ehrensberger, M., Endisch, C., Sauer, D. U., & Lewerenz, M. (2024) · Batteries & Supercaps · doi:10.1002/batt.202400627 · Cited by 6
Snapshot SoC identification with Pulse Injection Aided Machine Learning
Fahmy, Y., Wang, W., West, A. C., & Preindl, M. (2021) · Journal of Energy Storage · doi:10.1016/j.est.2021.102891 · Cited by 6
Modeling Voltage Decay During Calendar-Life Aging
Lü, D., Trimboli, M. S., Wang, Y., & Plett, G. L. (2022) · Journal of The Electrochemical Society · doi:10.1149/1945-7111/acaa5d · Cited by 6
Lall, P., Soni, V., Sethi, G., & Yiang, K. (2022) · I-THERM :/I-THERM - Intersociety Conference on Thermal Phenomena in Electronic Systems · doi:10.1109/itherm54085.2022.9899574 · Cited by 6
Schoof, R., Castelli, G. F., & Dörfler, W. (2023) · Computers & Mathematics with Applications · doi:10.1016/j.camwa.2023.08.027 · Cited by 6
Goldammer, E., & Kowal, J. (2020) · IEEE Vehicle Power and Propulsion Conference (VPPC) · doi:10.1109/vppc49601.2020.9330948 · Cited by 7
Experimental investigation of thermal runaway in 40Ah prismatic lithium batteries at different SOC
Wei, N., & Li, M. (2024) · Anais da Academia Brasileira de Ciências · doi:10.1590/0001-3765202420230648 · Cited by 6
Navigating the spectrum of battery health management in electric vehicles: A comprehensive review
Saravanan, L., Indragandhi, V., & Ashok, B. (2025) · Elsevier eBooks · doi:10.1016/b978-0-443-40304-0.00008-2 · Cited by 5
Majherova, V., Fiamegkou, E., Nakhanivej, P., Bree, G., Gott, J. A., Menon, A. S., Fajardo, G. J. P., Widanage, W. D., Dimitrijevic, A., Belekoukia, M., et al. (2025) · Journal of The Electrochemical Society · doi:10.1149/1945-7111/adfe98 · Cited by 5
Galatro, D., Sertu, B. B., & Chakraborty, S. (2025) · Computer Applications in Engineering Education · doi:10.1002/cae.70099 · Cited by 5
Liang, S., Lu, P., Hu, H., Fu, J., Zhang, J., Hu, G., Tuo, K., Liu, T., Wang, C., Wang, Z. H., et al. (2026) · Advanced Energy Materials · doi:10.1002/aenm.202505745 · Cited by 5
Li, X., Yu, D., Vilsen, S. B., Jindal, P., Subramanian, V. R., & Stroe, D. (2026) · eTransportation · doi:10.1016/j.etran.2026.100561 · Cited by 5
Prakash, N., Verma, A., Weddle, P. J., Colclasure, A. M., Schulze, M. C., Carroll, G. M., McBrayer, J., Rodrigues, M.-T. F., Kim, J. H., Pach, G. F., et al. (2026) · Cell Reports Physical Science · doi:10.1016/j.xcrp.2026.103250 · Cited by 5
Limits of electrochemical data for predicting battery lifetime and failure
Attia, P. M., Weng, A., & Chueh, W. C. (2026) · Joule · doi:10.1016/j.joule.2026.102423 · Cited by 5
Physics‐Informed Artificial Intelligence for Battery Degradation, Aging, and Lifetime Prediction
Sulaima, M. F., Arora, S., Frischer, R., & Namazi, H. (2026) · Battery energy · doi:10.1002/bte2.70136 · Cited by 5
Application of Control Algorithms for Battery Scheduling in Grid-Connected Energy Prosumers
Becchi, L., Bindi, M., Intravaia, M., Grasso, F., Pasqui, M., & Carcasci, C. (2024) · IEEE Mediterranean Electrotechnical Conference (MELECON) · doi:10.1109/melecon56669.2024.10608734 · Cited by 5
Accelerating float current measurement with temperature ramps revealing entropy insights
Azzam, M., Ehrensberger, M., Endisch, C., & Lewerenz, M. (2024) · Journal of Energy Storage · doi:10.1016/j.est.2024.114142 · Cited by 5
Simple Method to Estimate Battery Lifetime and Upkeep of Lead-Acid and Lithium-Ion Batteries
Bolsi, P. C., Prado, E. O., Nazaré, R. D. J., Sartori, H. C., & Pinheiro, J. R. (2024) · Eletrônica de Potência · doi:10.18618/rep.e202456 · Cited by 5
Azzam, M., Aydin, A., Endisch, C., Sauer, D. U., & Lewerenz, M. (2025) · Journal of The Electrochemical Society · doi:10.1149/1945-7111/adef85 · Cited by 5
Seara, J., Alcaide, F., Barrio, V. L., Benayad, A., & Ayerbe, E. (2022) · Journal of The Electrochemical Society · doi:10.1149/1945-7111/ac8a1d · Cited by 5
Determination of Cycle to Cycle Battery Cell Degradation with High-Precision Measurements
Schürholz, D., Schweighofer, B., Neumayer, M., & Wegleiter, H. (2022) · Applied Sciences · doi:10.3390/app122311876 · Cited by 5
Accurate LLI and LAMPE Estimation Using the Mechanistic Modeling Approach with Layered Oxides
Dubarry, M., Agrawal, V., Hüske, M., & Kuipers, M. (2023) · Journal of The Electrochemical Society · doi:10.1149/1945-7111/ace21c · Cited by 5
Cui, X., Stroebl, F., Uppaluri, M., Lam, V., Chueh, W. C., & Onori, S. (2025) · Journal of The Electrochemical Society · doi:10.1149/1945-7111/adde16 · Cited by 5
Yu, Q., Kiran, I., Ehrensberger, M., Streck, L., Roth, T., Jossen, A., Endisch, C., & Lewerenz, M. (2025) · Journal of The Electrochemical Society · doi:10.1149/1945-7111/ade295 · Cited by 5
Self-citationShan, H., Zhang, Z., Cao, H., Fan, B., Hou, G., Cao, H., Tang, Y., & Zheng, G. (2021) · Surfaces and Interfaces · doi:10.1016/j.surfin.2021.101235 · Cited by 5
Cycling of Double-Layered Graphite Anodes in Pouch-Cells
Müller, D., Fill, A., & Birke, K. P. (2022) · Batteries · doi:10.3390/batteries8030022 · Cited by 5
Impact Evaluation of Driving Style on Electric Vehicle Battery based on Field Testing Result
Chou, K. S., Aguiari, D., Tse, R. T., Tang, S.-K., & Pau, G. (2023) · IEEE Consumer Communications and Networking Conference · doi:10.1109/ccnc51644.2023.10060822 · Cited by 5
Distributed Power Processing based Cell-level Battery Energy Storage System
Pragallapati, N., Ranade, S. J., Moonem, M. A., & Atcitty, S. (2018) · IEEE International Symposium on Power Electronics for Distributed Generation Systems (PEDG) · doi:10.1109/pedg.2018.8447709 · Cited by 5
Resch, S., & Luther, M. (2020) · IEEE International Conference on Industrial Electronics for Sustainable Energy Systems (IESES) · doi:10.1109/ieses45645.2020.9210637 · Cited by 5
Kropkowski, L., Oestreich, T., Li, F., Burger, A., Nedjalkov, A., Würsig, A., & Schade, W. (2025) · Batteries · doi:10.3390/batteries11060218 · Cited by 4
Darikas, G., Dubarry, M., Barai, A., Amor-Segan, M., & Greenwood, D. G. (2025) · Journal of The Electrochemical Society · doi:10.1149/1945-7111/adfca1 · Cited by 4
Understanding Calendar Aging of Thiophosphate-Based Solid-State Batteries
Deng, R., Das, R., Wu, R., Xu, K., Shao, B., & Han, F. (2025) · Journal of The Electrochemical Society · doi:10.1149/1945-7111/ae0f59 · Cited by 4
Gao, Y., Chu, D., Chen, Q., & Lu, L. (2025) · IEEE Transactions on Transportation Electrification · doi:10.1109/tte.2025.3624578 · Cited by 4
Darikas, G., Kirca, M. C., Saniee, N. F., Rashid, M., Muhaddisoglu, I. M., Dinh, T. Q., & McGordon, A. (2026) · Batteries · doi:10.3390/batteries12010022 · Cited by 4
Mitigating Calendar Aging in Si-NMC Batteries with Advanced Dual-Salt Glyme Electrolytes
Yang, G. H., Browning, K. L., Meyer, H. M., Li, Y., Neale, N. R., Veith, G. M., & Nanda, J. (2024) · Chemistry of Materials · doi:10.1021/acs.chemmater.4c00971 · Cited by 4
Eissa, M. A., & Chen, P. (2024) · IFAC-PapersOnLine · doi:10.1016/j.ifacol.2025.01.141 · Cited by 4
Ye, W., Chen, X., Xu, H., Xie, Y., Gong, F., He, L., Han, X., Wang, H., & Ouyang, M. (2025) · Journal of Energy Chemistry · doi:10.1016/j.jechem.2025.09.006 · Cited by 4
The effect of battery charging method on reducing battery capacity in off-grid solar home systems
Zamani, S., & Hamzeh, M. (2023) · Energy Reports · doi:10.1016/j.egyr.2023.10.026 · Cited by 4
Geuder, K., Klick, S., Finster, P., Graff, K. M., Winter, M., Nowak, S., Seifert, H. J., & Ziebert, C. (2024) · Batteries · doi:10.3390/batteries10080275 · Cited by 5
Ohrelius, M., Lindström, R. W., & Lindbergh, G. (2024) · Journal of The Electrochemical Society · doi:10.1149/1945-7111/ad92db · Cited by 4
Serarslan, B. (2025) · International Journal of Automotive Science And Technology · doi:10.30939/ijastech..1519778 · Cited by 5
Galatro, D., & Amon, C. H. (2025) · Journal of Energy Storage · doi:10.1016/j.est.2025.116657 · Cited by 4
Insights into the stress-induced acceleration mechanism on calendar aging of lithium-ion battery
Li, Y., Qu, X., Huang, J., Fu, G., Chen, X., Li, K., Shen, W., & Lin, Y. (2025) · Journal of Power Sources · doi:10.1016/j.jpowsour.2025.237415 · Cited by 4
Friedrich, S., Mährlein, J., Durdel, A., & Jossen, A. (2025) · Journal of The Electrochemical Society · doi:10.1149/1945-7111/ade1ff · Cited by 4
Self-citationAzzam, M., Sauer, D. U., Endisch, C., & Lewerenz, M. (2025) · Batteries & Supercaps · doi:10.1002/batt.202500349 · Cited by 4
Bolsi, P. C., Prado, E. O., Nazaré, R. D. J., Sartori, H. C., & Pinheiro, J. R. (2023) · IEEE Brazilian Power Electronics Conference and Southern Power Electronics Conference · doi:10.1109/spec56436.2023.10408219 · Cited by 4
Hardware‐in‐the‐loop test for real‐time economic control of a DC microgrid
Doroudchi, E., Feng, X., Strank, S. M., Hebner, R., & Kyyrä, J. (2019) · The Journal of Engineering · doi:10.1049/joe.2018.8153 · Cited by 4
Life Testing of COTS Cells for Optimum Battery Sizing
Buckle, R. (2019) · European Space Power Conference (ESPC) · doi:10.1109/espc.2019.8932029 · Cited by 4
Ali, H. A. A., & Abdeljawad, Z. N. (2020) · DiVA (Mälardalen University College) · Cited by 4
Least Cost Vehicle Charging in a Smart Neighborhood Considering Uncertainty and Battery Degradation
Schade, C., Aliasghari, P., Egging, R., & Pfister, C. (2025) · Batteries · doi:10.3390/batteries11030104 · Cited by 3
García, A., Serrano, J. M., Egea, J. M. H., Bekaert, É., Herrán, A., & Marco-Gimeno, J. (2025) · SAE technical papers on CD-ROM/SAE technical paper series · doi:10.4271/2025-01-8131 · Cited by 3
Pereira, E. L., Ogun, D. G., & Soares, D. M. (2025) · ChemElectroChem · doi:10.1002/celc.202400708 · Cited by 3
Petrin, G. K., Arens, S., Schoenfeld, P., Klement, P., & Schlüters, S. (2025) · Applied Energy · doi:10.1016/j.apenergy.2025.126492 · Cited by 5
User-Centric Routing and Adaptive Charging EVCS for Battery Longevity and Improved Drive Anxiety
Suraj, S., Manjarekar, N. S., Barik, S., Swain, S., & Kashyap, K. (2025) · IEEE Access · doi:10.1109/access.2025.3619265 · Cited by 3
Degradation path indicators for lithium-ion batteries
Ramasubramanian, S., Plank, C., Danzer, M. A., & Röder, F. (2025) · Journal of Energy Storage · doi:10.1016/j.est.2025.119113 · Cited by 3
Daily operational impacts on battery degradation in heavy-duty electric drayage trucks
Shiledar, A., Lucero, J. N. E., Sun, R., Villani, M., Sujan, V. A., Onori, S., & Rizzoni, G. (2026) · eTransportation · doi:10.1016/j.etran.2026.100567 · Cited by 3
Risk-averse microgrid reconfiguration under demand uncertainty and storage degradation
Asghari, M., Afshari, H., Jaber, M. Y., & Searcy, C. (2026) · Computers & Industrial Engineering · doi:10.1016/j.cie.2026.111926 · Cited by 3
Degradation-Aware Learning-Based Control for Residential PV–Battery Systems
Ammari, A. C. (2026) · Energies · doi:10.3390/en19061434 · Cited by 3
Cobb, A., Ramirez-Meyers, K., Michalek, J. J., Swaminathan, S., Gasper, P. J., Polzin, B. J., & Smith, K. A. (2026) · Applied Energy · doi:10.1016/j.apenergy.2026.127809 · Cited by 5
Lipko, D., Yamnenko, I., Manzhelii, A., & Bondarenko, O. F. (2023) · IEEE KhPI Week on Advanced Technology (KhPIWeek) · doi:10.1109/khpiweek61412.2023.10312983 · Cited by 4
Li, Y., Zhang, S., Yang, L., Gong, Q., Li, X., & Fan, B. (2024) · Frontiers in Energy Research · doi:10.3389/fenrg.2024.1469594 · Cited by 3
A Lifetime Evaluation Method for Lithium-Sulfur Batteries
Okanishi, K., Hiraoka, K., Watanabe, M., & Seki, S. (2024) · Journal of The Electrochemical Society · doi:10.1149/1945-7111/ad92e4 · Cited by 3
A Novel Approach on Battery Health Monitoring
Eider, M., Bodenschatz, N., Berl, A., Danner, P., & de Meer, H. (2018) · Cited by 3
Modelling and fault diagnosis of lithium-ion battery for electric powertrain
Soloy, A., Bartoli, T., & Haıdar, F. (2023) · International Journal of Automotive Science And Technology · doi:10.30939/ijastech..1295130 · Cited by 3
Li, D., & Zhang, Q. (2024) · Journal of Energy Storage · doi:10.1016/j.est.2024.110907 · Cited by 3
Using partial charge-discharge cycle of battery to increase its lifespan
Lipko, D., & Bondarenko, O. F. (2023) · Technology and design in electronic equipment · doi:10.15222/tkea2023.3-4.09 · Cited by 3
Implementation and Test of a 48 V Smart Battery System with Integrated DC/DC Converter
Morello, R., Schwarz, R., Hoedemaekers, E., Habenschaden, F., Rienzo, R. D., Roncella, R., Saletti, R., Rosca, B., Steffenhagen, T., Lorentz, V., et al. (2019) · IEEE International Symposium on Industrial Electronics (ISIE) · doi:10.1109/isie.2019.8781159 · Cited by 3
One-step synthesis of vanadium-doped anatase mesocrystals for Li-ion battery anodes
Boytsova, O. V., Drozhzhin, O. A., Petukhov, D. I., Chumakova, A., Sobol, A. G., Beltiukov, A. N., Eliseev, A. A., & Bosak, A. (2021) · Nanotechnology · doi:10.1088/1361-6528/ac317a · Cited by 3
Levelized Cost of Electricity with Storage Degradation
Lai, C., Locatelli, G., Pimm, A. J., Li, X., & Lai, L. (2018) · White Rose Research Online (University of Leeds, The University of Sheffield, University of York) · Cited by 3
Dynamic Generation of Recommendations for EV Battery Health
Eider, M., & Berl, A. (2018) · AEIT International Conference of Electrical and Electronic Technologies for Automotive (AEIT AUTOMOTIVE) · doi:10.23919/eeta.2018.8493182 · Cited by 3
Streck, L., Roth, T., Bosch, H., Noel, A., Keil, P., & Jossen, A. (2024) · Journal of The Electrochemical Society · doi:10.1149/1945-7111/ad940e · Cited by 2
Self-citationPhysics‐Based Inverse Modeling of Battery Degradation with Bayesian Methods
Philipp, M., Kuhn, Y., Latz, A., & Horstmann, B. (2025) · ChemSusChem · doi:10.1002/cssc.202402336 · Cited by 2
Park, C., Lee, Y., & Park, K. (2025) · Journal of Materials Chemistry A · doi:10.1039/d5ta05063d · Cited by 2
Caballé, J., Segovia, P., Ocampo‐Martínez, C., & Quijano, N. (2025) · Control Engineering Practice · doi:10.1016/j.conengprac.2025.106669 · Cited by 2
Scharpmann, P., Leonhardt, R., Schmidt, A., Kowal, J., Tichter, T., & von Nidda, J. K. (2025) · Journal of Power Sources · doi:10.1016/j.jpowsour.2025.239072 · Cited by 2
Locational marginal value of battery network
Chen, X., Tan, P., Yang, Y., & He, G. (2025) · European Journal of Operational Research · doi:10.1016/j.ejor.2025.12.027 · Cited by 2
Metadata
- Authors
- Keil, P., Schuster, S. F., Wilhelm, J., Travi, J., Hauser, A., Karl, R. C., & Jossen, A.
- Affiliations
- Technical University of Munich (DE)
- TUM CREATE (SG)
- Venue
- Journal of The Electrochemical Society
- Publisher
- The Electrochemical Society
- Published
- 2016
- Volume
- 163
- Issue
- 9
- Pages
- A1872-A1880
- ISSN
- 0013-4651 (ISSN-L)
- 1945-7111
- OpenAlex
- W2464273419
- Cited by
- 669
- References
- 55
- Citations by year
- 2026: 83 · 2025: 113 · 2024: 93 · 2023: 73 · 2022: 72 · 2021: 66 · 2020: 58 · 2019: 40 · 2018: 43 · 2017: 25 · 2016: 1
- Type
- paratext
- Language
- en
- Open access
- hybrid
- doi.org
- Licence
- cc-by
- Locations
- Journal of The Electrochemical Society (publishedVersion, cc-by)
- mediaTUM – the media and publications repository of the Technical University Munich (Technical University Munich) (submittedVersion, other-oa)
- Topics
- Physical Sciences › Engineering › Automotive Engineering › Battery Modeling and Management
- Physical Sciences › Engineering › Electrical and Electronic Engineering › Advancements in Battery Materials
- Physical Sciences › Materials Science › Metals and Alloys › Extraction and Separation Processes
- Keywords
- calendar aging, lithium-ion batteries, storage temperature, state of charge, capacity fade, 18650 cells, cathode materials, graphite anode, solid electrolyte interphase, electrolyte reduction, anode potential, electrolyte oxidation, transition metal dissolution, battery energy storage
About these checks
Registry, retraction, Cites and statistics results are computed, not judged, with one exception: a printed reference that no index lists is read once by a model before it counts as a citation error. Claims are extracted by a model and kept only when their quote appears verbatim in the text; each cited source is then checked, with a model’s help, for whether it says what the claim relies on. Those verdicts can be wrong — read the claim’s quote and the cited source before relying on one.
Statistics and arithmetic are recomputed, not judged.
Confidence bands are shown only for fields calibrated on our annotated test set. None is calibrated yet, so no band is shown.
What counts as a claim ›How we measure confidence ›How we check this ›
Are you an author, or do you see a problem with this page? Request a review
